
Key Insights
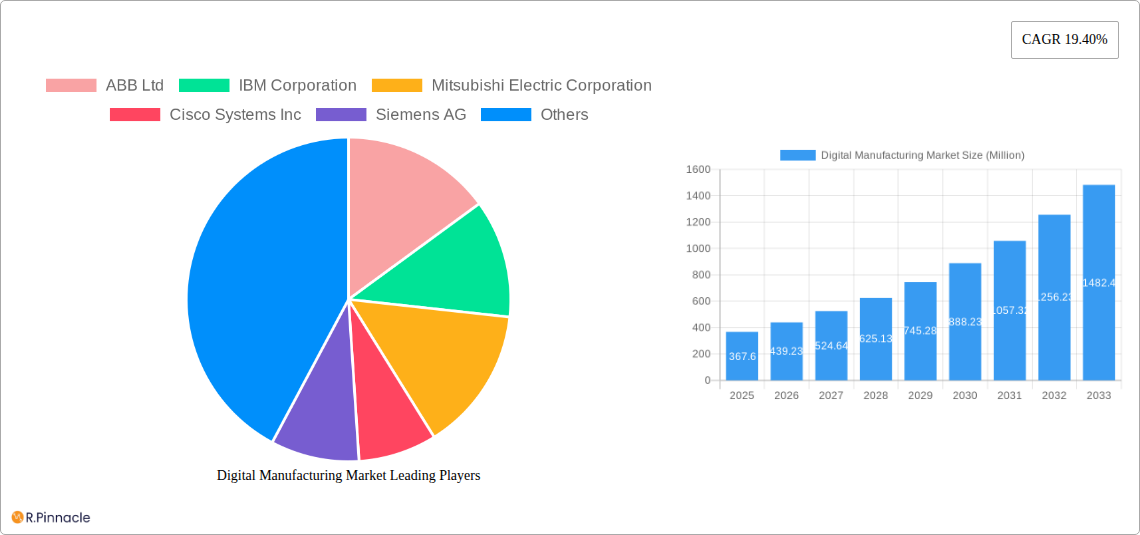
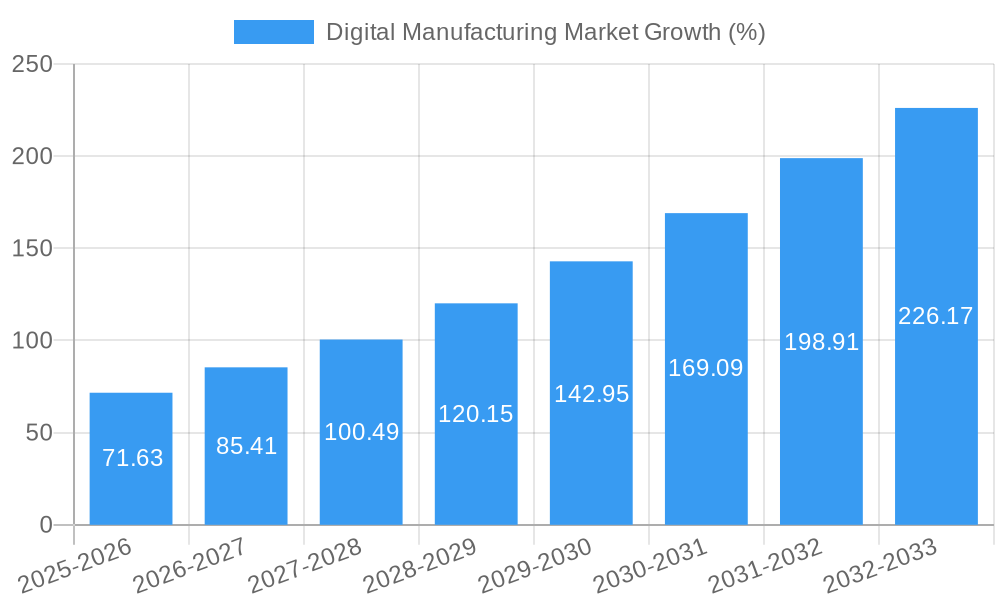
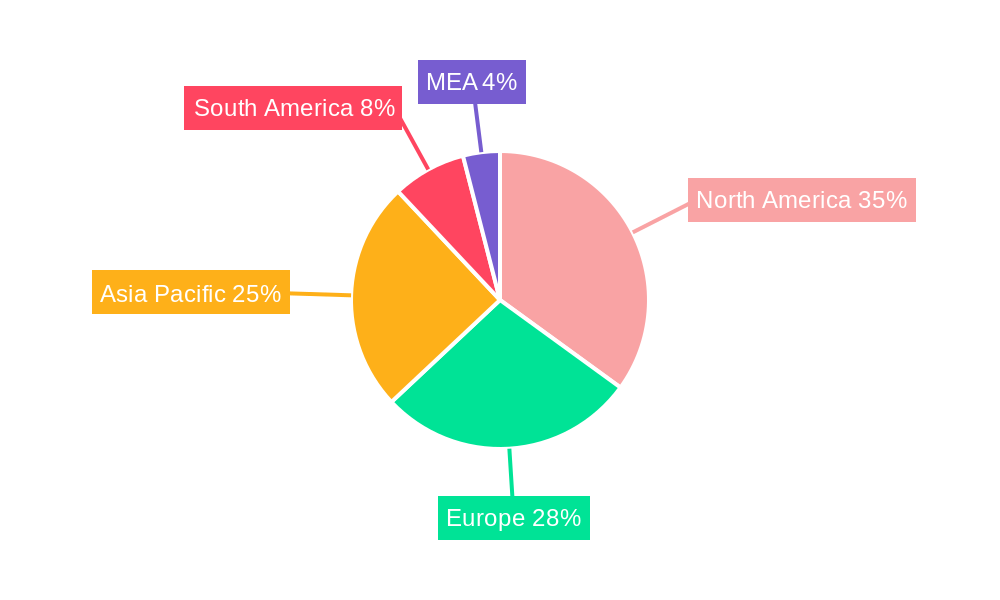
The Digital Manufacturing market is experiencing robust growth, projected to reach \$367.60 million in 2025 and expand significantly over the forecast period (2025-2033). A compound annual growth rate (CAGR) of 19.40% signifies strong market momentum driven by several key factors. Increased adoption of automation technologies like robotics and IoT across various industries for enhanced efficiency and productivity is a major driver. The growing demand for customized products and shorter lead times fuels the adoption of 3D printing and additive manufacturing. Furthermore, the rising need for robust cybersecurity solutions to protect sensitive manufacturing data and operational technology (OT) systems is bolstering market growth. Emerging trends such as AI-powered predictive maintenance and cloud-based manufacturing platforms are further accelerating market expansion. While challenges like high initial investment costs for advanced technologies and the need for skilled labor can act as restraints, the long-term benefits of increased efficiency, reduced costs, and improved product quality are expected to outweigh these limitations. The market is segmented by technology (Robotics, IoT, 3D Printing, Cybersecurity, Other Technologies) and geographically spread across North America, Europe, Asia Pacific, South America, and the Middle East & Africa, with North America and Asia Pacific expected to dominate due to higher technological adoption and robust industrial bases.
The market's growth is underpinned by the increasing integration of digital technologies across the manufacturing value chain, fostering a shift towards smart factories and Industry 4.0 principles. Leading companies like ABB, IBM, Siemens, and Microsoft are actively developing and implementing digital manufacturing solutions, fostering innovation and driving market expansion. Geographic variations in market growth are anticipated, reflecting the differences in industrial development, technological adoption rates, and government support policies across regions. While North America and Europe currently hold significant market share, the Asia Pacific region is expected to witness substantial growth owing to its burgeoning manufacturing sector and increasing government investment in digital infrastructure. The continued focus on improving supply chain resilience, enhancing product quality, and achieving sustainable manufacturing practices will further propel the digital manufacturing market towards sustained and accelerated growth in the coming years.
Digital Manufacturing Market Report: 2019-2033
This comprehensive report provides a detailed analysis of the Digital Manufacturing Market, encompassing market size, growth drivers, challenges, and future opportunities. The study period covers 2019-2033, with 2025 as the base year and a forecast period of 2025-2033. The report leverages extensive data analysis to offer actionable insights for industry professionals and investors. Key players such as ABB Ltd, IBM Corporation, Mitsubishi Electric Corporation, Cisco Systems Inc, Siemens AG, Schneider Electric SE, Microsoft Corporation, Oracle Corporation, General Electric Company, SAP SE, Intel Corporation, and Nortonlifelock Inc are profiled, providing a competitive landscape overview.
Digital Manufacturing Market Market Structure & Innovation Trends
This section analyzes the competitive landscape of the digital manufacturing market, examining market concentration, innovation drivers, regulatory frameworks, and M&A activities. The market is characterized by a moderately concentrated structure with several key players holding significant market share. For example, the top 5 players collectively hold approximately xx% of the market share in 2025 (estimated).
- Market Concentration: High, with a few dominant players. Market share analysis is provided for key players.
- Innovation Drivers: Advancements in technologies like AI, IoT, and cloud computing are driving innovation. Investments in R&D are crucial for maintaining a competitive edge.
- Regulatory Frameworks: Government regulations on data privacy, cybersecurity, and environmental sustainability are influencing market dynamics.
- Product Substitutes: The emergence of alternative technologies may pose a threat to existing digital manufacturing solutions.
- End-User Demographics: The increasing adoption of digital manufacturing technologies across various industries such as automotive, aerospace, and healthcare drives market growth.
- M&A Activities: Several significant mergers and acquisitions have taken place in the recent past, with an estimated xx Million in deal values over the past five years. This consolidation reflects the growing demand and high market attractiveness.
Digital Manufacturing Market Market Dynamics & Trends
The global digital manufacturing market is experiencing robust growth, driven by factors such as increasing automation, the adoption of Industry 4.0 principles, and the need for improved operational efficiency. The market is expected to exhibit a CAGR of xx% during the forecast period (2025-2033), reaching an estimated value of xx Million by 2033. This growth is fueled by a rising need for optimized production processes, reduced costs, and enhanced product quality across diverse industries. Technological disruptions, such as the rise of AI-powered automation and advanced analytics, are transforming manufacturing processes. Consumer preferences for customized products and faster delivery times are also influencing market dynamics. The competitive dynamics are marked by intense competition among established players and emerging startups, leading to continuous innovation and product development. Market penetration of digital manufacturing solutions is increasing significantly across various industries, showcasing the technology's widespread adoption.
Dominant Regions & Segments in Digital Manufacturing Market
North America currently holds the leading position in the digital manufacturing market, driven by strong technological advancements, robust infrastructure, and significant investments in automation.
- Key Drivers for North America:
- Advanced technological infrastructure
- High adoption rate of digital technologies
- Favorable government policies
- Strong presence of key players
- Segment Analysis:
- Robotics: This segment is experiencing significant growth driven by increasing automation needs in manufacturing processes. The increasing adoption of collaborative robots (cobots) is further contributing to the segment's expansion.
- IoT: The rising connectivity and data exchange capabilities are driving the adoption of IoT in digital manufacturing. This enables real-time monitoring, predictive maintenance, and improved process optimization.
- 3D Printing & Additive Manufacturing: This segment is witnessing strong growth propelled by its ability to create customized products, reduce material waste, and accelerate prototyping processes.
- Cybersecurity: Growing concerns about data breaches and cyberattacks are driving the adoption of robust cybersecurity solutions. This ensures the security and integrity of manufacturing operations.
- Other Technologies: This segment comprises technologies like cloud computing, big data analytics, and AR/VR, all of which are contributing to improved efficiency and decision-making in the digital manufacturing space.
The European market is also witnessing significant growth, supported by a large industrial base and supportive government policies promoting digitalization initiatives. Asia-Pacific is anticipated to witness substantial growth in the future, fuelled by rapid industrialization and increasing investments in automation.
Digital Manufacturing Market Product Innovations
Recent product developments focus on integrating AI, machine learning, and advanced analytics capabilities into digital manufacturing platforms to enhance efficiency, optimize production processes, and improve decision-making. These innovations enhance predictive maintenance, optimize supply chains, and facilitate the creation of more sophisticated and customized products, increasing market fit and creating significant competitive advantages.
Report Scope & Segmentation Analysis
This report segments the digital manufacturing market by technology: Robotics, IoT, 3D Printing and Additive Manufacturing, Cybersecurity, and Other Technologies. Each segment's growth projections, market size, and competitive dynamics are analyzed individually. The Robotics segment is projected to experience robust growth, driven by increasing automation needs. The IoT segment is expected to witness significant expansion due to the growing adoption of connected devices. The 3D Printing and Additive Manufacturing segment's growth is fueled by the increasing demand for customized products and rapid prototyping. The Cybersecurity segment is poised for substantial growth due to rising security concerns. Other Technologies, such as cloud computing and AI, are also anticipated to experience considerable expansion, driven by the increasing need for data-driven decision-making and improved efficiency.
Key Drivers of Digital Manufacturing Market Growth
The digital manufacturing market's growth is primarily fueled by technological advancements in automation, AI, and IoT, driving operational efficiency and productivity gains. Economic factors like the increasing need to reduce production costs and enhance product quality also significantly contribute. Supportive government regulations and policies promoting digitalization further accelerate market growth.
Challenges in the Digital Manufacturing Market Sector
Significant challenges include the high initial investment costs associated with implementing digital manufacturing technologies, the complexity of integrating different systems, and the need for skilled personnel. Supply chain disruptions and cybersecurity threats also pose significant challenges, potentially leading to production delays and financial losses.
Emerging Opportunities in Digital Manufacturing Market
Emerging opportunities lie in the expanding adoption of AI and machine learning in predictive maintenance, the rise of digital twins for real-time monitoring and optimization, and the increasing demand for customized products through additive manufacturing. New markets in developing economies also present significant growth potential.
Leading Players in the Digital Manufacturing Market Market
- ABB Ltd
- IBM Corporation
- Mitsubishi Electric Corporation
- Cisco Systems Inc
- Siemens AG
- Schneider Electric SE
- Microsoft Corporation
- Oracle Corporation
- General Electric Company
- SAP SE
- Intel Corporation
- Nortonlifelock Inc
Key Developments in Digital Manufacturing Market Industry
- May 2023: Siemens announced its focus on 3D printing in the US, leveraging its Charlotte Advanced Technology Collaboration Hub (CATCH) to foster collaboration and accelerate the industry's transformation.
- February 2023: Schneider Electric launched its Industrial Digital Transformation Services globally, aiming to assist industrial firms in achieving end-to-end digitization.
Future Outlook for Digital Manufacturing Market Market
The future of the digital manufacturing market is bright, driven by continuous technological advancements, increasing automation, and the rising demand for enhanced efficiency and customized products. Strategic partnerships, investments in R&D, and the adoption of innovative technologies will shape the market's future growth trajectory. The integration of AI, IoT, and other emerging technologies will further transform manufacturing processes, creating new opportunities for growth and innovation.
Digital Manufacturing Market Segmentation
-
1. Technology
- 1.1. Robotics
- 1.2. IoT
- 1.3. 3D Printing and Additive Manufacturing
- 1.4. Cybersecurity
- 1.5. Other Technologies
Digital Manufacturing Market Segmentation By Geography
-
1. North America
- 1.1. United States
- 1.2. Canada
-
2. Europe
- 2.1. Germany
- 2.2. United kingdom
- 2.3. France
- 2.4. Rest of Europe
-
3. Asia Pacific
- 3.1. China
- 3.2. Japan
- 3.3. India
- 3.4. Rest of Asia Pacific
- 4. Latin America
- 5. Middle East and Africa
Digital Manufacturing Market REPORT HIGHLIGHTS
| Aspects | Details |
|---|---|
| Study Period | 2019-2033 |
| Base Year | 2024 |
| Estimated Year | 2025 |
| Forecast Period | 2025-2033 |
| Historical Period | 2019-2024 |
| Growth Rate | CAGR of 19.40% from 2019-2033 |
| Segmentation |
|
Table of Contents
- 1. Introduction
- 1.1. Research Scope
- 1.2. Market Segmentation
- 1.3. Research Methodology
- 1.4. Definitions and Assumptions
- 2. Executive Summary
- 2.1. Introduction
- 3. Market Dynamics
- 3.1. Introduction
- 3.2. Market Drivers
- 3.2.1. Inclination of Manufacturers Toward Cost-efficient Processes; Proliferation of IoT
- 3.3. Market Restrains
- 3.3.1. Lack of Technical Expertise
- 3.4. Market Trends
- 3.4.1. Internet-of-Things (IoT) to Hold Major Market Share
- 4. Market Factor Analysis
- 4.1. Porters Five Forces
- 4.2. Supply/Value Chain
- 4.3. PESTEL analysis
- 4.4. Market Entropy
- 4.5. Patent/Trademark Analysis
- 5. Global Digital Manufacturing Market Analysis, Insights and Forecast, 2019-2031
- 5.1. Market Analysis, Insights and Forecast - by Technology
- 5.1.1. Robotics
- 5.1.2. IoT
- 5.1.3. 3D Printing and Additive Manufacturing
- 5.1.4. Cybersecurity
- 5.1.5. Other Technologies
- 5.2. Market Analysis, Insights and Forecast - by Region
- 5.2.1. North America
- 5.2.2. Europe
- 5.2.3. Asia Pacific
- 5.2.4. Latin America
- 5.2.5. Middle East and Africa
- 5.1. Market Analysis, Insights and Forecast - by Technology
- 6. North America Digital Manufacturing Market Analysis, Insights and Forecast, 2019-2031
- 6.1. Market Analysis, Insights and Forecast - by Technology
- 6.1.1. Robotics
- 6.1.2. IoT
- 6.1.3. 3D Printing and Additive Manufacturing
- 6.1.4. Cybersecurity
- 6.1.5. Other Technologies
- 6.1. Market Analysis, Insights and Forecast - by Technology
- 7. Europe Digital Manufacturing Market Analysis, Insights and Forecast, 2019-2031
- 7.1. Market Analysis, Insights and Forecast - by Technology
- 7.1.1. Robotics
- 7.1.2. IoT
- 7.1.3. 3D Printing and Additive Manufacturing
- 7.1.4. Cybersecurity
- 7.1.5. Other Technologies
- 7.1. Market Analysis, Insights and Forecast - by Technology
- 8. Asia Pacific Digital Manufacturing Market Analysis, Insights and Forecast, 2019-2031
- 8.1. Market Analysis, Insights and Forecast - by Technology
- 8.1.1. Robotics
- 8.1.2. IoT
- 8.1.3. 3D Printing and Additive Manufacturing
- 8.1.4. Cybersecurity
- 8.1.5. Other Technologies
- 8.1. Market Analysis, Insights and Forecast - by Technology
- 9. Latin America Digital Manufacturing Market Analysis, Insights and Forecast, 2019-2031
- 9.1. Market Analysis, Insights and Forecast - by Technology
- 9.1.1. Robotics
- 9.1.2. IoT
- 9.1.3. 3D Printing and Additive Manufacturing
- 9.1.4. Cybersecurity
- 9.1.5. Other Technologies
- 9.1. Market Analysis, Insights and Forecast - by Technology
- 10. Middle East and Africa Digital Manufacturing Market Analysis, Insights and Forecast, 2019-2031
- 10.1. Market Analysis, Insights and Forecast - by Technology
- 10.1.1. Robotics
- 10.1.2. IoT
- 10.1.3. 3D Printing and Additive Manufacturing
- 10.1.4. Cybersecurity
- 10.1.5. Other Technologies
- 10.1. Market Analysis, Insights and Forecast - by Technology
- 11. North America Digital Manufacturing Market Analysis, Insights and Forecast, 2019-2031
- 11.1. Market Analysis, Insights and Forecast - By Country/Sub-region
- 11.1.1 United States
- 11.1.2 Canada
- 11.1.3 Mexico
- 12. Europe Digital Manufacturing Market Analysis, Insights and Forecast, 2019-2031
- 12.1. Market Analysis, Insights and Forecast - By Country/Sub-region
- 12.1.1 Germany
- 12.1.2 United Kingdom
- 12.1.3 France
- 12.1.4 Spain
- 12.1.5 Italy
- 12.1.6 Spain
- 12.1.7 Belgium
- 12.1.8 Netherland
- 12.1.9 Nordics
- 12.1.10 Rest of Europe
- 13. Asia Pacific Digital Manufacturing Market Analysis, Insights and Forecast, 2019-2031
- 13.1. Market Analysis, Insights and Forecast - By Country/Sub-region
- 13.1.1 China
- 13.1.2 Japan
- 13.1.3 India
- 13.1.4 South Korea
- 13.1.5 Southeast Asia
- 13.1.6 Australia
- 13.1.7 Indonesia
- 13.1.8 Phillipes
- 13.1.9 Singapore
- 13.1.10 Thailandc
- 13.1.11 Rest of Asia Pacific
- 14. South America Digital Manufacturing Market Analysis, Insights and Forecast, 2019-2031
- 14.1. Market Analysis, Insights and Forecast - By Country/Sub-region
- 14.1.1 Brazil
- 14.1.2 Argentina
- 14.1.3 Peru
- 14.1.4 Chile
- 14.1.5 Colombia
- 14.1.6 Ecuador
- 14.1.7 Venezuela
- 14.1.8 Rest of South America
- 15. North America Digital Manufacturing Market Analysis, Insights and Forecast, 2019-2031
- 15.1. Market Analysis, Insights and Forecast - By Country/Sub-region
- 15.1.1 United States
- 15.1.2 Canada
- 15.1.3 Mexico
- 16. MEA Digital Manufacturing Market Analysis, Insights and Forecast, 2019-2031
- 16.1. Market Analysis, Insights and Forecast - By Country/Sub-region
- 16.1.1 United Arab Emirates
- 16.1.2 Saudi Arabia
- 16.1.3 South Africa
- 16.1.4 Rest of Middle East and Africa
- 17. Competitive Analysis
- 17.1. Global Market Share Analysis 2024
- 17.2. Company Profiles
- 17.2.1 ABB Ltd
- 17.2.1.1. Overview
- 17.2.1.2. Products
- 17.2.1.3. SWOT Analysis
- 17.2.1.4. Recent Developments
- 17.2.1.5. Financials (Based on Availability)
- 17.2.2 IBM Corporation
- 17.2.2.1. Overview
- 17.2.2.2. Products
- 17.2.2.3. SWOT Analysis
- 17.2.2.4. Recent Developments
- 17.2.2.5. Financials (Based on Availability)
- 17.2.3 Mitsubishi Electric Corporation
- 17.2.3.1. Overview
- 17.2.3.2. Products
- 17.2.3.3. SWOT Analysis
- 17.2.3.4. Recent Developments
- 17.2.3.5. Financials (Based on Availability)
- 17.2.4 Cisco Systems Inc
- 17.2.4.1. Overview
- 17.2.4.2. Products
- 17.2.4.3. SWOT Analysis
- 17.2.4.4. Recent Developments
- 17.2.4.5. Financials (Based on Availability)
- 17.2.5 Siemens AG
- 17.2.5.1. Overview
- 17.2.5.2. Products
- 17.2.5.3. SWOT Analysis
- 17.2.5.4. Recent Developments
- 17.2.5.5. Financials (Based on Availability)
- 17.2.6 Schneider Electric SE
- 17.2.6.1. Overview
- 17.2.6.2. Products
- 17.2.6.3. SWOT Analysis
- 17.2.6.4. Recent Developments
- 17.2.6.5. Financials (Based on Availability)
- 17.2.7 Microsoft Corporation
- 17.2.7.1. Overview
- 17.2.7.2. Products
- 17.2.7.3. SWOT Analysis
- 17.2.7.4. Recent Developments
- 17.2.7.5. Financials (Based on Availability)
- 17.2.8 Oracle Corporation
- 17.2.8.1. Overview
- 17.2.8.2. Products
- 17.2.8.3. SWOT Analysis
- 17.2.8.4. Recent Developments
- 17.2.8.5. Financials (Based on Availability)
- 17.2.9 General Electric Company
- 17.2.9.1. Overview
- 17.2.9.2. Products
- 17.2.9.3. SWOT Analysis
- 17.2.9.4. Recent Developments
- 17.2.9.5. Financials (Based on Availability)
- 17.2.10 SAP SE
- 17.2.10.1. Overview
- 17.2.10.2. Products
- 17.2.10.3. SWOT Analysis
- 17.2.10.4. Recent Developments
- 17.2.10.5. Financials (Based on Availability)
- 17.2.11 Intel Corporation
- 17.2.11.1. Overview
- 17.2.11.2. Products
- 17.2.11.3. SWOT Analysis
- 17.2.11.4. Recent Developments
- 17.2.11.5. Financials (Based on Availability)
- 17.2.12 Nortonlifelock Inc
- 17.2.12.1. Overview
- 17.2.12.2. Products
- 17.2.12.3. SWOT Analysis
- 17.2.12.4. Recent Developments
- 17.2.12.5. Financials (Based on Availability)
- 17.2.1 ABB Ltd
List of Figures
- Figure 1: Global Digital Manufacturing Market Revenue Breakdown (Million, %) by Region 2024 & 2032
- Figure 2: North America Digital Manufacturing Market Revenue (Million), by Country 2024 & 2032
- Figure 3: North America Digital Manufacturing Market Revenue Share (%), by Country 2024 & 2032
- Figure 4: Europe Digital Manufacturing Market Revenue (Million), by Country 2024 & 2032
- Figure 5: Europe Digital Manufacturing Market Revenue Share (%), by Country 2024 & 2032
- Figure 6: Asia Pacific Digital Manufacturing Market Revenue (Million), by Country 2024 & 2032
- Figure 7: Asia Pacific Digital Manufacturing Market Revenue Share (%), by Country 2024 & 2032
- Figure 8: South America Digital Manufacturing Market Revenue (Million), by Country 2024 & 2032
- Figure 9: South America Digital Manufacturing Market Revenue Share (%), by Country 2024 & 2032
- Figure 10: North America Digital Manufacturing Market Revenue (Million), by Country 2024 & 2032
- Figure 11: North America Digital Manufacturing Market Revenue Share (%), by Country 2024 & 2032
- Figure 12: MEA Digital Manufacturing Market Revenue (Million), by Country 2024 & 2032
- Figure 13: MEA Digital Manufacturing Market Revenue Share (%), by Country 2024 & 2032
- Figure 14: North America Digital Manufacturing Market Revenue (Million), by Technology 2024 & 2032
- Figure 15: North America Digital Manufacturing Market Revenue Share (%), by Technology 2024 & 2032
- Figure 16: North America Digital Manufacturing Market Revenue (Million), by Country 2024 & 2032
- Figure 17: North America Digital Manufacturing Market Revenue Share (%), by Country 2024 & 2032
- Figure 18: Europe Digital Manufacturing Market Revenue (Million), by Technology 2024 & 2032
- Figure 19: Europe Digital Manufacturing Market Revenue Share (%), by Technology 2024 & 2032
- Figure 20: Europe Digital Manufacturing Market Revenue (Million), by Country 2024 & 2032
- Figure 21: Europe Digital Manufacturing Market Revenue Share (%), by Country 2024 & 2032
- Figure 22: Asia Pacific Digital Manufacturing Market Revenue (Million), by Technology 2024 & 2032
- Figure 23: Asia Pacific Digital Manufacturing Market Revenue Share (%), by Technology 2024 & 2032
- Figure 24: Asia Pacific Digital Manufacturing Market Revenue (Million), by Country 2024 & 2032
- Figure 25: Asia Pacific Digital Manufacturing Market Revenue Share (%), by Country 2024 & 2032
- Figure 26: Latin America Digital Manufacturing Market Revenue (Million), by Technology 2024 & 2032
- Figure 27: Latin America Digital Manufacturing Market Revenue Share (%), by Technology 2024 & 2032
- Figure 28: Latin America Digital Manufacturing Market Revenue (Million), by Country 2024 & 2032
- Figure 29: Latin America Digital Manufacturing Market Revenue Share (%), by Country 2024 & 2032
- Figure 30: Middle East and Africa Digital Manufacturing Market Revenue (Million), by Technology 2024 & 2032
- Figure 31: Middle East and Africa Digital Manufacturing Market Revenue Share (%), by Technology 2024 & 2032
- Figure 32: Middle East and Africa Digital Manufacturing Market Revenue (Million), by Country 2024 & 2032
- Figure 33: Middle East and Africa Digital Manufacturing Market Revenue Share (%), by Country 2024 & 2032
List of Tables
- Table 1: Global Digital Manufacturing Market Revenue Million Forecast, by Region 2019 & 2032
- Table 2: Global Digital Manufacturing Market Revenue Million Forecast, by Technology 2019 & 2032
- Table 3: Global Digital Manufacturing Market Revenue Million Forecast, by Region 2019 & 2032
- Table 4: Global Digital Manufacturing Market Revenue Million Forecast, by Country 2019 & 2032
- Table 5: United States Digital Manufacturing Market Revenue (Million) Forecast, by Application 2019 & 2032
- Table 6: Canada Digital Manufacturing Market Revenue (Million) Forecast, by Application 2019 & 2032
- Table 7: Mexico Digital Manufacturing Market Revenue (Million) Forecast, by Application 2019 & 2032
- Table 8: Global Digital Manufacturing Market Revenue Million Forecast, by Country 2019 & 2032
- Table 9: Germany Digital Manufacturing Market Revenue (Million) Forecast, by Application 2019 & 2032
- Table 10: United Kingdom Digital Manufacturing Market Revenue (Million) Forecast, by Application 2019 & 2032
- Table 11: France Digital Manufacturing Market Revenue (Million) Forecast, by Application 2019 & 2032
- Table 12: Spain Digital Manufacturing Market Revenue (Million) Forecast, by Application 2019 & 2032
- Table 13: Italy Digital Manufacturing Market Revenue (Million) Forecast, by Application 2019 & 2032
- Table 14: Spain Digital Manufacturing Market Revenue (Million) Forecast, by Application 2019 & 2032
- Table 15: Belgium Digital Manufacturing Market Revenue (Million) Forecast, by Application 2019 & 2032
- Table 16: Netherland Digital Manufacturing Market Revenue (Million) Forecast, by Application 2019 & 2032
- Table 17: Nordics Digital Manufacturing Market Revenue (Million) Forecast, by Application 2019 & 2032
- Table 18: Rest of Europe Digital Manufacturing Market Revenue (Million) Forecast, by Application 2019 & 2032
- Table 19: Global Digital Manufacturing Market Revenue Million Forecast, by Country 2019 & 2032
- Table 20: China Digital Manufacturing Market Revenue (Million) Forecast, by Application 2019 & 2032
- Table 21: Japan Digital Manufacturing Market Revenue (Million) Forecast, by Application 2019 & 2032
- Table 22: India Digital Manufacturing Market Revenue (Million) Forecast, by Application 2019 & 2032
- Table 23: South Korea Digital Manufacturing Market Revenue (Million) Forecast, by Application 2019 & 2032
- Table 24: Southeast Asia Digital Manufacturing Market Revenue (Million) Forecast, by Application 2019 & 2032
- Table 25: Australia Digital Manufacturing Market Revenue (Million) Forecast, by Application 2019 & 2032
- Table 26: Indonesia Digital Manufacturing Market Revenue (Million) Forecast, by Application 2019 & 2032
- Table 27: Phillipes Digital Manufacturing Market Revenue (Million) Forecast, by Application 2019 & 2032
- Table 28: Singapore Digital Manufacturing Market Revenue (Million) Forecast, by Application 2019 & 2032
- Table 29: Thailandc Digital Manufacturing Market Revenue (Million) Forecast, by Application 2019 & 2032
- Table 30: Rest of Asia Pacific Digital Manufacturing Market Revenue (Million) Forecast, by Application 2019 & 2032
- Table 31: Global Digital Manufacturing Market Revenue Million Forecast, by Country 2019 & 2032
- Table 32: Brazil Digital Manufacturing Market Revenue (Million) Forecast, by Application 2019 & 2032
- Table 33: Argentina Digital Manufacturing Market Revenue (Million) Forecast, by Application 2019 & 2032
- Table 34: Peru Digital Manufacturing Market Revenue (Million) Forecast, by Application 2019 & 2032
- Table 35: Chile Digital Manufacturing Market Revenue (Million) Forecast, by Application 2019 & 2032
- Table 36: Colombia Digital Manufacturing Market Revenue (Million) Forecast, by Application 2019 & 2032
- Table 37: Ecuador Digital Manufacturing Market Revenue (Million) Forecast, by Application 2019 & 2032
- Table 38: Venezuela Digital Manufacturing Market Revenue (Million) Forecast, by Application 2019 & 2032
- Table 39: Rest of South America Digital Manufacturing Market Revenue (Million) Forecast, by Application 2019 & 2032
- Table 40: Global Digital Manufacturing Market Revenue Million Forecast, by Country 2019 & 2032
- Table 41: United States Digital Manufacturing Market Revenue (Million) Forecast, by Application 2019 & 2032
- Table 42: Canada Digital Manufacturing Market Revenue (Million) Forecast, by Application 2019 & 2032
- Table 43: Mexico Digital Manufacturing Market Revenue (Million) Forecast, by Application 2019 & 2032
- Table 44: Global Digital Manufacturing Market Revenue Million Forecast, by Country 2019 & 2032
- Table 45: United Arab Emirates Digital Manufacturing Market Revenue (Million) Forecast, by Application 2019 & 2032
- Table 46: Saudi Arabia Digital Manufacturing Market Revenue (Million) Forecast, by Application 2019 & 2032
- Table 47: South Africa Digital Manufacturing Market Revenue (Million) Forecast, by Application 2019 & 2032
- Table 48: Rest of Middle East and Africa Digital Manufacturing Market Revenue (Million) Forecast, by Application 2019 & 2032
- Table 49: Global Digital Manufacturing Market Revenue Million Forecast, by Technology 2019 & 2032
- Table 50: Global Digital Manufacturing Market Revenue Million Forecast, by Country 2019 & 2032
- Table 51: United States Digital Manufacturing Market Revenue (Million) Forecast, by Application 2019 & 2032
- Table 52: Canada Digital Manufacturing Market Revenue (Million) Forecast, by Application 2019 & 2032
- Table 53: Global Digital Manufacturing Market Revenue Million Forecast, by Technology 2019 & 2032
- Table 54: Global Digital Manufacturing Market Revenue Million Forecast, by Country 2019 & 2032
- Table 55: Germany Digital Manufacturing Market Revenue (Million) Forecast, by Application 2019 & 2032
- Table 56: United kingdom Digital Manufacturing Market Revenue (Million) Forecast, by Application 2019 & 2032
- Table 57: France Digital Manufacturing Market Revenue (Million) Forecast, by Application 2019 & 2032
- Table 58: Rest of Europe Digital Manufacturing Market Revenue (Million) Forecast, by Application 2019 & 2032
- Table 59: Global Digital Manufacturing Market Revenue Million Forecast, by Technology 2019 & 2032
- Table 60: Global Digital Manufacturing Market Revenue Million Forecast, by Country 2019 & 2032
- Table 61: China Digital Manufacturing Market Revenue (Million) Forecast, by Application 2019 & 2032
- Table 62: Japan Digital Manufacturing Market Revenue (Million) Forecast, by Application 2019 & 2032
- Table 63: India Digital Manufacturing Market Revenue (Million) Forecast, by Application 2019 & 2032
- Table 64: Rest of Asia Pacific Digital Manufacturing Market Revenue (Million) Forecast, by Application 2019 & 2032
- Table 65: Global Digital Manufacturing Market Revenue Million Forecast, by Technology 2019 & 2032
- Table 66: Global Digital Manufacturing Market Revenue Million Forecast, by Country 2019 & 2032
- Table 67: Global Digital Manufacturing Market Revenue Million Forecast, by Technology 2019 & 2032
- Table 68: Global Digital Manufacturing Market Revenue Million Forecast, by Country 2019 & 2032
Frequently Asked Questions
1. What is the projected Compound Annual Growth Rate (CAGR) of the Digital Manufacturing Market?
The projected CAGR is approximately 19.40%.
2. Which companies are prominent players in the Digital Manufacturing Market?
Key companies in the market include ABB Ltd, IBM Corporation, Mitsubishi Electric Corporation, Cisco Systems Inc, Siemens AG, Schneider Electric SE, Microsoft Corporation, Oracle Corporation, General Electric Company, SAP SE, Intel Corporation, Nortonlifelock Inc.
3. What are the main segments of the Digital Manufacturing Market?
The market segments include Technology.
4. Can you provide details about the market size?
The market size is estimated to be USD 367.60 Million as of 2022.
5. What are some drivers contributing to market growth?
Inclination of Manufacturers Toward Cost-efficient Processes; Proliferation of IoT.
6. What are the notable trends driving market growth?
Internet-of-Things (IoT) to Hold Major Market Share.
7. Are there any restraints impacting market growth?
Lack of Technical Expertise.
8. Can you provide examples of recent developments in the market?
May 2023: Siemens announced it would focus on 3D printing activities in the United States to hasten the industry's transformation via serial additive manufacturing. As stated by Siemens, the business is leveraging its products to help machine builders and is committed to assisting the domestic additive manufacturing maker community. The business will be a collaborative platform for machine makers, equipment users, and additive design professionals from its Charlotte Advanced Technology Collaboration Hub (CATCH) based in Charlotte, North Carolina.
9. What pricing options are available for accessing the report?
Pricing options include single-user, multi-user, and enterprise licenses priced at USD 4750, USD 5250, and USD 8750 respectively.
10. Is the market size provided in terms of value or volume?
The market size is provided in terms of value, measured in Million.
11. Are there any specific market keywords associated with the report?
Yes, the market keyword associated with the report is "Digital Manufacturing Market," which aids in identifying and referencing the specific market segment covered.
12. How do I determine which pricing option suits my needs best?
The pricing options vary based on user requirements and access needs. Individual users may opt for single-user licenses, while businesses requiring broader access may choose multi-user or enterprise licenses for cost-effective access to the report.
13. Are there any additional resources or data provided in the Digital Manufacturing Market report?
While the report offers comprehensive insights, it's advisable to review the specific contents or supplementary materials provided to ascertain if additional resources or data are available.
14. How can I stay updated on further developments or reports in the Digital Manufacturing Market?
To stay informed about further developments, trends, and reports in the Digital Manufacturing Market, consider subscribing to industry newsletters, following relevant companies and organizations, or regularly checking reputable industry news sources and publications.
Methodology
Step 1 - Identification of Relevant Samples Size from Population Database


Step 2 - Approaches for Defining Global Market Size (Value, Volume* & Price*)

Note*: In applicable scenarios
Step 3 - Data Sources
Primary Research
- Web Analytics
- Survey Reports
- Research Institute
- Latest Research Reports
- Opinion Leaders
Secondary Research
- Annual Reports
- White Paper
- Latest Press Release
- Industry Association
- Paid Database
- Investor Presentations

Step 4 - Data Triangulation
Involves using different sources of information in order to increase the validity of a study
These sources are likely to be stakeholders in a program - participants, other researchers, program staff, other community members, and so on.
Then we put all data in single framework & apply various statistical tools to find out the dynamic on the market.
During the analysis stage, feedback from the stakeholder groups would be compared to determine areas of agreement as well as areas of divergence


