
Key Insights
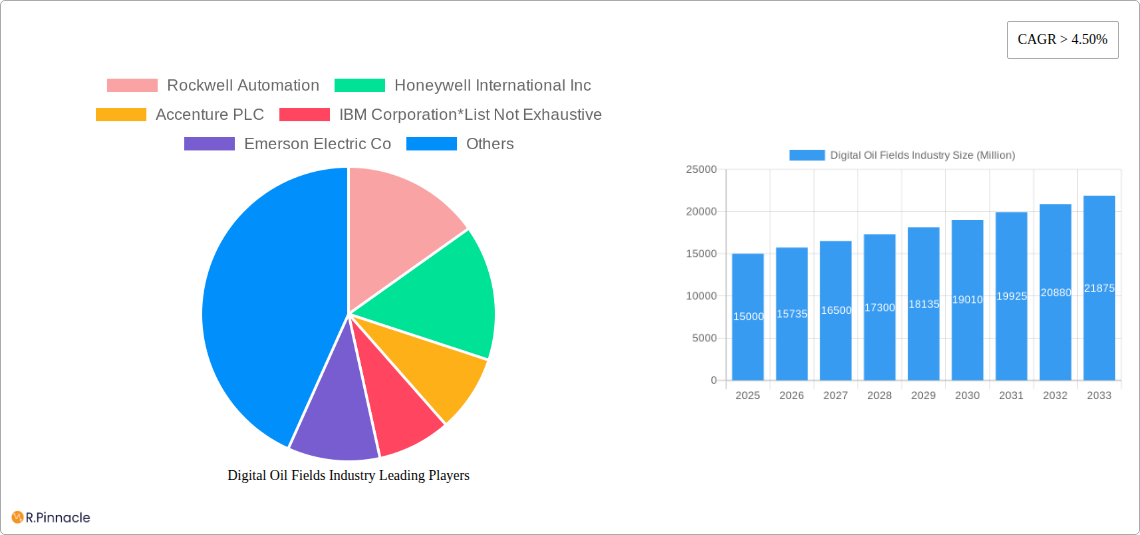
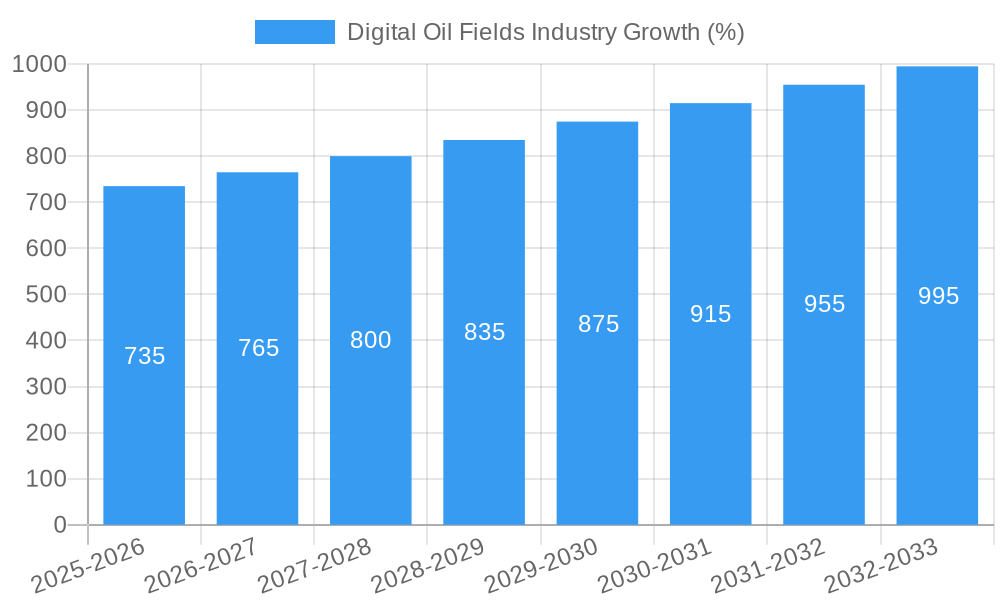
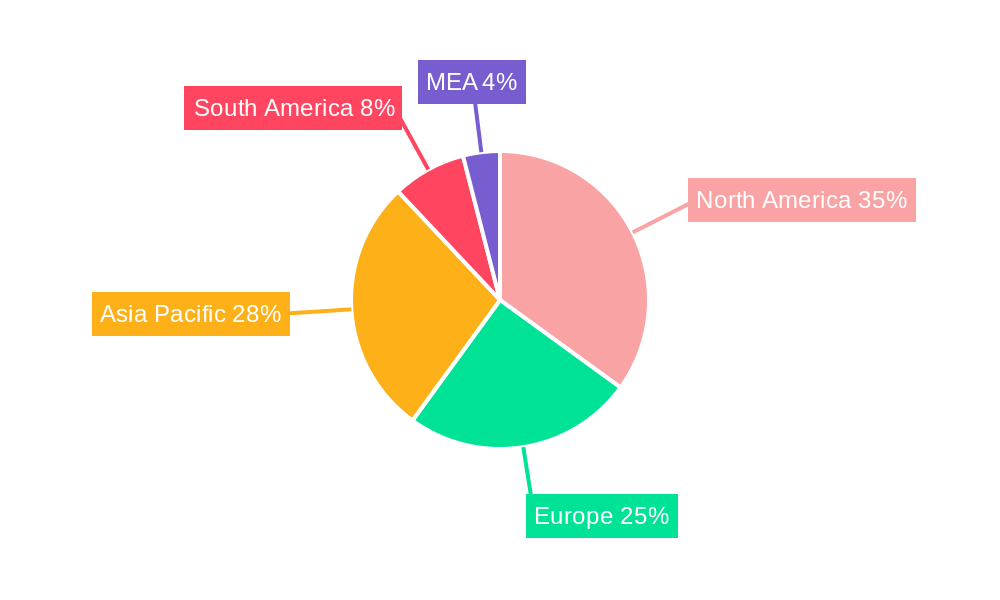
The Digital Oil Fields market is experiencing robust growth, driven by the increasing need for enhanced operational efficiency, reduced costs, and improved safety in the oil and gas industry. A compound annual growth rate (CAGR) exceeding 4.50% signifies a significant expansion, projected to reach a substantial market size over the forecast period (2025-2033). Key drivers include the rising adoption of advanced technologies such as IoT sensors, cloud computing, big data analytics, and artificial intelligence (AI) for real-time data monitoring and decision-making. These technologies facilitate reservoir optimization, production optimization, and drilling optimization, leading to improved hydrocarbon recovery rates, minimized downtime, and better resource allocation. Furthermore, the industry's focus on sustainability and environmental regulations is pushing the adoption of digital solutions for reducing emissions and optimizing energy consumption. The market is segmented by process type, with Reservoir Optimization, Production Optimization, and Drilling Optimization representing major segments. Leading companies such as Rockwell Automation, Honeywell, Accenture, IBM, Emerson Electric, and Schlumberger are actively investing in R&D and strategic partnerships to strengthen their market positions. Geographic expansion is also a significant factor, with North America, Europe, and the Asia-Pacific region showing strong growth potential, driven by the presence of significant oil and gas reserves and investments in digital infrastructure. However, high initial investment costs and the need for skilled workforce represent key restraints to broader market penetration.
The projected market growth is fueled by several converging factors. The continuous decline in the cost of sensors and data storage, coupled with advancements in data analytics capabilities, make digital oil field solutions increasingly accessible and cost-effective. Growing government support and initiatives promoting digitalization within the energy sector also contribute to market expansion. While the initial investment in deploying digital oil field technologies can be substantial, the long-term benefits in terms of cost savings, enhanced productivity, and improved safety outweigh the upfront investment, driving wider adoption. The competitive landscape is dynamic, with established players and emerging technology providers vying for market share through product innovation, strategic collaborations, and acquisitions. The increasing integration of digital technologies across various operational aspects of oil and gas exploration and production creates a synergistic effect, further propelling the market's growth trajectory. The future of the Digital Oil Fields market looks promising, characterized by continuous innovation and expansion into new applications and geographies.
Digital Oil Fields Industry Market Report: 2019-2033 Forecast
This comprehensive report provides a detailed analysis of the Digital Oil Fields industry, projecting robust growth from $XX Million in 2025 to $XX Million by 2033, exhibiting a CAGR of XX%. The study covers the period 2019-2033, with 2025 serving as the base and estimated year. This in-depth analysis is essential for industry professionals, investors, and strategic decision-makers seeking to navigate the evolving landscape of this dynamic sector.
Digital Oil Fields Industry Market Structure & Innovation Trends
This section analyzes the competitive landscape, highlighting market concentration, innovation drivers, and regulatory influences shaping the Digital Oil Fields industry. We examine M&A activities, including deal values (estimated at $XX Million in 2024), and analyze market share dynamics among key players. Leading companies like Rockwell Automation, Honeywell International Inc, Accenture PLC, IBM Corporation, Emerson Electric Co, Weatherford International PLC, Siemens Energy AG, Baker Hughes Company, Kongsberg Gruppen AS, Halliburton Company, Schlumberger Limited, and Pason Systems Inc. contribute to a complex, yet evolving market structure.
- Market Concentration: The market shows a [High/Medium/Low] level of concentration, with the top 5 players holding approximately XX% of the market share in 2024.
- Innovation Drivers: Key drivers include advancements in AI, IoT, cloud computing, and data analytics.
- Regulatory Frameworks: Government regulations on emissions and safety standards significantly impact technological adoption and investment strategies.
- Product Substitutes: The emergence of alternative energy sources presents a long-term challenge, although the immediate competitive landscape is driven by improvements within the digital oil field itself.
- End-User Demographics: Major end-users include both upstream and downstream companies, with significant variation in their technological adoption rates.
- M&A Activities: The past five years have witnessed significant consolidation, with M&A deal values exceeding $XX Million cumulatively.
Digital Oil Fields Industry Market Dynamics & Trends
This section delves into the market dynamics, examining growth drivers, technological disruptions, evolving consumer preferences (in terms of technological demands and sustainability concerns), and competitive pressures that shape industry trajectories.
The market exhibits strong growth potential, fueled by increasing demand for enhanced oil recovery techniques, improving operational efficiency, and the need for real-time data analysis for optimized decision-making. Technological disruptions, primarily driven by the integration of advanced analytics, AI, and cloud technologies, are reshaping operational models, and driving efficiency gains. Consumer preferences are shifting towards sustainable practices, influencing the adoption of environmentally friendly technologies. The competitive landscape is characterized by intense rivalry among established players and the emergence of innovative startups, driving pricing pressures and fostering technological advancement.
Dominant Regions & Segments in Digital Oil Fields Industry
This section identifies the leading geographical regions and market segments within the Digital Oil Fields industry. We analyze the factors driving dominance in each segment, including economic policies, infrastructure development, and technological adoption rates. The [Region Name] region currently dominates the global market, contributing XX% to the total revenue in 2024.
- Reservoir Optimization: Driven by the need to enhance oil and gas recovery rates from mature fields, this segment is expected to witness strong growth.
- Key Drivers: Government incentives for enhanced oil recovery, technological advancements in reservoir simulation and modeling.
- Production Optimization: Focuses on improving production efficiency and reducing operational costs. This segment benefits from automation and optimization techniques.
- Key Drivers: Falling equipment costs and increased reliability of smart sensors.
- Drilling Optimization: This segment leverages technology to enhance drilling efficiency and reduce non-productive time.
- Key Drivers: Advancements in drilling automation, real-time data analytics and improved drilling techniques.
- Other Process Types: This segment includes various other digitalization efforts in the oil and gas industry.
- Key Drivers: Increasing integration of digital technologies across the value chain, including supply chain optimization and workforce management.
Digital Oil Fields Industry Product Innovations
Recent product developments include advanced sensors, sophisticated software for data analytics, and AI-powered automation systems. These innovations enhance operational efficiency, improve decision-making, and reduce costs, significantly impacting market competitiveness. The successful integration of these new technologies depends largely on the level of investment and the ability to adapt to the rapidly changing technological landscape.
Report Scope & Segmentation Analysis
This report segments the Digital Oil Fields market by Type of Process: Reservoir Optimization, Production Optimization, Drilling Optimization, and Other Process Types. Each segment's growth projection, market size, and competitive dynamics are analyzed separately. The Reservoir Optimization segment is projected to hold the largest market share throughout the forecast period, driven by the growing demand for enhanced oil recovery. Production Optimization follows closely, benefiting from ongoing digital transformation efforts. Drilling Optimization shows steady growth, driven by technological advancements. The "Other Process Types" segment represents diverse applications and has moderate growth potential.
Key Drivers of Digital Oil Fields Industry Growth
Growth in the Digital Oil Fields industry is propelled by several factors: increasing demand for enhanced oil recovery techniques, the need for improved operational efficiency and cost reduction, rising adoption of digital technologies (IoT, AI, cloud computing), and supportive government policies promoting technological advancement. Additionally, stricter environmental regulations are driving investment in technologies that minimize environmental impact.
Challenges in the Digital Oil Fields Industry Sector
The industry faces challenges including high upfront investment costs for implementing digital technologies, cybersecurity risks associated with data management, the complexity of integrating various technologies across different systems, and potential skill gaps in the workforce. These factors contribute to a slower than anticipated uptake in several key regions.
Emerging Opportunities in Digital Oil Fields Industry
Opportunities abound in the integration of advanced analytics and AI for predictive maintenance, the development of more robust cybersecurity solutions, the expansion into new geographical markets with less developed digital infrastructure, and the exploration of new business models centered around data-driven services.
Leading Players in the Digital Oil Fields Industry Market
- Rockwell Automation
- Honeywell International Inc
- Accenture PLC
- IBM Corporation
- Emerson Electric Co
- Weatherford International PLC
- Siemens Energy AG
- Baker Hughes Company
- Kongsberg Gruppen AS
- Halliburton Company
- Schlumberger Limited
- Pason Systems Inc
Key Developments in Digital Oil Fields Industry Industry
- January 2023: Schlumberger launched a new AI-powered drilling optimization software.
- March 2022: Baker Hughes and Microsoft partnered to develop cloud-based solutions for the oil and gas industry.
- June 2021: A major merger between two significant players resulted in a combined market share of XX%. (Further details in the full report).
Future Outlook for Digital Oil Fields Industry Market
The Digital Oil Fields industry is poised for sustained growth, driven by ongoing technological advancements, increasing demand for enhanced oil recovery techniques, and the growing focus on operational efficiency and cost reduction. Strategic partnerships, investments in R&D, and the development of innovative solutions will further propel market expansion and create new opportunities for businesses across the value chain.
Digital Oil Fields Industry Segmentation
-
1. Type of Process
- 1.1. Reservoir Optimization
- 1.2. Production Optimization
- 1.3. Drilling Optimization
- 1.4. Other Process Types
Digital Oil Fields Industry Segmentation By Geography
- 1. North America
- 2. Europe
- 3. Asia Pacific
- 4. South America
- 5. Middle East and Africa
Digital Oil Fields Industry REPORT HIGHLIGHTS
| Aspects | Details |
|---|---|
| Study Period | 2019-2033 |
| Base Year | 2024 |
| Estimated Year | 2025 |
| Forecast Period | 2025-2033 |
| Historical Period | 2019-2024 |
| Growth Rate | CAGR of > 4.50% from 2019-2033 |
| Segmentation |
|
Table of Contents
- 1. Introduction
- 1.1. Research Scope
- 1.2. Market Segmentation
- 1.3. Research Methodology
- 1.4. Definitions and Assumptions
- 2. Executive Summary
- 2.1. Introduction
- 3. Market Dynamics
- 3.1. Introduction
- 3.2. Market Drivers
- 3.2.1. 4.; Growing demand for natural gas and developing gas infrastructure4.; Increasing offshore oil and Gas Exploration Activities
- 3.3. Market Restrains
- 3.3.1. 4.; Adoption of Cleaner Alternatives
- 3.4. Market Trends
- 3.4.1. Reservoir Optimization Segment to Dominate the Market
- 4. Market Factor Analysis
- 4.1. Porters Five Forces
- 4.2. Supply/Value Chain
- 4.3. PESTEL analysis
- 4.4. Market Entropy
- 4.5. Patent/Trademark Analysis
- 5. Global Digital Oil Fields Industry Analysis, Insights and Forecast, 2019-2031
- 5.1. Market Analysis, Insights and Forecast - by Type of Process
- 5.1.1. Reservoir Optimization
- 5.1.2. Production Optimization
- 5.1.3. Drilling Optimization
- 5.1.4. Other Process Types
- 5.2. Market Analysis, Insights and Forecast - by Region
- 5.2.1. North America
- 5.2.2. Europe
- 5.2.3. Asia Pacific
- 5.2.4. South America
- 5.2.5. Middle East and Africa
- 5.1. Market Analysis, Insights and Forecast - by Type of Process
- 6. North America Digital Oil Fields Industry Analysis, Insights and Forecast, 2019-2031
- 6.1. Market Analysis, Insights and Forecast - by Type of Process
- 6.1.1. Reservoir Optimization
- 6.1.2. Production Optimization
- 6.1.3. Drilling Optimization
- 6.1.4. Other Process Types
- 6.1. Market Analysis, Insights and Forecast - by Type of Process
- 7. Europe Digital Oil Fields Industry Analysis, Insights and Forecast, 2019-2031
- 7.1. Market Analysis, Insights and Forecast - by Type of Process
- 7.1.1. Reservoir Optimization
- 7.1.2. Production Optimization
- 7.1.3. Drilling Optimization
- 7.1.4. Other Process Types
- 7.1. Market Analysis, Insights and Forecast - by Type of Process
- 8. Asia Pacific Digital Oil Fields Industry Analysis, Insights and Forecast, 2019-2031
- 8.1. Market Analysis, Insights and Forecast - by Type of Process
- 8.1.1. Reservoir Optimization
- 8.1.2. Production Optimization
- 8.1.3. Drilling Optimization
- 8.1.4. Other Process Types
- 8.1. Market Analysis, Insights and Forecast - by Type of Process
- 9. South America Digital Oil Fields Industry Analysis, Insights and Forecast, 2019-2031
- 9.1. Market Analysis, Insights and Forecast - by Type of Process
- 9.1.1. Reservoir Optimization
- 9.1.2. Production Optimization
- 9.1.3. Drilling Optimization
- 9.1.4. Other Process Types
- 9.1. Market Analysis, Insights and Forecast - by Type of Process
- 10. Middle East and Africa Digital Oil Fields Industry Analysis, Insights and Forecast, 2019-2031
- 10.1. Market Analysis, Insights and Forecast - by Type of Process
- 10.1.1. Reservoir Optimization
- 10.1.2. Production Optimization
- 10.1.3. Drilling Optimization
- 10.1.4. Other Process Types
- 10.1. Market Analysis, Insights and Forecast - by Type of Process
- 11. North America Digital Oil Fields Industry Analysis, Insights and Forecast, 2019-2031
- 11.1. Market Analysis, Insights and Forecast - By Country/Sub-region
- 11.1.1 United States
- 11.1.2 Canada
- 11.1.3 Mexico
- 12. Europe Digital Oil Fields Industry Analysis, Insights and Forecast, 2019-2031
- 12.1. Market Analysis, Insights and Forecast - By Country/Sub-region
- 12.1.1 Germany
- 12.1.2 United Kingdom
- 12.1.3 France
- 12.1.4 Spain
- 12.1.5 Italy
- 12.1.6 Spain
- 12.1.7 Belgium
- 12.1.8 Netherland
- 12.1.9 Nordics
- 12.1.10 Rest of Europe
- 13. Asia Pacific Digital Oil Fields Industry Analysis, Insights and Forecast, 2019-2031
- 13.1. Market Analysis, Insights and Forecast - By Country/Sub-region
- 13.1.1 China
- 13.1.2 Japan
- 13.1.3 India
- 13.1.4 South Korea
- 13.1.5 Southeast Asia
- 13.1.6 Australia
- 13.1.7 Indonesia
- 13.1.8 Phillipes
- 13.1.9 Singapore
- 13.1.10 Thailandc
- 13.1.11 Rest of Asia Pacific
- 14. South America Digital Oil Fields Industry Analysis, Insights and Forecast, 2019-2031
- 14.1. Market Analysis, Insights and Forecast - By Country/Sub-region
- 14.1.1 Brazil
- 14.1.2 Argentina
- 14.1.3 Peru
- 14.1.4 Chile
- 14.1.5 Colombia
- 14.1.6 Ecuador
- 14.1.7 Venezuela
- 14.1.8 Rest of South America
- 15. North America Digital Oil Fields Industry Analysis, Insights and Forecast, 2019-2031
- 15.1. Market Analysis, Insights and Forecast - By Country/Sub-region
- 15.1.1 United States
- 15.1.2 Canada
- 15.1.3 Mexico
- 16. MEA Digital Oil Fields Industry Analysis, Insights and Forecast, 2019-2031
- 16.1. Market Analysis, Insights and Forecast - By Country/Sub-region
- 16.1.1 United Arab Emirates
- 16.1.2 Saudi Arabia
- 16.1.3 South Africa
- 16.1.4 Rest of Middle East and Africa
- 17. Competitive Analysis
- 17.1. Global Market Share Analysis 2024
- 17.2. Company Profiles
- 17.2.1 Rockwell Automation
- 17.2.1.1. Overview
- 17.2.1.2. Products
- 17.2.1.3. SWOT Analysis
- 17.2.1.4. Recent Developments
- 17.2.1.5. Financials (Based on Availability)
- 17.2.2 Honeywell International Inc
- 17.2.2.1. Overview
- 17.2.2.2. Products
- 17.2.2.3. SWOT Analysis
- 17.2.2.4. Recent Developments
- 17.2.2.5. Financials (Based on Availability)
- 17.2.3 Accenture PLC
- 17.2.3.1. Overview
- 17.2.3.2. Products
- 17.2.3.3. SWOT Analysis
- 17.2.3.4. Recent Developments
- 17.2.3.5. Financials (Based on Availability)
- 17.2.4 IBM Corporation*List Not Exhaustive
- 17.2.4.1. Overview
- 17.2.4.2. Products
- 17.2.4.3. SWOT Analysis
- 17.2.4.4. Recent Developments
- 17.2.4.5. Financials (Based on Availability)
- 17.2.5 Emerson Electric Co
- 17.2.5.1. Overview
- 17.2.5.2. Products
- 17.2.5.3. SWOT Analysis
- 17.2.5.4. Recent Developments
- 17.2.5.5. Financials (Based on Availability)
- 17.2.6 Weatherford International PLC
- 17.2.6.1. Overview
- 17.2.6.2. Products
- 17.2.6.3. SWOT Analysis
- 17.2.6.4. Recent Developments
- 17.2.6.5. Financials (Based on Availability)
- 17.2.7 Siemens Energy AG
- 17.2.7.1. Overview
- 17.2.7.2. Products
- 17.2.7.3. SWOT Analysis
- 17.2.7.4. Recent Developments
- 17.2.7.5. Financials (Based on Availability)
- 17.2.8 Baker Hughes Company
- 17.2.8.1. Overview
- 17.2.8.2. Products
- 17.2.8.3. SWOT Analysis
- 17.2.8.4. Recent Developments
- 17.2.8.5. Financials (Based on Availability)
- 17.2.9 Kongsberg Gruppen AS
- 17.2.9.1. Overview
- 17.2.9.2. Products
- 17.2.9.3. SWOT Analysis
- 17.2.9.4. Recent Developments
- 17.2.9.5. Financials (Based on Availability)
- 17.2.10 Halliburton Company
- 17.2.10.1. Overview
- 17.2.10.2. Products
- 17.2.10.3. SWOT Analysis
- 17.2.10.4. Recent Developments
- 17.2.10.5. Financials (Based on Availability)
- 17.2.11 Schlumberger Limited
- 17.2.11.1. Overview
- 17.2.11.2. Products
- 17.2.11.3. SWOT Analysis
- 17.2.11.4. Recent Developments
- 17.2.11.5. Financials (Based on Availability)
- 17.2.12 Pason Systems Inc
- 17.2.12.1. Overview
- 17.2.12.2. Products
- 17.2.12.3. SWOT Analysis
- 17.2.12.4. Recent Developments
- 17.2.12.5. Financials (Based on Availability)
- 17.2.1 Rockwell Automation
List of Figures
- Figure 1: Global Digital Oil Fields Industry Revenue Breakdown (Million, %) by Region 2024 & 2032
- Figure 2: North America Digital Oil Fields Industry Revenue (Million), by Country 2024 & 2032
- Figure 3: North America Digital Oil Fields Industry Revenue Share (%), by Country 2024 & 2032
- Figure 4: Europe Digital Oil Fields Industry Revenue (Million), by Country 2024 & 2032
- Figure 5: Europe Digital Oil Fields Industry Revenue Share (%), by Country 2024 & 2032
- Figure 6: Asia Pacific Digital Oil Fields Industry Revenue (Million), by Country 2024 & 2032
- Figure 7: Asia Pacific Digital Oil Fields Industry Revenue Share (%), by Country 2024 & 2032
- Figure 8: South America Digital Oil Fields Industry Revenue (Million), by Country 2024 & 2032
- Figure 9: South America Digital Oil Fields Industry Revenue Share (%), by Country 2024 & 2032
- Figure 10: North America Digital Oil Fields Industry Revenue (Million), by Country 2024 & 2032
- Figure 11: North America Digital Oil Fields Industry Revenue Share (%), by Country 2024 & 2032
- Figure 12: MEA Digital Oil Fields Industry Revenue (Million), by Country 2024 & 2032
- Figure 13: MEA Digital Oil Fields Industry Revenue Share (%), by Country 2024 & 2032
- Figure 14: North America Digital Oil Fields Industry Revenue (Million), by Type of Process 2024 & 2032
- Figure 15: North America Digital Oil Fields Industry Revenue Share (%), by Type of Process 2024 & 2032
- Figure 16: North America Digital Oil Fields Industry Revenue (Million), by Country 2024 & 2032
- Figure 17: North America Digital Oil Fields Industry Revenue Share (%), by Country 2024 & 2032
- Figure 18: Europe Digital Oil Fields Industry Revenue (Million), by Type of Process 2024 & 2032
- Figure 19: Europe Digital Oil Fields Industry Revenue Share (%), by Type of Process 2024 & 2032
- Figure 20: Europe Digital Oil Fields Industry Revenue (Million), by Country 2024 & 2032
- Figure 21: Europe Digital Oil Fields Industry Revenue Share (%), by Country 2024 & 2032
- Figure 22: Asia Pacific Digital Oil Fields Industry Revenue (Million), by Type of Process 2024 & 2032
- Figure 23: Asia Pacific Digital Oil Fields Industry Revenue Share (%), by Type of Process 2024 & 2032
- Figure 24: Asia Pacific Digital Oil Fields Industry Revenue (Million), by Country 2024 & 2032
- Figure 25: Asia Pacific Digital Oil Fields Industry Revenue Share (%), by Country 2024 & 2032
- Figure 26: South America Digital Oil Fields Industry Revenue (Million), by Type of Process 2024 & 2032
- Figure 27: South America Digital Oil Fields Industry Revenue Share (%), by Type of Process 2024 & 2032
- Figure 28: South America Digital Oil Fields Industry Revenue (Million), by Country 2024 & 2032
- Figure 29: South America Digital Oil Fields Industry Revenue Share (%), by Country 2024 & 2032
- Figure 30: Middle East and Africa Digital Oil Fields Industry Revenue (Million), by Type of Process 2024 & 2032
- Figure 31: Middle East and Africa Digital Oil Fields Industry Revenue Share (%), by Type of Process 2024 & 2032
- Figure 32: Middle East and Africa Digital Oil Fields Industry Revenue (Million), by Country 2024 & 2032
- Figure 33: Middle East and Africa Digital Oil Fields Industry Revenue Share (%), by Country 2024 & 2032
List of Tables
- Table 1: Global Digital Oil Fields Industry Revenue Million Forecast, by Region 2019 & 2032
- Table 2: Global Digital Oil Fields Industry Revenue Million Forecast, by Type of Process 2019 & 2032
- Table 3: Global Digital Oil Fields Industry Revenue Million Forecast, by Region 2019 & 2032
- Table 4: Global Digital Oil Fields Industry Revenue Million Forecast, by Country 2019 & 2032
- Table 5: United States Digital Oil Fields Industry Revenue (Million) Forecast, by Application 2019 & 2032
- Table 6: Canada Digital Oil Fields Industry Revenue (Million) Forecast, by Application 2019 & 2032
- Table 7: Mexico Digital Oil Fields Industry Revenue (Million) Forecast, by Application 2019 & 2032
- Table 8: Global Digital Oil Fields Industry Revenue Million Forecast, by Country 2019 & 2032
- Table 9: Germany Digital Oil Fields Industry Revenue (Million) Forecast, by Application 2019 & 2032
- Table 10: United Kingdom Digital Oil Fields Industry Revenue (Million) Forecast, by Application 2019 & 2032
- Table 11: France Digital Oil Fields Industry Revenue (Million) Forecast, by Application 2019 & 2032
- Table 12: Spain Digital Oil Fields Industry Revenue (Million) Forecast, by Application 2019 & 2032
- Table 13: Italy Digital Oil Fields Industry Revenue (Million) Forecast, by Application 2019 & 2032
- Table 14: Spain Digital Oil Fields Industry Revenue (Million) Forecast, by Application 2019 & 2032
- Table 15: Belgium Digital Oil Fields Industry Revenue (Million) Forecast, by Application 2019 & 2032
- Table 16: Netherland Digital Oil Fields Industry Revenue (Million) Forecast, by Application 2019 & 2032
- Table 17: Nordics Digital Oil Fields Industry Revenue (Million) Forecast, by Application 2019 & 2032
- Table 18: Rest of Europe Digital Oil Fields Industry Revenue (Million) Forecast, by Application 2019 & 2032
- Table 19: Global Digital Oil Fields Industry Revenue Million Forecast, by Country 2019 & 2032
- Table 20: China Digital Oil Fields Industry Revenue (Million) Forecast, by Application 2019 & 2032
- Table 21: Japan Digital Oil Fields Industry Revenue (Million) Forecast, by Application 2019 & 2032
- Table 22: India Digital Oil Fields Industry Revenue (Million) Forecast, by Application 2019 & 2032
- Table 23: South Korea Digital Oil Fields Industry Revenue (Million) Forecast, by Application 2019 & 2032
- Table 24: Southeast Asia Digital Oil Fields Industry Revenue (Million) Forecast, by Application 2019 & 2032
- Table 25: Australia Digital Oil Fields Industry Revenue (Million) Forecast, by Application 2019 & 2032
- Table 26: Indonesia Digital Oil Fields Industry Revenue (Million) Forecast, by Application 2019 & 2032
- Table 27: Phillipes Digital Oil Fields Industry Revenue (Million) Forecast, by Application 2019 & 2032
- Table 28: Singapore Digital Oil Fields Industry Revenue (Million) Forecast, by Application 2019 & 2032
- Table 29: Thailandc Digital Oil Fields Industry Revenue (Million) Forecast, by Application 2019 & 2032
- Table 30: Rest of Asia Pacific Digital Oil Fields Industry Revenue (Million) Forecast, by Application 2019 & 2032
- Table 31: Global Digital Oil Fields Industry Revenue Million Forecast, by Country 2019 & 2032
- Table 32: Brazil Digital Oil Fields Industry Revenue (Million) Forecast, by Application 2019 & 2032
- Table 33: Argentina Digital Oil Fields Industry Revenue (Million) Forecast, by Application 2019 & 2032
- Table 34: Peru Digital Oil Fields Industry Revenue (Million) Forecast, by Application 2019 & 2032
- Table 35: Chile Digital Oil Fields Industry Revenue (Million) Forecast, by Application 2019 & 2032
- Table 36: Colombia Digital Oil Fields Industry Revenue (Million) Forecast, by Application 2019 & 2032
- Table 37: Ecuador Digital Oil Fields Industry Revenue (Million) Forecast, by Application 2019 & 2032
- Table 38: Venezuela Digital Oil Fields Industry Revenue (Million) Forecast, by Application 2019 & 2032
- Table 39: Rest of South America Digital Oil Fields Industry Revenue (Million) Forecast, by Application 2019 & 2032
- Table 40: Global Digital Oil Fields Industry Revenue Million Forecast, by Country 2019 & 2032
- Table 41: United States Digital Oil Fields Industry Revenue (Million) Forecast, by Application 2019 & 2032
- Table 42: Canada Digital Oil Fields Industry Revenue (Million) Forecast, by Application 2019 & 2032
- Table 43: Mexico Digital Oil Fields Industry Revenue (Million) Forecast, by Application 2019 & 2032
- Table 44: Global Digital Oil Fields Industry Revenue Million Forecast, by Country 2019 & 2032
- Table 45: United Arab Emirates Digital Oil Fields Industry Revenue (Million) Forecast, by Application 2019 & 2032
- Table 46: Saudi Arabia Digital Oil Fields Industry Revenue (Million) Forecast, by Application 2019 & 2032
- Table 47: South Africa Digital Oil Fields Industry Revenue (Million) Forecast, by Application 2019 & 2032
- Table 48: Rest of Middle East and Africa Digital Oil Fields Industry Revenue (Million) Forecast, by Application 2019 & 2032
- Table 49: Global Digital Oil Fields Industry Revenue Million Forecast, by Type of Process 2019 & 2032
- Table 50: Global Digital Oil Fields Industry Revenue Million Forecast, by Country 2019 & 2032
- Table 51: Global Digital Oil Fields Industry Revenue Million Forecast, by Type of Process 2019 & 2032
- Table 52: Global Digital Oil Fields Industry Revenue Million Forecast, by Country 2019 & 2032
- Table 53: Global Digital Oil Fields Industry Revenue Million Forecast, by Type of Process 2019 & 2032
- Table 54: Global Digital Oil Fields Industry Revenue Million Forecast, by Country 2019 & 2032
- Table 55: Global Digital Oil Fields Industry Revenue Million Forecast, by Type of Process 2019 & 2032
- Table 56: Global Digital Oil Fields Industry Revenue Million Forecast, by Country 2019 & 2032
- Table 57: Global Digital Oil Fields Industry Revenue Million Forecast, by Type of Process 2019 & 2032
- Table 58: Global Digital Oil Fields Industry Revenue Million Forecast, by Country 2019 & 2032
Frequently Asked Questions
1. What is the projected Compound Annual Growth Rate (CAGR) of the Digital Oil Fields Industry?
The projected CAGR is approximately > 4.50%.
2. Which companies are prominent players in the Digital Oil Fields Industry?
Key companies in the market include Rockwell Automation, Honeywell International Inc, Accenture PLC, IBM Corporation*List Not Exhaustive, Emerson Electric Co, Weatherford International PLC, Siemens Energy AG, Baker Hughes Company, Kongsberg Gruppen AS, Halliburton Company, Schlumberger Limited, Pason Systems Inc.
3. What are the main segments of the Digital Oil Fields Industry?
The market segments include Type of Process.
4. Can you provide details about the market size?
The market size is estimated to be USD XX Million as of 2022.
5. What are some drivers contributing to market growth?
4.; Growing demand for natural gas and developing gas infrastructure4.; Increasing offshore oil and Gas Exploration Activities.
6. What are the notable trends driving market growth?
Reservoir Optimization Segment to Dominate the Market.
7. Are there any restraints impacting market growth?
4.; Adoption of Cleaner Alternatives.
8. Can you provide examples of recent developments in the market?
N/A
9. What pricing options are available for accessing the report?
Pricing options include single-user, multi-user, and enterprise licenses priced at USD 4750, USD 5250, and USD 8750 respectively.
10. Is the market size provided in terms of value or volume?
The market size is provided in terms of value, measured in Million.
11. Are there any specific market keywords associated with the report?
Yes, the market keyword associated with the report is "Digital Oil Fields Industry," which aids in identifying and referencing the specific market segment covered.
12. How do I determine which pricing option suits my needs best?
The pricing options vary based on user requirements and access needs. Individual users may opt for single-user licenses, while businesses requiring broader access may choose multi-user or enterprise licenses for cost-effective access to the report.
13. Are there any additional resources or data provided in the Digital Oil Fields Industry report?
While the report offers comprehensive insights, it's advisable to review the specific contents or supplementary materials provided to ascertain if additional resources or data are available.
14. How can I stay updated on further developments or reports in the Digital Oil Fields Industry?
To stay informed about further developments, trends, and reports in the Digital Oil Fields Industry, consider subscribing to industry newsletters, following relevant companies and organizations, or regularly checking reputable industry news sources and publications.
Methodology
Step 1 - Identification of Relevant Samples Size from Population Database


Step 2 - Approaches for Defining Global Market Size (Value, Volume* & Price*)

Note*: In applicable scenarios
Step 3 - Data Sources
Primary Research
- Web Analytics
- Survey Reports
- Research Institute
- Latest Research Reports
- Opinion Leaders
Secondary Research
- Annual Reports
- White Paper
- Latest Press Release
- Industry Association
- Paid Database
- Investor Presentations

Step 4 - Data Triangulation
Involves using different sources of information in order to increase the validity of a study
These sources are likely to be stakeholders in a program - participants, other researchers, program staff, other community members, and so on.
Then we put all data in single framework & apply various statistical tools to find out the dynamic on the market.
During the analysis stage, feedback from the stakeholder groups would be compared to determine areas of agreement as well as areas of divergence


