
Key Insights
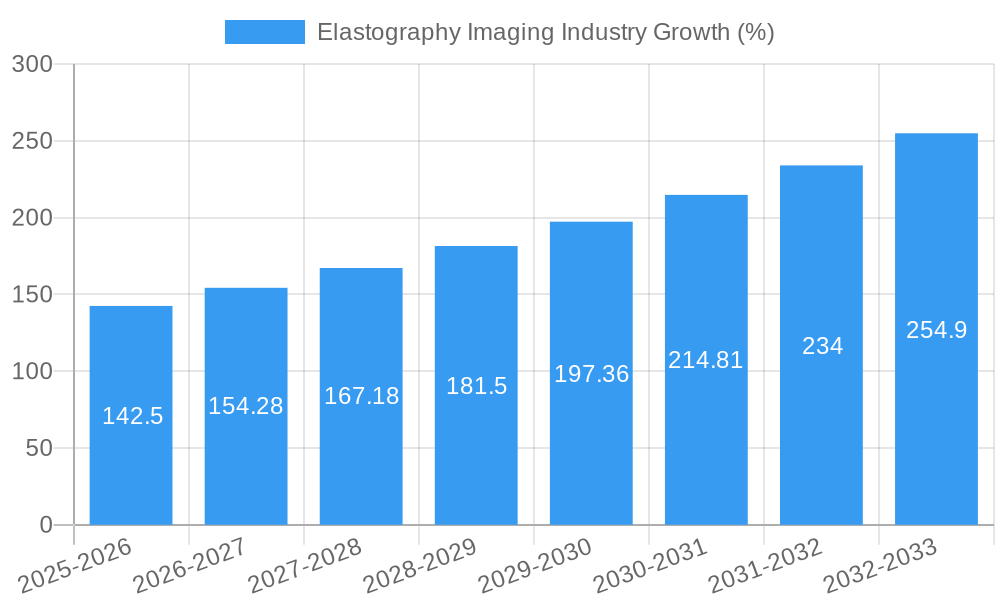
The elastography imaging market is experiencing robust growth, driven by the increasing prevalence of chronic diseases requiring accurate diagnosis and monitoring, advancements in imaging technology offering improved image quality and diagnostic capabilities, and the rising adoption of minimally invasive procedures. The market's 9.50% CAGR suggests a significant expansion from 2019 to 2033. Ultrasound elastography currently dominates the modality segment due to its cost-effectiveness and widespread availability. However, magnetic resonance elastography (MRE) is witnessing substantial growth, fueled by its superior tissue characterization capabilities, particularly in applications like liver fibrosis assessment and oncology. The cardiology and radiology applications currently hold the largest market share, driven by the high prevalence of cardiovascular and oncological diseases. However, growing demand for early detection and minimally invasive procedures is fueling growth in other application segments, including urology, vascular, and musculoskeletal applications. Hospitals and ambulatory surgical centers are the primary end-users, though the increasing popularity of diagnostic centers is contributing to market expansion. Geographically, North America and Europe currently hold significant market shares, but the Asia-Pacific region is poised for rapid growth due to increasing healthcare spending and rising awareness of advanced imaging techniques. The competitive landscape is characterized by the presence of established players like GE Healthcare, Philips, and Siemens, alongside emerging companies introducing innovative technologies and expanding their market presence. The market faces challenges such as the relatively high cost of some elastography systems and the need for skilled personnel for accurate interpretation of images, however this is offset by the significant advantages of the technology.
The forecast period (2025-2033) presents significant opportunities for market expansion as technological advancements continue to enhance the diagnostic capabilities and affordability of elastography. The integration of artificial intelligence (AI) and machine learning (ML) algorithms is expected to improve image analysis and interpretation, further driving market growth. Expansion into emerging markets and the development of new applications in areas like oncology and musculoskeletal imaging will also contribute to the overall market expansion. Strategic collaborations, acquisitions, and the introduction of innovative products are expected to be key growth drivers for existing and new market entrants. A focus on improved accessibility and affordability of elastography systems is crucial for ensuring wider adoption and maximizing market potential, particularly in developing economies.
Elastography Imaging Industry Report: 2019-2033
This comprehensive report provides an in-depth analysis of the Elastography Imaging market, projecting robust growth from 2025 to 2033. The study covers market segmentation, competitive landscape, technological advancements, and future opportunities within this rapidly evolving sector. Discover key insights for strategic decision-making and navigate the complexities of this dynamic market.
Elastography Imaging Industry Market Structure & Innovation Trends
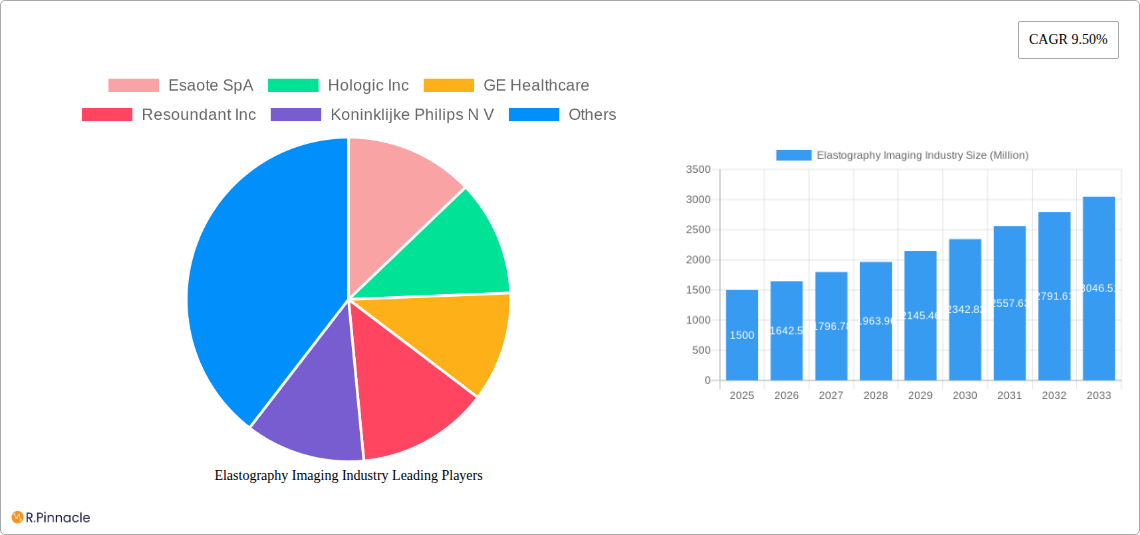
The Elastography Imaging market exhibits a moderately consolidated structure, with key players such as Esaote SpA, Hologic Inc, GE Healthcare, Resonant Inc, Koninklijke Philips N.V., Mindray Medical International Limited, Siemens AG, Canon Medical Systems Corporation, Samsung Medison, Supersonic Imagine, and Fujifilm Holdings Corporation holding significant market share. Precise market share figures are unavailable but estimates suggest the top 5 companies control approximately xx% of the market as of 2024. The market is characterized by continuous innovation driven by advancements in ultrasound and MRI technologies, improved image processing algorithms, and the expanding applications of elastography across various medical specialties. Regulatory frameworks, primarily from bodies like the FDA and equivalent international organizations, play a significant role in shaping product development and market access. While there are no direct substitutes for elastography, alternative imaging modalities such as CT and PET scans compete indirectly for budget allocation. The end-user demographic is primarily hospitals and specialized medical centers, with a growing adoption rate in ambulatory surgical centers. The past five years have witnessed several M&A activities, though specific deal values remain undisclosed due to the proprietary nature of this information. The total M&A value is estimated at approximately $xx Million over this period.
- Market Concentration: Moderately Consolidated
- Innovation Drivers: Technological advancements in ultrasound and MRI, improved image processing.
- Regulatory Frameworks: FDA, international equivalents.
- M&A Activities: Several deals, with total value estimated at $xx Million (2019-2024).
Elastography Imaging Industry Market Dynamics & Trends
The Elastography Imaging market is experiencing significant growth, driven by the increasing prevalence of chronic diseases requiring accurate and non-invasive diagnostic tools. Technological advancements such as real-time tissue elastography (RTE) and shear wave elastography (SWE) are enhancing the accuracy and efficiency of diagnosis, leading to increased market penetration. The market's compound annual growth rate (CAGR) from 2025 to 2033 is projected to be xx%, fueled by rising demand, improved technology, and expansion into new applications. Consumer preferences are shifting towards minimally invasive procedures and advanced imaging techniques, further stimulating market growth. The competitive landscape is characterized by intense rivalry among established players and emerging companies. This competition fosters innovation, driving down costs and improving the quality of elastography systems. Market penetration in emerging economies is expected to increase significantly in the coming years, contributing to the overall growth of the market.
Dominant Regions & Segments in Elastography Imaging Industry
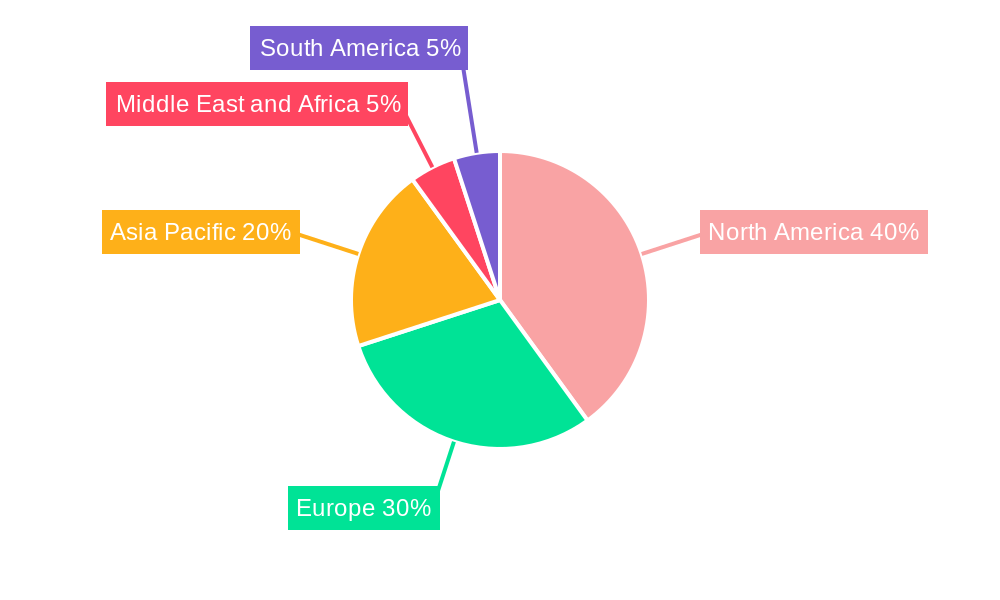
The North American market currently holds the largest share of the global elastography imaging market, driven by factors such as advanced healthcare infrastructure, high adoption rates of advanced imaging technologies, and significant investments in research and development. This region is followed by Europe, with countries like Germany and the UK showing substantial market growth. Asia Pacific is expected to experience the fastest growth rate due to increasing healthcare spending, rising prevalence of chronic diseases, and growing awareness of advanced diagnostic techniques. Within the modalities, Ultrasound Elastography dominates the market due to its affordability, accessibility and ease of use.
- Leading Regions: North America, Europe, Asia Pacific
- Key Drivers:
- North America: Advanced healthcare infrastructure, high adoption rates, significant R&D investment.
- Europe: Strong healthcare systems, early adoption of new technologies.
- Asia Pacific: Rising healthcare spending, prevalence of chronic diseases, growing awareness of advanced diagnostics.
- Dominant Segments:
- Modality: Ultrasound Elastography
- Application: Radiology, Cardiology
- End-User: Hospitals
Detailed Dominance Analysis: The dominance of Ultrasound Elastography is primarily due to its cost-effectiveness compared to Magnetic Resonance Elastography (MRE), as well as its broader availability and ease of use. Within applications, Radiology and Cardiology hold the largest segments due to high prevalence of related conditions and suitability of elastography for their diagnosis. Hospitals constitute the largest end-user segment owing to their established infrastructure and access to trained personnel.
Elastography Imaging Industry Product Innovations
Recent product innovations have focused on improving image quality, expanding applications, and enhancing ease of use. New systems incorporate advanced algorithms for real-time tissue characterization, offering improved diagnostic accuracy and efficiency. The integration of artificial intelligence (AI) and machine learning (ML) is further enhancing the capabilities of elastography systems, enabling automated image analysis and improved diagnostic support. These advancements are crucial in expanding the applicability of elastography across various clinical settings and specialties.
Report Scope & Segmentation Analysis
This report analyzes the Elastography Imaging market across various segments:
Modality: Ultrasound Elastography and Magnetic Resonance Elastography. Ultrasound Elastography is projected to maintain its dominance with a xx% market share in 2033 due to its cost-effectiveness. Magnetic Resonance Elastography, while having a smaller share (xx%), is anticipated to exhibit strong growth owing to its superior image quality in certain applications.
Application: Cardiology, Radiology, Urology, Vascular, Obstetrics/Gynecology, and Other Applications (Orthopedic, Musculoskeletal, Rheumatology, Physical Medicine and Rehabilitation). Radiology and cardiology represent significant segments, with projections indicating a CAGR of xx% and xx% respectively, until 2033.
End-User: Hospitals, Ambulatory Surgical Centers, and Surgical & Diagnostic centers. Hospitals account for the largest segment, expected to grow at a CAGR of xx% during the forecast period due to their high diagnostic volumes.
Key Drivers of Elastography Imaging Industry Growth
The Elastography Imaging market is driven by technological advancements such as higher resolution imaging, real-time capabilities, and improved software; rising prevalence of chronic diseases necessitating accurate diagnostic tools; increased healthcare spending globally; growing adoption of minimally invasive procedures; and supportive regulatory frameworks promoting the adoption of advanced imaging techniques.
Challenges in the Elastography Imaging Industry Sector
Challenges include high initial investment costs for equipment, the need for skilled operators, reimbursement challenges in some healthcare systems, and the competition from other imaging modalities. These factors, coupled with ongoing research into alternative diagnostic methods, impact the rate of market penetration and pose challenges to sustained growth. The total estimated impact of these challenges on market growth is currently estimated to be a reduction of xx% in the overall CAGR.
Emerging Opportunities in Elastography Imaging Industry
Emerging opportunities lie in the expanding applications of elastography into new therapeutic areas (e.g., oncology, neurology), the development of AI-powered diagnostic tools, the integration of elastography with other imaging modalities, and the growth of the market in emerging economies with rising healthcare expenditures. Furthermore, there are opportunities in point-of-care elastography devices designed for increased accessibility.
Leading Players in the Elastography Imaging Industry Market
- Esaote SpA
- Hologic Inc
- GE Healthcare
- Resonant Inc
- Koninklijke Philips N.V.
- Mindray Medical International Limited
- Siemens AG
- Canon Medical Systems Corporation
- Samsung Medison
- Supersonic Imagine
- Fujifilm Holdings Corporation
Key Developments in Elastography Imaging Industry Industry
March 2022: Fujifilm Healthcare Europe introduced the Arietta ultrasound series (Arietta 850 DeepInsight and Arietta 650 DeepInsight), supporting hepatic disease diagnoses using RTE and SWM. This launch expanded the applications of elastography in liver disease diagnostics.
May 2022: Mindray launched Resona I9 with HiFR Sound Touch Elastography, improving shear wave imaging acquisition and assessment. This advancement enhanced the speed and accuracy of elastography exams.
November 2022: PENTAX Medical launched a new Performance EUS system in Canada, combining the ARIETTA 65 PX ultrasound scanner and J10 Series Ultrasound Gastroscopes. This integration improved real-time tissue elastography in endoscopic procedures.
Future Outlook for Elastography Imaging Industry Market
The Elastography Imaging market is poised for substantial growth, driven by continuous technological advancements, increasing prevalence of target diseases, and expansion into new clinical applications. Strategic partnerships, mergers and acquisitions, and focused R&D efforts by key players will further shape the market landscape. The market is expected to witness a significant increase in the adoption rate of advanced elastography systems, contributing to a positive outlook over the next decade.
Elastography Imaging Industry Segmentation
-
1. Modality
- 1.1. Utrasound Elastography
- 1.2. Magnetic Resonance Elastography
-
2. Application
- 2.1. Cardiology
- 2.2. Radiology
- 2.3. Urology
- 2.4. Vascular
- 2.5. Obstetrics/Gynecology
- 2.6. Other Ap
-
3. End-User
- 3.1. Hospitals
- 3.2. Ambulatory Surgical Centers
- 3.3. Surgical & Diagnostic centers
Elastography Imaging Industry Segmentation By Geography
-
1. North America
- 1.1. United States
- 1.2. Canada
- 1.3. Mexico
-
2. Europe
- 2.1. Germany
- 2.2. United Kingdom
- 2.3. France
- 2.4. Italy
- 2.5. Spain
- 2.6. Rest of Europe
-
3. Asia Pacific
- 3.1. China
- 3.2. Japan
- 3.3. India
- 3.4. Australia
- 3.5. South Korea
- 3.6. Rest of Asia Pacific
-
4. Middle East and Africa
- 4.1. GCC
- 4.2. South Africa
- 4.3. Rest of Middle East and Africa
-
5. South America
- 5.1. Brazil
- 5.2. Argentina
- 5.3. Rest of South America
Elastography Imaging Industry REPORT HIGHLIGHTS
| Aspects | Details |
|---|---|
| Study Period | 2019-2033 |
| Base Year | 2024 |
| Estimated Year | 2025 |
| Forecast Period | 2025-2033 |
| Historical Period | 2019-2024 |
| Growth Rate | CAGR of 9.50% from 2019-2033 |
| Segmentation |
|
Table of Contents
- 1. Introduction
- 1.1. Research Scope
- 1.2. Market Segmentation
- 1.3. Research Methodology
- 1.4. Definitions and Assumptions
- 2. Executive Summary
- 2.1. Introduction
- 3. Market Dynamics
- 3.1. Introduction
- 3.2. Market Drivers
- 3.2.1. Rising Incidence of Chronic Ailments and Breast Cancer; Growing Demand for Minimally Invasive Surgeries
- 3.3. Market Restrains
- 3.3.1. Adverse Scenario of Reimbursement; High Price of Imaging Devices for Elastography
- 3.4. Market Trends
- 3.4.1. Ultrasound Modality Segment Expects to Register a High CAGR in the Forecast Period
- 4. Market Factor Analysis
- 4.1. Porters Five Forces
- 4.2. Supply/Value Chain
- 4.3. PESTEL analysis
- 4.4. Market Entropy
- 4.5. Patent/Trademark Analysis
- 5. Global Elastography Imaging Industry Analysis, Insights and Forecast, 2019-2031
- 5.1. Market Analysis, Insights and Forecast - by Modality
- 5.1.1. Utrasound Elastography
- 5.1.2. Magnetic Resonance Elastography
- 5.2. Market Analysis, Insights and Forecast - by Application
- 5.2.1. Cardiology
- 5.2.2. Radiology
- 5.2.3. Urology
- 5.2.4. Vascular
- 5.2.5. Obstetrics/Gynecology
- 5.2.6. Other Ap
- 5.3. Market Analysis, Insights and Forecast - by End-User
- 5.3.1. Hospitals
- 5.3.2. Ambulatory Surgical Centers
- 5.3.3. Surgical & Diagnostic centers
- 5.4. Market Analysis, Insights and Forecast - by Region
- 5.4.1. North America
- 5.4.2. Europe
- 5.4.3. Asia Pacific
- 5.4.4. Middle East and Africa
- 5.4.5. South America
- 5.1. Market Analysis, Insights and Forecast - by Modality
- 6. North America Elastography Imaging Industry Analysis, Insights and Forecast, 2019-2031
- 6.1. Market Analysis, Insights and Forecast - by Modality
- 6.1.1. Utrasound Elastography
- 6.1.2. Magnetic Resonance Elastography
- 6.2. Market Analysis, Insights and Forecast - by Application
- 6.2.1. Cardiology
- 6.2.2. Radiology
- 6.2.3. Urology
- 6.2.4. Vascular
- 6.2.5. Obstetrics/Gynecology
- 6.2.6. Other Ap
- 6.3. Market Analysis, Insights and Forecast - by End-User
- 6.3.1. Hospitals
- 6.3.2. Ambulatory Surgical Centers
- 6.3.3. Surgical & Diagnostic centers
- 6.1. Market Analysis, Insights and Forecast - by Modality
- 7. Europe Elastography Imaging Industry Analysis, Insights and Forecast, 2019-2031
- 7.1. Market Analysis, Insights and Forecast - by Modality
- 7.1.1. Utrasound Elastography
- 7.1.2. Magnetic Resonance Elastography
- 7.2. Market Analysis, Insights and Forecast - by Application
- 7.2.1. Cardiology
- 7.2.2. Radiology
- 7.2.3. Urology
- 7.2.4. Vascular
- 7.2.5. Obstetrics/Gynecology
- 7.2.6. Other Ap
- 7.3. Market Analysis, Insights and Forecast - by End-User
- 7.3.1. Hospitals
- 7.3.2. Ambulatory Surgical Centers
- 7.3.3. Surgical & Diagnostic centers
- 7.1. Market Analysis, Insights and Forecast - by Modality
- 8. Asia Pacific Elastography Imaging Industry Analysis, Insights and Forecast, 2019-2031
- 8.1. Market Analysis, Insights and Forecast - by Modality
- 8.1.1. Utrasound Elastography
- 8.1.2. Magnetic Resonance Elastography
- 8.2. Market Analysis, Insights and Forecast - by Application
- 8.2.1. Cardiology
- 8.2.2. Radiology
- 8.2.3. Urology
- 8.2.4. Vascular
- 8.2.5. Obstetrics/Gynecology
- 8.2.6. Other Ap
- 8.3. Market Analysis, Insights and Forecast - by End-User
- 8.3.1. Hospitals
- 8.3.2. Ambulatory Surgical Centers
- 8.3.3. Surgical & Diagnostic centers
- 8.1. Market Analysis, Insights and Forecast - by Modality
- 9. Middle East and Africa Elastography Imaging Industry Analysis, Insights and Forecast, 2019-2031
- 9.1. Market Analysis, Insights and Forecast - by Modality
- 9.1.1. Utrasound Elastography
- 9.1.2. Magnetic Resonance Elastography
- 9.2. Market Analysis, Insights and Forecast - by Application
- 9.2.1. Cardiology
- 9.2.2. Radiology
- 9.2.3. Urology
- 9.2.4. Vascular
- 9.2.5. Obstetrics/Gynecology
- 9.2.6. Other Ap
- 9.3. Market Analysis, Insights and Forecast - by End-User
- 9.3.1. Hospitals
- 9.3.2. Ambulatory Surgical Centers
- 9.3.3. Surgical & Diagnostic centers
- 9.1. Market Analysis, Insights and Forecast - by Modality
- 10. South America Elastography Imaging Industry Analysis, Insights and Forecast, 2019-2031
- 10.1. Market Analysis, Insights and Forecast - by Modality
- 10.1.1. Utrasound Elastography
- 10.1.2. Magnetic Resonance Elastography
- 10.2. Market Analysis, Insights and Forecast - by Application
- 10.2.1. Cardiology
- 10.2.2. Radiology
- 10.2.3. Urology
- 10.2.4. Vascular
- 10.2.5. Obstetrics/Gynecology
- 10.2.6. Other Ap
- 10.3. Market Analysis, Insights and Forecast - by End-User
- 10.3.1. Hospitals
- 10.3.2. Ambulatory Surgical Centers
- 10.3.3. Surgical & Diagnostic centers
- 10.1. Market Analysis, Insights and Forecast - by Modality
- 11. North America Elastography Imaging Industry Analysis, Insights and Forecast, 2019-2031
- 11.1. Market Analysis, Insights and Forecast - By Country/Sub-region
- 11.1.1 United States
- 11.1.2 Canada
- 11.1.3 Mexico
- 12. Europe Elastography Imaging Industry Analysis, Insights and Forecast, 2019-2031
- 12.1. Market Analysis, Insights and Forecast - By Country/Sub-region
- 12.1.1 Germany
- 12.1.2 United Kingdom
- 12.1.3 France
- 12.1.4 Italy
- 12.1.5 Spain
- 12.1.6 Rest of Europe
- 13. Asia Pacific Elastography Imaging Industry Analysis, Insights and Forecast, 2019-2031
- 13.1. Market Analysis, Insights and Forecast - By Country/Sub-region
- 13.1.1 China
- 13.1.2 Japan
- 13.1.3 India
- 13.1.4 Australia
- 13.1.5 South Korea
- 13.1.6 Rest of Asia Pacific
- 14. Middle East and Africa Elastography Imaging Industry Analysis, Insights and Forecast, 2019-2031
- 14.1. Market Analysis, Insights and Forecast - By Country/Sub-region
- 14.1.1 GCC
- 14.1.2 South Africa
- 14.1.3 Rest of Middle East and Africa
- 15. South America Elastography Imaging Industry Analysis, Insights and Forecast, 2019-2031
- 15.1. Market Analysis, Insights and Forecast - By Country/Sub-region
- 15.1.1 Brazil
- 15.1.2 Argentina
- 15.1.3 Rest of South America
- 16. Competitive Analysis
- 16.1. Global Market Share Analysis 2024
- 16.2. Company Profiles
- 16.2.1 Esaote SpA
- 16.2.1.1. Overview
- 16.2.1.2. Products
- 16.2.1.3. SWOT Analysis
- 16.2.1.4. Recent Developments
- 16.2.1.5. Financials (Based on Availability)
- 16.2.2 Hologic Inc
- 16.2.2.1. Overview
- 16.2.2.2. Products
- 16.2.2.3. SWOT Analysis
- 16.2.2.4. Recent Developments
- 16.2.2.5. Financials (Based on Availability)
- 16.2.3 GE Healthcare
- 16.2.3.1. Overview
- 16.2.3.2. Products
- 16.2.3.3. SWOT Analysis
- 16.2.3.4. Recent Developments
- 16.2.3.5. Financials (Based on Availability)
- 16.2.4 Resoundant Inc
- 16.2.4.1. Overview
- 16.2.4.2. Products
- 16.2.4.3. SWOT Analysis
- 16.2.4.4. Recent Developments
- 16.2.4.5. Financials (Based on Availability)
- 16.2.5 Koninklijke Philips N V
- 16.2.5.1. Overview
- 16.2.5.2. Products
- 16.2.5.3. SWOT Analysis
- 16.2.5.4. Recent Developments
- 16.2.5.5. Financials (Based on Availability)
- 16.2.6 Mindray Medical International Limited
- 16.2.6.1. Overview
- 16.2.6.2. Products
- 16.2.6.3. SWOT Analysis
- 16.2.6.4. Recent Developments
- 16.2.6.5. Financials (Based on Availability)
- 16.2.7 Siemens AG*List Not Exhaustive
- 16.2.7.1. Overview
- 16.2.7.2. Products
- 16.2.7.3. SWOT Analysis
- 16.2.7.4. Recent Developments
- 16.2.7.5. Financials (Based on Availability)
- 16.2.8 Canon Medical Systems Corporation
- 16.2.8.1. Overview
- 16.2.8.2. Products
- 16.2.8.3. SWOT Analysis
- 16.2.8.4. Recent Developments
- 16.2.8.5. Financials (Based on Availability)
- 16.2.9 Samsung Medison
- 16.2.9.1. Overview
- 16.2.9.2. Products
- 16.2.9.3. SWOT Analysis
- 16.2.9.4. Recent Developments
- 16.2.9.5. Financials (Based on Availability)
- 16.2.10 Supersonic Imagine
- 16.2.10.1. Overview
- 16.2.10.2. Products
- 16.2.10.3. SWOT Analysis
- 16.2.10.4. Recent Developments
- 16.2.10.5. Financials (Based on Availability)
- 16.2.11 Fujifilm Holdings Corporation
- 16.2.11.1. Overview
- 16.2.11.2. Products
- 16.2.11.3. SWOT Analysis
- 16.2.11.4. Recent Developments
- 16.2.11.5. Financials (Based on Availability)
- 16.2.1 Esaote SpA
List of Figures
- Figure 1: Global Elastography Imaging Industry Revenue Breakdown (Million, %) by Region 2024 & 2032
- Figure 2: North America Elastography Imaging Industry Revenue (Million), by Country 2024 & 2032
- Figure 3: North America Elastography Imaging Industry Revenue Share (%), by Country 2024 & 2032
- Figure 4: Europe Elastography Imaging Industry Revenue (Million), by Country 2024 & 2032
- Figure 5: Europe Elastography Imaging Industry Revenue Share (%), by Country 2024 & 2032
- Figure 6: Asia Pacific Elastography Imaging Industry Revenue (Million), by Country 2024 & 2032
- Figure 7: Asia Pacific Elastography Imaging Industry Revenue Share (%), by Country 2024 & 2032
- Figure 8: Middle East and Africa Elastography Imaging Industry Revenue (Million), by Country 2024 & 2032
- Figure 9: Middle East and Africa Elastography Imaging Industry Revenue Share (%), by Country 2024 & 2032
- Figure 10: South America Elastography Imaging Industry Revenue (Million), by Country 2024 & 2032
- Figure 11: South America Elastography Imaging Industry Revenue Share (%), by Country 2024 & 2032
- Figure 12: North America Elastography Imaging Industry Revenue (Million), by Modality 2024 & 2032
- Figure 13: North America Elastography Imaging Industry Revenue Share (%), by Modality 2024 & 2032
- Figure 14: North America Elastography Imaging Industry Revenue (Million), by Application 2024 & 2032
- Figure 15: North America Elastography Imaging Industry Revenue Share (%), by Application 2024 & 2032
- Figure 16: North America Elastography Imaging Industry Revenue (Million), by End-User 2024 & 2032
- Figure 17: North America Elastography Imaging Industry Revenue Share (%), by End-User 2024 & 2032
- Figure 18: North America Elastography Imaging Industry Revenue (Million), by Country 2024 & 2032
- Figure 19: North America Elastography Imaging Industry Revenue Share (%), by Country 2024 & 2032
- Figure 20: Europe Elastography Imaging Industry Revenue (Million), by Modality 2024 & 2032
- Figure 21: Europe Elastography Imaging Industry Revenue Share (%), by Modality 2024 & 2032
- Figure 22: Europe Elastography Imaging Industry Revenue (Million), by Application 2024 & 2032
- Figure 23: Europe Elastography Imaging Industry Revenue Share (%), by Application 2024 & 2032
- Figure 24: Europe Elastography Imaging Industry Revenue (Million), by End-User 2024 & 2032
- Figure 25: Europe Elastography Imaging Industry Revenue Share (%), by End-User 2024 & 2032
- Figure 26: Europe Elastography Imaging Industry Revenue (Million), by Country 2024 & 2032
- Figure 27: Europe Elastography Imaging Industry Revenue Share (%), by Country 2024 & 2032
- Figure 28: Asia Pacific Elastography Imaging Industry Revenue (Million), by Modality 2024 & 2032
- Figure 29: Asia Pacific Elastography Imaging Industry Revenue Share (%), by Modality 2024 & 2032
- Figure 30: Asia Pacific Elastography Imaging Industry Revenue (Million), by Application 2024 & 2032
- Figure 31: Asia Pacific Elastography Imaging Industry Revenue Share (%), by Application 2024 & 2032
- Figure 32: Asia Pacific Elastography Imaging Industry Revenue (Million), by End-User 2024 & 2032
- Figure 33: Asia Pacific Elastography Imaging Industry Revenue Share (%), by End-User 2024 & 2032
- Figure 34: Asia Pacific Elastography Imaging Industry Revenue (Million), by Country 2024 & 2032
- Figure 35: Asia Pacific Elastography Imaging Industry Revenue Share (%), by Country 2024 & 2032
- Figure 36: Middle East and Africa Elastography Imaging Industry Revenue (Million), by Modality 2024 & 2032
- Figure 37: Middle East and Africa Elastography Imaging Industry Revenue Share (%), by Modality 2024 & 2032
- Figure 38: Middle East and Africa Elastography Imaging Industry Revenue (Million), by Application 2024 & 2032
- Figure 39: Middle East and Africa Elastography Imaging Industry Revenue Share (%), by Application 2024 & 2032
- Figure 40: Middle East and Africa Elastography Imaging Industry Revenue (Million), by End-User 2024 & 2032
- Figure 41: Middle East and Africa Elastography Imaging Industry Revenue Share (%), by End-User 2024 & 2032
- Figure 42: Middle East and Africa Elastography Imaging Industry Revenue (Million), by Country 2024 & 2032
- Figure 43: Middle East and Africa Elastography Imaging Industry Revenue Share (%), by Country 2024 & 2032
- Figure 44: South America Elastography Imaging Industry Revenue (Million), by Modality 2024 & 2032
- Figure 45: South America Elastography Imaging Industry Revenue Share (%), by Modality 2024 & 2032
- Figure 46: South America Elastography Imaging Industry Revenue (Million), by Application 2024 & 2032
- Figure 47: South America Elastography Imaging Industry Revenue Share (%), by Application 2024 & 2032
- Figure 48: South America Elastography Imaging Industry Revenue (Million), by End-User 2024 & 2032
- Figure 49: South America Elastography Imaging Industry Revenue Share (%), by End-User 2024 & 2032
- Figure 50: South America Elastography Imaging Industry Revenue (Million), by Country 2024 & 2032
- Figure 51: South America Elastography Imaging Industry Revenue Share (%), by Country 2024 & 2032
List of Tables
- Table 1: Global Elastography Imaging Industry Revenue Million Forecast, by Region 2019 & 2032
- Table 2: Global Elastography Imaging Industry Revenue Million Forecast, by Modality 2019 & 2032
- Table 3: Global Elastography Imaging Industry Revenue Million Forecast, by Application 2019 & 2032
- Table 4: Global Elastography Imaging Industry Revenue Million Forecast, by End-User 2019 & 2032
- Table 5: Global Elastography Imaging Industry Revenue Million Forecast, by Region 2019 & 2032
- Table 6: Global Elastography Imaging Industry Revenue Million Forecast, by Country 2019 & 2032
- Table 7: United States Elastography Imaging Industry Revenue (Million) Forecast, by Application 2019 & 2032
- Table 8: Canada Elastography Imaging Industry Revenue (Million) Forecast, by Application 2019 & 2032
- Table 9: Mexico Elastography Imaging Industry Revenue (Million) Forecast, by Application 2019 & 2032
- Table 10: Global Elastography Imaging Industry Revenue Million Forecast, by Country 2019 & 2032
- Table 11: Germany Elastography Imaging Industry Revenue (Million) Forecast, by Application 2019 & 2032
- Table 12: United Kingdom Elastography Imaging Industry Revenue (Million) Forecast, by Application 2019 & 2032
- Table 13: France Elastography Imaging Industry Revenue (Million) Forecast, by Application 2019 & 2032
- Table 14: Italy Elastography Imaging Industry Revenue (Million) Forecast, by Application 2019 & 2032
- Table 15: Spain Elastography Imaging Industry Revenue (Million) Forecast, by Application 2019 & 2032
- Table 16: Rest of Europe Elastography Imaging Industry Revenue (Million) Forecast, by Application 2019 & 2032
- Table 17: Global Elastography Imaging Industry Revenue Million Forecast, by Country 2019 & 2032
- Table 18: China Elastography Imaging Industry Revenue (Million) Forecast, by Application 2019 & 2032
- Table 19: Japan Elastography Imaging Industry Revenue (Million) Forecast, by Application 2019 & 2032
- Table 20: India Elastography Imaging Industry Revenue (Million) Forecast, by Application 2019 & 2032
- Table 21: Australia Elastography Imaging Industry Revenue (Million) Forecast, by Application 2019 & 2032
- Table 22: South Korea Elastography Imaging Industry Revenue (Million) Forecast, by Application 2019 & 2032
- Table 23: Rest of Asia Pacific Elastography Imaging Industry Revenue (Million) Forecast, by Application 2019 & 2032
- Table 24: Global Elastography Imaging Industry Revenue Million Forecast, by Country 2019 & 2032
- Table 25: GCC Elastography Imaging Industry Revenue (Million) Forecast, by Application 2019 & 2032
- Table 26: South Africa Elastography Imaging Industry Revenue (Million) Forecast, by Application 2019 & 2032
- Table 27: Rest of Middle East and Africa Elastography Imaging Industry Revenue (Million) Forecast, by Application 2019 & 2032
- Table 28: Global Elastography Imaging Industry Revenue Million Forecast, by Country 2019 & 2032
- Table 29: Brazil Elastography Imaging Industry Revenue (Million) Forecast, by Application 2019 & 2032
- Table 30: Argentina Elastography Imaging Industry Revenue (Million) Forecast, by Application 2019 & 2032
- Table 31: Rest of South America Elastography Imaging Industry Revenue (Million) Forecast, by Application 2019 & 2032
- Table 32: Global Elastography Imaging Industry Revenue Million Forecast, by Modality 2019 & 2032
- Table 33: Global Elastography Imaging Industry Revenue Million Forecast, by Application 2019 & 2032
- Table 34: Global Elastography Imaging Industry Revenue Million Forecast, by End-User 2019 & 2032
- Table 35: Global Elastography Imaging Industry Revenue Million Forecast, by Country 2019 & 2032
- Table 36: United States Elastography Imaging Industry Revenue (Million) Forecast, by Application 2019 & 2032
- Table 37: Canada Elastography Imaging Industry Revenue (Million) Forecast, by Application 2019 & 2032
- Table 38: Mexico Elastography Imaging Industry Revenue (Million) Forecast, by Application 2019 & 2032
- Table 39: Global Elastography Imaging Industry Revenue Million Forecast, by Modality 2019 & 2032
- Table 40: Global Elastography Imaging Industry Revenue Million Forecast, by Application 2019 & 2032
- Table 41: Global Elastography Imaging Industry Revenue Million Forecast, by End-User 2019 & 2032
- Table 42: Global Elastography Imaging Industry Revenue Million Forecast, by Country 2019 & 2032
- Table 43: Germany Elastography Imaging Industry Revenue (Million) Forecast, by Application 2019 & 2032
- Table 44: United Kingdom Elastography Imaging Industry Revenue (Million) Forecast, by Application 2019 & 2032
- Table 45: France Elastography Imaging Industry Revenue (Million) Forecast, by Application 2019 & 2032
- Table 46: Italy Elastography Imaging Industry Revenue (Million) Forecast, by Application 2019 & 2032
- Table 47: Spain Elastography Imaging Industry Revenue (Million) Forecast, by Application 2019 & 2032
- Table 48: Rest of Europe Elastography Imaging Industry Revenue (Million) Forecast, by Application 2019 & 2032
- Table 49: Global Elastography Imaging Industry Revenue Million Forecast, by Modality 2019 & 2032
- Table 50: Global Elastography Imaging Industry Revenue Million Forecast, by Application 2019 & 2032
- Table 51: Global Elastography Imaging Industry Revenue Million Forecast, by End-User 2019 & 2032
- Table 52: Global Elastography Imaging Industry Revenue Million Forecast, by Country 2019 & 2032
- Table 53: China Elastography Imaging Industry Revenue (Million) Forecast, by Application 2019 & 2032
- Table 54: Japan Elastography Imaging Industry Revenue (Million) Forecast, by Application 2019 & 2032
- Table 55: India Elastography Imaging Industry Revenue (Million) Forecast, by Application 2019 & 2032
- Table 56: Australia Elastography Imaging Industry Revenue (Million) Forecast, by Application 2019 & 2032
- Table 57: South Korea Elastography Imaging Industry Revenue (Million) Forecast, by Application 2019 & 2032
- Table 58: Rest of Asia Pacific Elastography Imaging Industry Revenue (Million) Forecast, by Application 2019 & 2032
- Table 59: Global Elastography Imaging Industry Revenue Million Forecast, by Modality 2019 & 2032
- Table 60: Global Elastography Imaging Industry Revenue Million Forecast, by Application 2019 & 2032
- Table 61: Global Elastography Imaging Industry Revenue Million Forecast, by End-User 2019 & 2032
- Table 62: Global Elastography Imaging Industry Revenue Million Forecast, by Country 2019 & 2032
- Table 63: GCC Elastography Imaging Industry Revenue (Million) Forecast, by Application 2019 & 2032
- Table 64: South Africa Elastography Imaging Industry Revenue (Million) Forecast, by Application 2019 & 2032
- Table 65: Rest of Middle East and Africa Elastography Imaging Industry Revenue (Million) Forecast, by Application 2019 & 2032
- Table 66: Global Elastography Imaging Industry Revenue Million Forecast, by Modality 2019 & 2032
- Table 67: Global Elastography Imaging Industry Revenue Million Forecast, by Application 2019 & 2032
- Table 68: Global Elastography Imaging Industry Revenue Million Forecast, by End-User 2019 & 2032
- Table 69: Global Elastography Imaging Industry Revenue Million Forecast, by Country 2019 & 2032
- Table 70: Brazil Elastography Imaging Industry Revenue (Million) Forecast, by Application 2019 & 2032
- Table 71: Argentina Elastography Imaging Industry Revenue (Million) Forecast, by Application 2019 & 2032
- Table 72: Rest of South America Elastography Imaging Industry Revenue (Million) Forecast, by Application 2019 & 2032
Frequently Asked Questions
1. What is the projected Compound Annual Growth Rate (CAGR) of the Elastography Imaging Industry?
The projected CAGR is approximately 9.50%.
2. Which companies are prominent players in the Elastography Imaging Industry?
Key companies in the market include Esaote SpA, Hologic Inc, GE Healthcare, Resoundant Inc, Koninklijke Philips N V, Mindray Medical International Limited, Siemens AG*List Not Exhaustive, Canon Medical Systems Corporation, Samsung Medison, Supersonic Imagine, Fujifilm Holdings Corporation.
3. What are the main segments of the Elastography Imaging Industry?
The market segments include Modality, Application, End-User.
4. Can you provide details about the market size?
The market size is estimated to be USD XX Million as of 2022.
5. What are some drivers contributing to market growth?
Rising Incidence of Chronic Ailments and Breast Cancer; Growing Demand for Minimally Invasive Surgeries.
6. What are the notable trends driving market growth?
Ultrasound Modality Segment Expects to Register a High CAGR in the Forecast Period.
7. Are there any restraints impacting market growth?
Adverse Scenario of Reimbursement; High Price of Imaging Devices for Elastography.
8. Can you provide examples of recent developments in the market?
November 2022: PENTAX Medical launched its new Performance Endoscopic Ultrasound (EUS) system in Canada. The system consists of a combination of its new ARIETTA 65 PX ultrasound scanner and its best-in-class J10 Series Ultrasound Gastroscopes. The J10 Series Ultrasound Gastroscope and ARIETTA 65 PX offer high image quality, real-time tissue elastography, and better therapeutic access.
9. What pricing options are available for accessing the report?
Pricing options include single-user, multi-user, and enterprise licenses priced at USD 4750, USD 5250, and USD 8750 respectively.
10. Is the market size provided in terms of value or volume?
The market size is provided in terms of value, measured in Million.
11. Are there any specific market keywords associated with the report?
Yes, the market keyword associated with the report is "Elastography Imaging Industry," which aids in identifying and referencing the specific market segment covered.
12. How do I determine which pricing option suits my needs best?
The pricing options vary based on user requirements and access needs. Individual users may opt for single-user licenses, while businesses requiring broader access may choose multi-user or enterprise licenses for cost-effective access to the report.
13. Are there any additional resources or data provided in the Elastography Imaging Industry report?
While the report offers comprehensive insights, it's advisable to review the specific contents or supplementary materials provided to ascertain if additional resources or data are available.
14. How can I stay updated on further developments or reports in the Elastography Imaging Industry?
To stay informed about further developments, trends, and reports in the Elastography Imaging Industry, consider subscribing to industry newsletters, following relevant companies and organizations, or regularly checking reputable industry news sources and publications.
Methodology
Step 1 - Identification of Relevant Samples Size from Population Database


Step 2 - Approaches for Defining Global Market Size (Value, Volume* & Price*)

Note*: In applicable scenarios
Step 3 - Data Sources
Primary Research
- Web Analytics
- Survey Reports
- Research Institute
- Latest Research Reports
- Opinion Leaders
Secondary Research
- Annual Reports
- White Paper
- Latest Press Release
- Industry Association
- Paid Database
- Investor Presentations

Step 4 - Data Triangulation
Involves using different sources of information in order to increase the validity of a study
These sources are likely to be stakeholders in a program - participants, other researchers, program staff, other community members, and so on.
Then we put all data in single framework & apply various statistical tools to find out the dynamic on the market.
During the analysis stage, feedback from the stakeholder groups would be compared to determine areas of agreement as well as areas of divergence


