
Key Insights
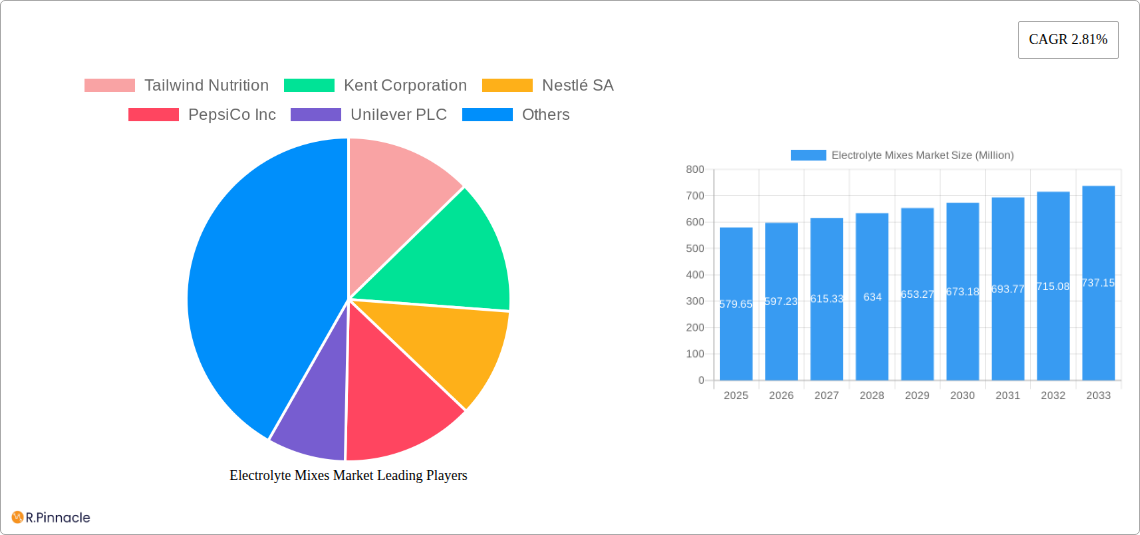
The global electrolyte mixes market, valued at $579.65 million in 2025, is projected to experience steady growth, driven by increasing health consciousness and rising participation in sports and fitness activities. Consumers are increasingly aware of the importance of hydration and electrolyte replenishment for maintaining optimal physical performance and overall well-being. This trend fuels demand across various product types, including ready-to-drink (RTD) beverages, electrolyte powders, and tablets. The convenience of RTD beverages contributes to their significant market share, while powders and tablets cater to consumers seeking cost-effective and portable options. Growth is further propelled by expanding distribution channels, with supermarkets/hypermarkets, convenience stores, and online retail stores playing pivotal roles in market accessibility. However, factors such as the presence of substitute beverages and potential concerns about added sugars or artificial ingredients could act as restraints on market expansion. The market's segmentation by flavor (flavored and unflavored) also plays a role, with flavored options likely dominating due to enhanced palatability. Geographic variations exist, with North America and Europe currently leading in market share, but the Asia-Pacific region presents significant growth potential due to rising disposable incomes and increased health awareness.
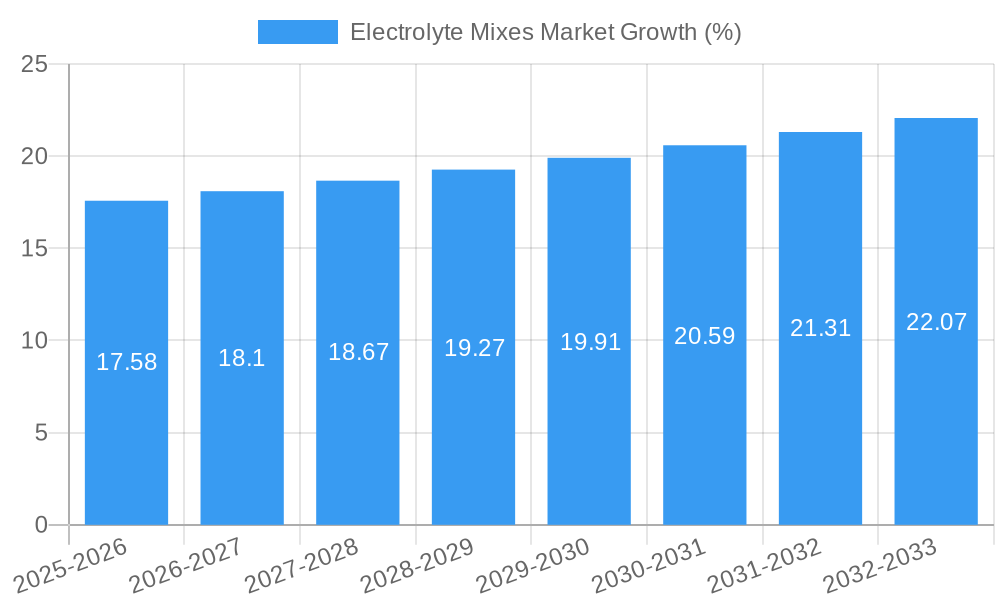
The market's projected Compound Annual Growth Rate (CAGR) of 2.81% from 2025 to 2033 suggests a consistent, albeit moderate, expansion. This growth is expected to be fueled by innovation in product formulations, including the development of electrolyte mixes tailored to specific needs, like those designed for endurance athletes or individuals with specific dietary requirements. Marketing efforts focusing on the health benefits of electrolyte replenishment, and the incorporation of natural ingredients and functional benefits, will further enhance market appeal. The competitive landscape is characterized by a mix of established multinational companies and smaller specialized brands. These companies are expected to engage in competitive strategies like product diversification, strategic partnerships, and mergers and acquisitions to strengthen their market presence and capture a larger share of the growing market. Continued research and development leading to improved product formulations and enhanced consumer experience will remain crucial for long-term market success.
This comprehensive report provides an in-depth analysis of the global Electrolyte Mixes market, covering the period 2019-2033. It offers valuable insights into market dynamics, growth drivers, competitive landscape, and future outlook, empowering industry professionals to make informed strategic decisions. The report leverages extensive market research and data analysis to provide a detailed overview of the market’s current state and future trajectory. With a focus on actionable insights, this report is an indispensable resource for stakeholders across the electrolyte mixes value chain. The estimated market size in 2025 is valued at xx Million, with a projected CAGR of xx% during the forecast period (2025-2033).
Electrolyte Mixes Market Structure & Innovation Trends
The global electrolyte mixes market exhibits a moderately consolidated structure with key players like Tailwind Nutrition, Kent Corporation, Nestlé SA, PepsiCo Inc, Unilever PLC, Abbott Laboratories, LyteLine LLC, Otsuka Holdings Co Ltd, Vitalyte Sports Nutrition Inc, Ultima Health Products Inc holding significant market share. However, the market also accommodates several smaller players, fostering competition. Market share distribution is dynamic, with ongoing mergers and acquisitions (M&A) activities influencing the competitive landscape. For example, the Nestlé Health Science Company's acquisition of Nuun in July 2021 significantly impacted market positioning. The total M&A deal value in the last five years is estimated at xx Million.
Innovation is a critical driver in this market, fueled by the development of novel formulations, enhanced flavors, and convenient packaging formats. Growing consumer health consciousness and the rising demand for functional beverages are further boosting innovation. Stringent regulatory frameworks concerning food safety and labeling impact product development. Product substitutes, such as plain water and other hydration drinks, pose competitive challenges. End-user demographics are shifting towards health-conscious millennials and Gen Z, influencing product development strategies.
- Market Concentration: Moderately Consolidated
- Innovation Drivers: New Formulations, Convenient Packaging, Health Trends
- Regulatory Frameworks: Stringent food safety and labeling regulations
- M&A Activity: Significant, impacting market share and competitive dynamics (e.g., Nestlé's acquisition of Nuun)
- Average M&A Deal Value (Last 5 years): xx Million
Electrolyte Mixes Market Dynamics & Trends
The electrolyte mixes market is experiencing robust growth, driven by several factors. Rising health awareness, increasing participation in sports and fitness activities, and a growing preference for convenient hydration solutions are key market growth drivers. Technological advancements in product formulation and packaging are further enhancing market appeal. The market penetration of electrolyte mixes in key regions is steadily increasing, particularly among health-conscious consumers. Changing consumer preferences toward healthier alternatives are pushing the market toward more natural and functional ingredients. Competitive dynamics are characterized by both intense rivalry among established players and the emergence of new entrants. The market is witnessing a shift towards premium and specialized products catering to niche consumer segments. The CAGR for the historical period (2019-2024) was xx%, and is projected to remain robust during the forecast period.
Dominant Regions & Segments in Electrolyte Mixes Market
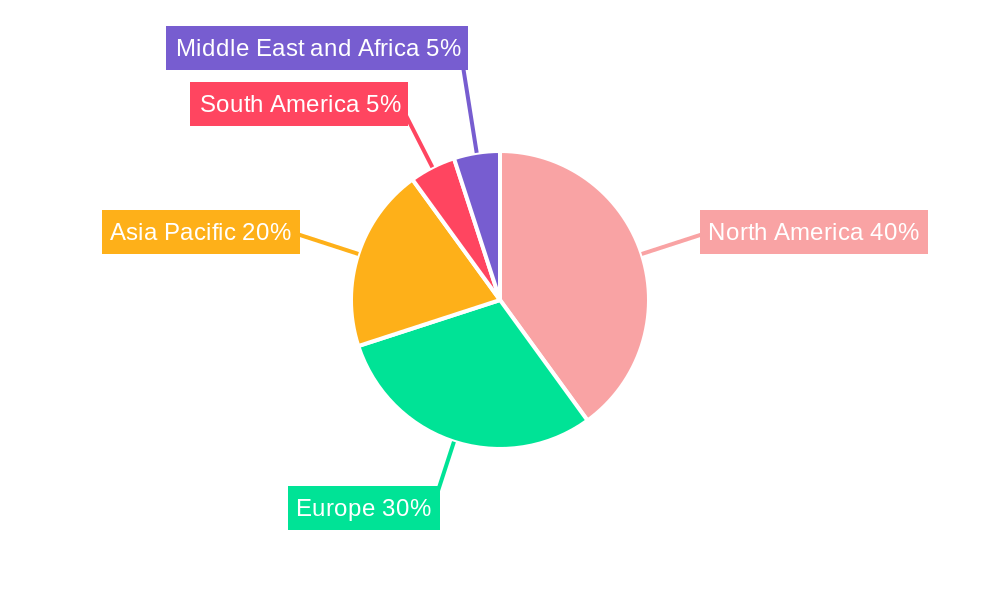
The North American region currently dominates the global electrolyte mixes market, driven by high consumer spending on health and wellness products and established distribution channels. However, the Asia-Pacific region is showing significant growth potential due to rising disposable incomes and increasing health awareness.
Key Drivers:
- North America: High consumer spending on health and wellness, well-established distribution networks.
- Asia-Pacific: Rising disposable incomes, expanding fitness culture.
Dominant Segments:
- Product Type: RTD Beverages hold the largest market share due to convenience, followed by electrolyte powders. Tablets are a growing segment.
- Flavor: Flavored electrolyte mixes are significantly more popular than unflavored variants due to their enhanced taste profiles.
- Distribution Channel: Supermarkets/Hypermarkets remain the dominant distribution channel, with online retail channels showing significant growth.
Detailed analysis shows the North American market holds the largest market share (xx%), followed by Europe (xx%) and Asia-Pacific (xx%). The dominance of specific regions and segments is influenced by factors like economic policies, consumer preferences, infrastructure development, and the presence of established distribution channels.
Electrolyte Mixes Market Product Innovations
Recent innovations in the electrolyte mixes market focus on enhanced formulations incorporating probiotics, functional ingredients, and natural sweeteners to meet the increasing demand for healthier and more functional hydration solutions. Manufacturers are also emphasizing sustainable and eco-friendly packaging options. These innovations offer competitive advantages by catering to evolving consumer preferences and health concerns. The introduction of powdered kombucha blends, as seen with Liquid IV’s launch, exemplifies the integration of functional ingredients for enhanced health benefits. This focus on functional benefits positions electrolyte mixes as more than just hydration solutions.
Report Scope & Segmentation Analysis
This report segments the electrolyte mixes market based on several key parameters:
Product Type: RTD Beverages, Electrolyte Powders, Tablets. RTD beverages are projected to maintain the largest market share throughout the forecast period. Powdered mixes offer cost-effectiveness and portability, while tablets provide convenience.
Flavor: Flavored and Unflavored. Flavored mixes dominate, driven by consumer preference.
Distribution Channel: Supermarkets/Hypermarkets, Convenience Stores, Pharmacies/Drug Stores, Online Retail Stores, Other Distribution Channels. Supermarkets/hypermarkets maintain a leading position. Online channels are experiencing the fastest growth.
Each segment's growth projections are presented in the detailed report, alongside market size estimates and competitive analysis.
Key Drivers of Electrolyte Mixes Market Growth
The electrolyte mixes market is driven by the growing consumer awareness of hydration's importance, especially among athletes and fitness enthusiasts. The rising prevalence of dehydration-related health issues fuels demand. Economic factors, such as increasing disposable incomes in developing economies, also contribute to market expansion. Favorable regulatory environments supporting the health and wellness industry are creating opportunities for growth.
Challenges in the Electrolyte Mixes Market Sector
The electrolyte mixes market faces challenges such as intense competition from established players and new entrants. Supply chain disruptions can impact production and distribution, affecting market stability. Stringent regulatory requirements regarding labeling and ingredient sourcing can increase production costs and complexity. Price volatility of raw materials also poses a significant challenge.
Emerging Opportunities in Electrolyte Mixes Market
Emerging opportunities lie in the development of specialized electrolyte mixes catering to specific demographics, such as athletes, children, or older adults. The incorporation of functional ingredients, like probiotics or antioxidants, presents a significant growth avenue. Expansion into emerging markets with growing health awareness presents considerable untapped potential.
Leading Players in the Electrolyte Mixes Market Market
- Tailwind Nutrition
- Kent Corporation
- Nestlé SA
- PepsiCo Inc
- Unilever PLC
- Abbott Laboratories
- LyteLine LLC
- Otsuka Holdings Co Ltd
- Vitalyte Sports Nutrition Inc
- Ultima Health Products Inc
Key Developments in Electrolyte Mixes Market Industry
- July 2021: Nestlé Health Science acquired Nuun, expanding its portfolio of functional hydration products. This acquisition significantly impacted market share and competitive dynamics.
- March 2022: Gatorade Canada partnered with Canada Soccer, solidifying its position in the sports nutrition market. This partnership boosted brand visibility and market presence.
- May 2022: Liquid IV launched Hydration Multiplier+ Powdered Probiotic Kombucha, introducing a novel product with added health benefits. This launch signifies innovation within the market and diversification of product offerings.
Future Outlook for Electrolyte Mixes Market Market
The future outlook for the electrolyte mixes market remains positive, driven by continuous innovation, evolving consumer preferences, and expansion into new markets. Strategic partnerships, product diversification, and a focus on sustainable practices will be crucial for success. The market's continued growth is expected to be fueled by increasing health consciousness and the rising demand for convenient, functional hydration solutions.
Electrolyte Mixes Market Segmentation
-
1. Product Type
- 1.1. RTD Beverages
- 1.2. Electrolyte Powders
- 1.3. Tablets
-
2. Flavor
- 2.1. Flavored
- 2.2. Unflavored
-
3. Distribution Channel
- 3.1. Supermarkets/Hypermarkets
- 3.2. Convenience Stores
- 3.3. Pharmacies/Drug Stores
- 3.4. Online Retail Stores
- 3.5. Other Distribution Channels
Electrolyte Mixes Market Segmentation By Geography
-
1. North America
- 1.1. United States
- 1.2. Canada
- 1.3. Mexico
- 1.4. Rest of North America
-
2. Europe
- 2.1. United Kingdom
- 2.2. Germany
- 2.3. France
- 2.4. Russia
- 2.5. Italy
- 2.6. Spain
- 2.7. Rest of Europe
-
3. Asia Pacific
- 3.1. China
- 3.2. India
- 3.3. Japan
- 3.4. Australia
- 3.5. Rest of Asia Pacific
-
4. South America
- 4.1. Brazil
- 4.2. Argentina
- 4.3. Rest of South America
-
5. Middle East and Africa
- 5.1. South Africa
- 5.2. United Arab Emirates
- 5.3. Rest of Middle East and Africa
Electrolyte Mixes Market REPORT HIGHLIGHTS
| Aspects | Details |
|---|---|
| Study Period | 2019-2033 |
| Base Year | 2024 |
| Estimated Year | 2025 |
| Forecast Period | 2025-2033 |
| Historical Period | 2019-2024 |
| Growth Rate | CAGR of 2.81% from 2019-2033 |
| Segmentation |
|
Table of Contents
- 1. Introduction
- 1.1. Research Scope
- 1.2. Market Segmentation
- 1.3. Research Methodology
- 1.4. Definitions and Assumptions
- 2. Executive Summary
- 2.1. Introduction
- 3. Market Dynamics
- 3.1. Introduction
- 3.2. Market Drivers
- 3.2.1. Rising Demand For Ready Meals Food Products to Influence Growth; Increasing Demand for Organic and Vegan Ready-to-Eat food products.
- 3.3. Market Restrains
- 3.3.1. Rising Concern Over Health Issues Associated with Processed Foods
- 3.4. Market Trends
- 3.4.1 Surging Interest Among Consumers in Physical Activities
- 3.4.2 Including Gyms
- 4. Market Factor Analysis
- 4.1. Porters Five Forces
- 4.2. Supply/Value Chain
- 4.3. PESTEL analysis
- 4.4. Market Entropy
- 4.5. Patent/Trademark Analysis
- 5. Global Electrolyte Mixes Market Analysis, Insights and Forecast, 2019-2031
- 5.1. Market Analysis, Insights and Forecast - by Product Type
- 5.1.1. RTD Beverages
- 5.1.2. Electrolyte Powders
- 5.1.3. Tablets
- 5.2. Market Analysis, Insights and Forecast - by Flavor
- 5.2.1. Flavored
- 5.2.2. Unflavored
- 5.3. Market Analysis, Insights and Forecast - by Distribution Channel
- 5.3.1. Supermarkets/Hypermarkets
- 5.3.2. Convenience Stores
- 5.3.3. Pharmacies/Drug Stores
- 5.3.4. Online Retail Stores
- 5.3.5. Other Distribution Channels
- 5.4. Market Analysis, Insights and Forecast - by Region
- 5.4.1. North America
- 5.4.2. Europe
- 5.4.3. Asia Pacific
- 5.4.4. South America
- 5.4.5. Middle East and Africa
- 5.1. Market Analysis, Insights and Forecast - by Product Type
- 6. North America Electrolyte Mixes Market Analysis, Insights and Forecast, 2019-2031
- 6.1. Market Analysis, Insights and Forecast - by Product Type
- 6.1.1. RTD Beverages
- 6.1.2. Electrolyte Powders
- 6.1.3. Tablets
- 6.2. Market Analysis, Insights and Forecast - by Flavor
- 6.2.1. Flavored
- 6.2.2. Unflavored
- 6.3. Market Analysis, Insights and Forecast - by Distribution Channel
- 6.3.1. Supermarkets/Hypermarkets
- 6.3.2. Convenience Stores
- 6.3.3. Pharmacies/Drug Stores
- 6.3.4. Online Retail Stores
- 6.3.5. Other Distribution Channels
- 6.1. Market Analysis, Insights and Forecast - by Product Type
- 7. Europe Electrolyte Mixes Market Analysis, Insights and Forecast, 2019-2031
- 7.1. Market Analysis, Insights and Forecast - by Product Type
- 7.1.1. RTD Beverages
- 7.1.2. Electrolyte Powders
- 7.1.3. Tablets
- 7.2. Market Analysis, Insights and Forecast - by Flavor
- 7.2.1. Flavored
- 7.2.2. Unflavored
- 7.3. Market Analysis, Insights and Forecast - by Distribution Channel
- 7.3.1. Supermarkets/Hypermarkets
- 7.3.2. Convenience Stores
- 7.3.3. Pharmacies/Drug Stores
- 7.3.4. Online Retail Stores
- 7.3.5. Other Distribution Channels
- 7.1. Market Analysis, Insights and Forecast - by Product Type
- 8. Asia Pacific Electrolyte Mixes Market Analysis, Insights and Forecast, 2019-2031
- 8.1. Market Analysis, Insights and Forecast - by Product Type
- 8.1.1. RTD Beverages
- 8.1.2. Electrolyte Powders
- 8.1.3. Tablets
- 8.2. Market Analysis, Insights and Forecast - by Flavor
- 8.2.1. Flavored
- 8.2.2. Unflavored
- 8.3. Market Analysis, Insights and Forecast - by Distribution Channel
- 8.3.1. Supermarkets/Hypermarkets
- 8.3.2. Convenience Stores
- 8.3.3. Pharmacies/Drug Stores
- 8.3.4. Online Retail Stores
- 8.3.5. Other Distribution Channels
- 8.1. Market Analysis, Insights and Forecast - by Product Type
- 9. South America Electrolyte Mixes Market Analysis, Insights and Forecast, 2019-2031
- 9.1. Market Analysis, Insights and Forecast - by Product Type
- 9.1.1. RTD Beverages
- 9.1.2. Electrolyte Powders
- 9.1.3. Tablets
- 9.2. Market Analysis, Insights and Forecast - by Flavor
- 9.2.1. Flavored
- 9.2.2. Unflavored
- 9.3. Market Analysis, Insights and Forecast - by Distribution Channel
- 9.3.1. Supermarkets/Hypermarkets
- 9.3.2. Convenience Stores
- 9.3.3. Pharmacies/Drug Stores
- 9.3.4. Online Retail Stores
- 9.3.5. Other Distribution Channels
- 9.1. Market Analysis, Insights and Forecast - by Product Type
- 10. Middle East and Africa Electrolyte Mixes Market Analysis, Insights and Forecast, 2019-2031
- 10.1. Market Analysis, Insights and Forecast - by Product Type
- 10.1.1. RTD Beverages
- 10.1.2. Electrolyte Powders
- 10.1.3. Tablets
- 10.2. Market Analysis, Insights and Forecast - by Flavor
- 10.2.1. Flavored
- 10.2.2. Unflavored
- 10.3. Market Analysis, Insights and Forecast - by Distribution Channel
- 10.3.1. Supermarkets/Hypermarkets
- 10.3.2. Convenience Stores
- 10.3.3. Pharmacies/Drug Stores
- 10.3.4. Online Retail Stores
- 10.3.5. Other Distribution Channels
- 10.1. Market Analysis, Insights and Forecast - by Product Type
- 11. North America Electrolyte Mixes Market Analysis, Insights and Forecast, 2019-2031
- 11.1. Market Analysis, Insights and Forecast - By Country/Sub-region
- 11.1.1 United States
- 11.1.2 Canada
- 11.1.3 Mexico
- 11.1.4 Rest of North America
- 12. Europe Electrolyte Mixes Market Analysis, Insights and Forecast, 2019-2031
- 12.1. Market Analysis, Insights and Forecast - By Country/Sub-region
- 12.1.1 United Kingdom
- 12.1.2 Germany
- 12.1.3 France
- 12.1.4 Russia
- 12.1.5 Italy
- 12.1.6 Spain
- 12.1.7 Rest of Europe
- 13. Asia Pacific Electrolyte Mixes Market Analysis, Insights and Forecast, 2019-2031
- 13.1. Market Analysis, Insights and Forecast - By Country/Sub-region
- 13.1.1 China
- 13.1.2 India
- 13.1.3 Japan
- 13.1.4 Australia
- 13.1.5 Rest of Asia Pacific
- 14. South America Electrolyte Mixes Market Analysis, Insights and Forecast, 2019-2031
- 14.1. Market Analysis, Insights and Forecast - By Country/Sub-region
- 14.1.1 Brazil
- 14.1.2 Argentina
- 14.1.3 Rest of South America
- 15. Middle East and Africa Electrolyte Mixes Market Analysis, Insights and Forecast, 2019-2031
- 15.1. Market Analysis, Insights and Forecast - By Country/Sub-region
- 15.1.1 South Africa
- 15.1.2 United Arab Emirates
- 15.1.3 Rest of Middle East and Africa
- 16. Competitive Analysis
- 16.1. Global Market Share Analysis 2024
- 16.2. Company Profiles
- 16.2.1 Tailwind Nutrition
- 16.2.1.1. Overview
- 16.2.1.2. Products
- 16.2.1.3. SWOT Analysis
- 16.2.1.4. Recent Developments
- 16.2.1.5. Financials (Based on Availability)
- 16.2.2 Kent Corporation
- 16.2.2.1. Overview
- 16.2.2.2. Products
- 16.2.2.3. SWOT Analysis
- 16.2.2.4. Recent Developments
- 16.2.2.5. Financials (Based on Availability)
- 16.2.3 Nestlé SA
- 16.2.3.1. Overview
- 16.2.3.2. Products
- 16.2.3.3. SWOT Analysis
- 16.2.3.4. Recent Developments
- 16.2.3.5. Financials (Based on Availability)
- 16.2.4 PepsiCo Inc
- 16.2.4.1. Overview
- 16.2.4.2. Products
- 16.2.4.3. SWOT Analysis
- 16.2.4.4. Recent Developments
- 16.2.4.5. Financials (Based on Availability)
- 16.2.5 Unilever PLC
- 16.2.5.1. Overview
- 16.2.5.2. Products
- 16.2.5.3. SWOT Analysis
- 16.2.5.4. Recent Developments
- 16.2.5.5. Financials (Based on Availability)
- 16.2.6 Abbott Laboratories
- 16.2.6.1. Overview
- 16.2.6.2. Products
- 16.2.6.3. SWOT Analysis
- 16.2.6.4. Recent Developments
- 16.2.6.5. Financials (Based on Availability)
- 16.2.7 LyteLine LLC
- 16.2.7.1. Overview
- 16.2.7.2. Products
- 16.2.7.3. SWOT Analysis
- 16.2.7.4. Recent Developments
- 16.2.7.5. Financials (Based on Availability)
- 16.2.8 Otsuka Holdings Co Ltd
- 16.2.8.1. Overview
- 16.2.8.2. Products
- 16.2.8.3. SWOT Analysis
- 16.2.8.4. Recent Developments
- 16.2.8.5. Financials (Based on Availability)
- 16.2.9 Vitalyte Sports Nutrition Inc *List Not Exhaustive
- 16.2.9.1. Overview
- 16.2.9.2. Products
- 16.2.9.3. SWOT Analysis
- 16.2.9.4. Recent Developments
- 16.2.9.5. Financials (Based on Availability)
- 16.2.10 Ultima Health Products Inc
- 16.2.10.1. Overview
- 16.2.10.2. Products
- 16.2.10.3. SWOT Analysis
- 16.2.10.4. Recent Developments
- 16.2.10.5. Financials (Based on Availability)
- 16.2.1 Tailwind Nutrition
List of Figures
- Figure 1: Global Electrolyte Mixes Market Revenue Breakdown (Million, %) by Region 2024 & 2032
- Figure 2: North America Electrolyte Mixes Market Revenue (Million), by Country 2024 & 2032
- Figure 3: North America Electrolyte Mixes Market Revenue Share (%), by Country 2024 & 2032
- Figure 4: Europe Electrolyte Mixes Market Revenue (Million), by Country 2024 & 2032
- Figure 5: Europe Electrolyte Mixes Market Revenue Share (%), by Country 2024 & 2032
- Figure 6: Asia Pacific Electrolyte Mixes Market Revenue (Million), by Country 2024 & 2032
- Figure 7: Asia Pacific Electrolyte Mixes Market Revenue Share (%), by Country 2024 & 2032
- Figure 8: South America Electrolyte Mixes Market Revenue (Million), by Country 2024 & 2032
- Figure 9: South America Electrolyte Mixes Market Revenue Share (%), by Country 2024 & 2032
- Figure 10: Middle East and Africa Electrolyte Mixes Market Revenue (Million), by Country 2024 & 2032
- Figure 11: Middle East and Africa Electrolyte Mixes Market Revenue Share (%), by Country 2024 & 2032
- Figure 12: North America Electrolyte Mixes Market Revenue (Million), by Product Type 2024 & 2032
- Figure 13: North America Electrolyte Mixes Market Revenue Share (%), by Product Type 2024 & 2032
- Figure 14: North America Electrolyte Mixes Market Revenue (Million), by Flavor 2024 & 2032
- Figure 15: North America Electrolyte Mixes Market Revenue Share (%), by Flavor 2024 & 2032
- Figure 16: North America Electrolyte Mixes Market Revenue (Million), by Distribution Channel 2024 & 2032
- Figure 17: North America Electrolyte Mixes Market Revenue Share (%), by Distribution Channel 2024 & 2032
- Figure 18: North America Electrolyte Mixes Market Revenue (Million), by Country 2024 & 2032
- Figure 19: North America Electrolyte Mixes Market Revenue Share (%), by Country 2024 & 2032
- Figure 20: Europe Electrolyte Mixes Market Revenue (Million), by Product Type 2024 & 2032
- Figure 21: Europe Electrolyte Mixes Market Revenue Share (%), by Product Type 2024 & 2032
- Figure 22: Europe Electrolyte Mixes Market Revenue (Million), by Flavor 2024 & 2032
- Figure 23: Europe Electrolyte Mixes Market Revenue Share (%), by Flavor 2024 & 2032
- Figure 24: Europe Electrolyte Mixes Market Revenue (Million), by Distribution Channel 2024 & 2032
- Figure 25: Europe Electrolyte Mixes Market Revenue Share (%), by Distribution Channel 2024 & 2032
- Figure 26: Europe Electrolyte Mixes Market Revenue (Million), by Country 2024 & 2032
- Figure 27: Europe Electrolyte Mixes Market Revenue Share (%), by Country 2024 & 2032
- Figure 28: Asia Pacific Electrolyte Mixes Market Revenue (Million), by Product Type 2024 & 2032
- Figure 29: Asia Pacific Electrolyte Mixes Market Revenue Share (%), by Product Type 2024 & 2032
- Figure 30: Asia Pacific Electrolyte Mixes Market Revenue (Million), by Flavor 2024 & 2032
- Figure 31: Asia Pacific Electrolyte Mixes Market Revenue Share (%), by Flavor 2024 & 2032
- Figure 32: Asia Pacific Electrolyte Mixes Market Revenue (Million), by Distribution Channel 2024 & 2032
- Figure 33: Asia Pacific Electrolyte Mixes Market Revenue Share (%), by Distribution Channel 2024 & 2032
- Figure 34: Asia Pacific Electrolyte Mixes Market Revenue (Million), by Country 2024 & 2032
- Figure 35: Asia Pacific Electrolyte Mixes Market Revenue Share (%), by Country 2024 & 2032
- Figure 36: South America Electrolyte Mixes Market Revenue (Million), by Product Type 2024 & 2032
- Figure 37: South America Electrolyte Mixes Market Revenue Share (%), by Product Type 2024 & 2032
- Figure 38: South America Electrolyte Mixes Market Revenue (Million), by Flavor 2024 & 2032
- Figure 39: South America Electrolyte Mixes Market Revenue Share (%), by Flavor 2024 & 2032
- Figure 40: South America Electrolyte Mixes Market Revenue (Million), by Distribution Channel 2024 & 2032
- Figure 41: South America Electrolyte Mixes Market Revenue Share (%), by Distribution Channel 2024 & 2032
- Figure 42: South America Electrolyte Mixes Market Revenue (Million), by Country 2024 & 2032
- Figure 43: South America Electrolyte Mixes Market Revenue Share (%), by Country 2024 & 2032
- Figure 44: Middle East and Africa Electrolyte Mixes Market Revenue (Million), by Product Type 2024 & 2032
- Figure 45: Middle East and Africa Electrolyte Mixes Market Revenue Share (%), by Product Type 2024 & 2032
- Figure 46: Middle East and Africa Electrolyte Mixes Market Revenue (Million), by Flavor 2024 & 2032
- Figure 47: Middle East and Africa Electrolyte Mixes Market Revenue Share (%), by Flavor 2024 & 2032
- Figure 48: Middle East and Africa Electrolyte Mixes Market Revenue (Million), by Distribution Channel 2024 & 2032
- Figure 49: Middle East and Africa Electrolyte Mixes Market Revenue Share (%), by Distribution Channel 2024 & 2032
- Figure 50: Middle East and Africa Electrolyte Mixes Market Revenue (Million), by Country 2024 & 2032
- Figure 51: Middle East and Africa Electrolyte Mixes Market Revenue Share (%), by Country 2024 & 2032
List of Tables
- Table 1: Global Electrolyte Mixes Market Revenue Million Forecast, by Region 2019 & 2032
- Table 2: Global Electrolyte Mixes Market Revenue Million Forecast, by Product Type 2019 & 2032
- Table 3: Global Electrolyte Mixes Market Revenue Million Forecast, by Flavor 2019 & 2032
- Table 4: Global Electrolyte Mixes Market Revenue Million Forecast, by Distribution Channel 2019 & 2032
- Table 5: Global Electrolyte Mixes Market Revenue Million Forecast, by Region 2019 & 2032
- Table 6: Global Electrolyte Mixes Market Revenue Million Forecast, by Country 2019 & 2032
- Table 7: United States Electrolyte Mixes Market Revenue (Million) Forecast, by Application 2019 & 2032
- Table 8: Canada Electrolyte Mixes Market Revenue (Million) Forecast, by Application 2019 & 2032
- Table 9: Mexico Electrolyte Mixes Market Revenue (Million) Forecast, by Application 2019 & 2032
- Table 10: Rest of North America Electrolyte Mixes Market Revenue (Million) Forecast, by Application 2019 & 2032
- Table 11: Global Electrolyte Mixes Market Revenue Million Forecast, by Country 2019 & 2032
- Table 12: United Kingdom Electrolyte Mixes Market Revenue (Million) Forecast, by Application 2019 & 2032
- Table 13: Germany Electrolyte Mixes Market Revenue (Million) Forecast, by Application 2019 & 2032
- Table 14: France Electrolyte Mixes Market Revenue (Million) Forecast, by Application 2019 & 2032
- Table 15: Russia Electrolyte Mixes Market Revenue (Million) Forecast, by Application 2019 & 2032
- Table 16: Italy Electrolyte Mixes Market Revenue (Million) Forecast, by Application 2019 & 2032
- Table 17: Spain Electrolyte Mixes Market Revenue (Million) Forecast, by Application 2019 & 2032
- Table 18: Rest of Europe Electrolyte Mixes Market Revenue (Million) Forecast, by Application 2019 & 2032
- Table 19: Global Electrolyte Mixes Market Revenue Million Forecast, by Country 2019 & 2032
- Table 20: China Electrolyte Mixes Market Revenue (Million) Forecast, by Application 2019 & 2032
- Table 21: India Electrolyte Mixes Market Revenue (Million) Forecast, by Application 2019 & 2032
- Table 22: Japan Electrolyte Mixes Market Revenue (Million) Forecast, by Application 2019 & 2032
- Table 23: Australia Electrolyte Mixes Market Revenue (Million) Forecast, by Application 2019 & 2032
- Table 24: Rest of Asia Pacific Electrolyte Mixes Market Revenue (Million) Forecast, by Application 2019 & 2032
- Table 25: Global Electrolyte Mixes Market Revenue Million Forecast, by Country 2019 & 2032
- Table 26: Brazil Electrolyte Mixes Market Revenue (Million) Forecast, by Application 2019 & 2032
- Table 27: Argentina Electrolyte Mixes Market Revenue (Million) Forecast, by Application 2019 & 2032
- Table 28: Rest of South America Electrolyte Mixes Market Revenue (Million) Forecast, by Application 2019 & 2032
- Table 29: Global Electrolyte Mixes Market Revenue Million Forecast, by Country 2019 & 2032
- Table 30: South Africa Electrolyte Mixes Market Revenue (Million) Forecast, by Application 2019 & 2032
- Table 31: United Arab Emirates Electrolyte Mixes Market Revenue (Million) Forecast, by Application 2019 & 2032
- Table 32: Rest of Middle East and Africa Electrolyte Mixes Market Revenue (Million) Forecast, by Application 2019 & 2032
- Table 33: Global Electrolyte Mixes Market Revenue Million Forecast, by Product Type 2019 & 2032
- Table 34: Global Electrolyte Mixes Market Revenue Million Forecast, by Flavor 2019 & 2032
- Table 35: Global Electrolyte Mixes Market Revenue Million Forecast, by Distribution Channel 2019 & 2032
- Table 36: Global Electrolyte Mixes Market Revenue Million Forecast, by Country 2019 & 2032
- Table 37: United States Electrolyte Mixes Market Revenue (Million) Forecast, by Application 2019 & 2032
- Table 38: Canada Electrolyte Mixes Market Revenue (Million) Forecast, by Application 2019 & 2032
- Table 39: Mexico Electrolyte Mixes Market Revenue (Million) Forecast, by Application 2019 & 2032
- Table 40: Rest of North America Electrolyte Mixes Market Revenue (Million) Forecast, by Application 2019 & 2032
- Table 41: Global Electrolyte Mixes Market Revenue Million Forecast, by Product Type 2019 & 2032
- Table 42: Global Electrolyte Mixes Market Revenue Million Forecast, by Flavor 2019 & 2032
- Table 43: Global Electrolyte Mixes Market Revenue Million Forecast, by Distribution Channel 2019 & 2032
- Table 44: Global Electrolyte Mixes Market Revenue Million Forecast, by Country 2019 & 2032
- Table 45: United Kingdom Electrolyte Mixes Market Revenue (Million) Forecast, by Application 2019 & 2032
- Table 46: Germany Electrolyte Mixes Market Revenue (Million) Forecast, by Application 2019 & 2032
- Table 47: France Electrolyte Mixes Market Revenue (Million) Forecast, by Application 2019 & 2032
- Table 48: Russia Electrolyte Mixes Market Revenue (Million) Forecast, by Application 2019 & 2032
- Table 49: Italy Electrolyte Mixes Market Revenue (Million) Forecast, by Application 2019 & 2032
- Table 50: Spain Electrolyte Mixes Market Revenue (Million) Forecast, by Application 2019 & 2032
- Table 51: Rest of Europe Electrolyte Mixes Market Revenue (Million) Forecast, by Application 2019 & 2032
- Table 52: Global Electrolyte Mixes Market Revenue Million Forecast, by Product Type 2019 & 2032
- Table 53: Global Electrolyte Mixes Market Revenue Million Forecast, by Flavor 2019 & 2032
- Table 54: Global Electrolyte Mixes Market Revenue Million Forecast, by Distribution Channel 2019 & 2032
- Table 55: Global Electrolyte Mixes Market Revenue Million Forecast, by Country 2019 & 2032
- Table 56: China Electrolyte Mixes Market Revenue (Million) Forecast, by Application 2019 & 2032
- Table 57: India Electrolyte Mixes Market Revenue (Million) Forecast, by Application 2019 & 2032
- Table 58: Japan Electrolyte Mixes Market Revenue (Million) Forecast, by Application 2019 & 2032
- Table 59: Australia Electrolyte Mixes Market Revenue (Million) Forecast, by Application 2019 & 2032
- Table 60: Rest of Asia Pacific Electrolyte Mixes Market Revenue (Million) Forecast, by Application 2019 & 2032
- Table 61: Global Electrolyte Mixes Market Revenue Million Forecast, by Product Type 2019 & 2032
- Table 62: Global Electrolyte Mixes Market Revenue Million Forecast, by Flavor 2019 & 2032
- Table 63: Global Electrolyte Mixes Market Revenue Million Forecast, by Distribution Channel 2019 & 2032
- Table 64: Global Electrolyte Mixes Market Revenue Million Forecast, by Country 2019 & 2032
- Table 65: Brazil Electrolyte Mixes Market Revenue (Million) Forecast, by Application 2019 & 2032
- Table 66: Argentina Electrolyte Mixes Market Revenue (Million) Forecast, by Application 2019 & 2032
- Table 67: Rest of South America Electrolyte Mixes Market Revenue (Million) Forecast, by Application 2019 & 2032
- Table 68: Global Electrolyte Mixes Market Revenue Million Forecast, by Product Type 2019 & 2032
- Table 69: Global Electrolyte Mixes Market Revenue Million Forecast, by Flavor 2019 & 2032
- Table 70: Global Electrolyte Mixes Market Revenue Million Forecast, by Distribution Channel 2019 & 2032
- Table 71: Global Electrolyte Mixes Market Revenue Million Forecast, by Country 2019 & 2032
- Table 72: South Africa Electrolyte Mixes Market Revenue (Million) Forecast, by Application 2019 & 2032
- Table 73: United Arab Emirates Electrolyte Mixes Market Revenue (Million) Forecast, by Application 2019 & 2032
- Table 74: Rest of Middle East and Africa Electrolyte Mixes Market Revenue (Million) Forecast, by Application 2019 & 2032
Frequently Asked Questions
1. What is the projected Compound Annual Growth Rate (CAGR) of the Electrolyte Mixes Market?
The projected CAGR is approximately 2.81%.
2. Which companies are prominent players in the Electrolyte Mixes Market?
Key companies in the market include Tailwind Nutrition, Kent Corporation, Nestlé SA, PepsiCo Inc, Unilever PLC, Abbott Laboratories, LyteLine LLC, Otsuka Holdings Co Ltd, Vitalyte Sports Nutrition Inc *List Not Exhaustive, Ultima Health Products Inc.
3. What are the main segments of the Electrolyte Mixes Market?
The market segments include Product Type, Flavor, Distribution Channel.
4. Can you provide details about the market size?
The market size is estimated to be USD 579.65 Million as of 2022.
5. What are some drivers contributing to market growth?
Rising Demand For Ready Meals Food Products to Influence Growth; Increasing Demand for Organic and Vegan Ready-to-Eat food products..
6. What are the notable trends driving market growth?
Surging Interest Among Consumers in Physical Activities. Including Gyms.
7. Are there any restraints impacting market growth?
Rising Concern Over Health Issues Associated with Processed Foods.
8. Can you provide examples of recent developments in the market?
MAY 2022: Liquid IV announced the launch of Hydration Multiplier+ Powdered Probiotic Kombucha, a blendable mixture that contains electrolytes, Liquid IV's BC30 Probiotic, which boasts an impressive 1 billion colony forming units (CFU), and a powdered kombucha. These components together help in boosting gut health.
9. What pricing options are available for accessing the report?
Pricing options include single-user, multi-user, and enterprise licenses priced at USD 4750, USD 5250, and USD 8750 respectively.
10. Is the market size provided in terms of value or volume?
The market size is provided in terms of value, measured in Million.
11. Are there any specific market keywords associated with the report?
Yes, the market keyword associated with the report is "Electrolyte Mixes Market," which aids in identifying and referencing the specific market segment covered.
12. How do I determine which pricing option suits my needs best?
The pricing options vary based on user requirements and access needs. Individual users may opt for single-user licenses, while businesses requiring broader access may choose multi-user or enterprise licenses for cost-effective access to the report.
13. Are there any additional resources or data provided in the Electrolyte Mixes Market report?
While the report offers comprehensive insights, it's advisable to review the specific contents or supplementary materials provided to ascertain if additional resources or data are available.
14. How can I stay updated on further developments or reports in the Electrolyte Mixes Market?
To stay informed about further developments, trends, and reports in the Electrolyte Mixes Market, consider subscribing to industry newsletters, following relevant companies and organizations, or regularly checking reputable industry news sources and publications.
Methodology
Step 1 - Identification of Relevant Samples Size from Population Database


Step 2 - Approaches for Defining Global Market Size (Value, Volume* & Price*)

Note*: In applicable scenarios
Step 3 - Data Sources
Primary Research
- Web Analytics
- Survey Reports
- Research Institute
- Latest Research Reports
- Opinion Leaders
Secondary Research
- Annual Reports
- White Paper
- Latest Press Release
- Industry Association
- Paid Database
- Investor Presentations

Step 4 - Data Triangulation
Involves using different sources of information in order to increase the validity of a study
These sources are likely to be stakeholders in a program - participants, other researchers, program staff, other community members, and so on.
Then we put all data in single framework & apply various statistical tools to find out the dynamic on the market.
During the analysis stage, feedback from the stakeholder groups would be compared to determine areas of agreement as well as areas of divergence


