
Key Insights
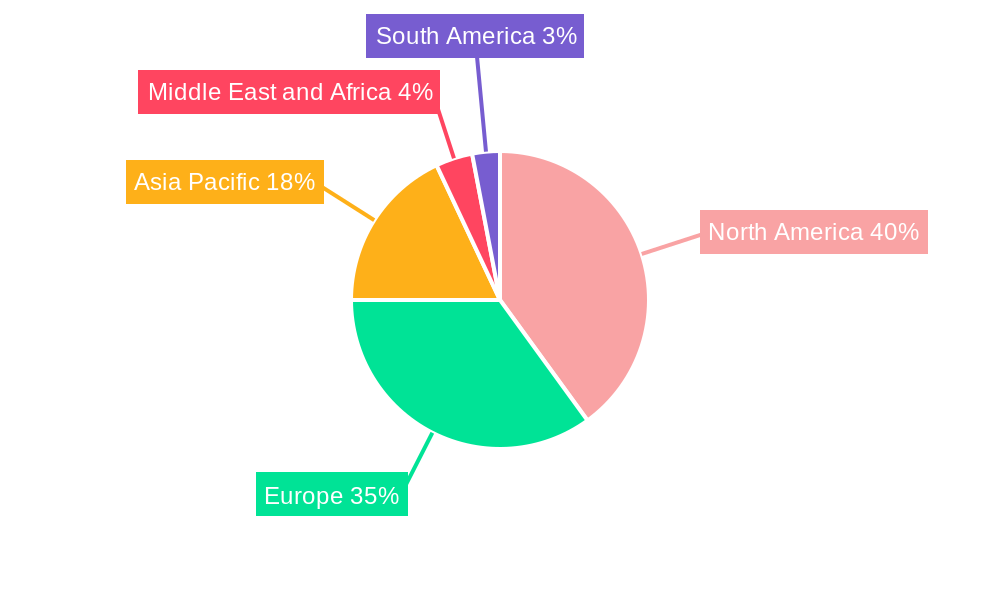
The global electroporation instruments market is experiencing robust growth, driven by the increasing adoption of electroporation techniques in biomedical research, therapeutic delivery, and protein production. The market's expansion is fueled by several factors. Firstly, the rising prevalence of chronic diseases necessitates advanced therapeutic approaches, and electroporation offers a promising method for targeted drug delivery and gene therapy. Secondly, the surge in biomedical research, particularly in areas like gene editing and cell therapy, significantly boosts the demand for precise and efficient electroporation instruments. Thirdly, advancements in instrument technology, such as the development of more efficient and user-friendly devices, are further stimulating market growth. The reagent-based method segment currently holds a larger market share, but instrument-based methods are projected to experience faster growth due to their advantages in terms of automation and throughput. North America and Europe currently dominate the market, owing to well-established research infrastructures and robust healthcare systems. However, the Asia-Pacific region is expected to witness substantial growth in the coming years, propelled by increasing investments in research and development, and a growing awareness of advanced therapeutic modalities.
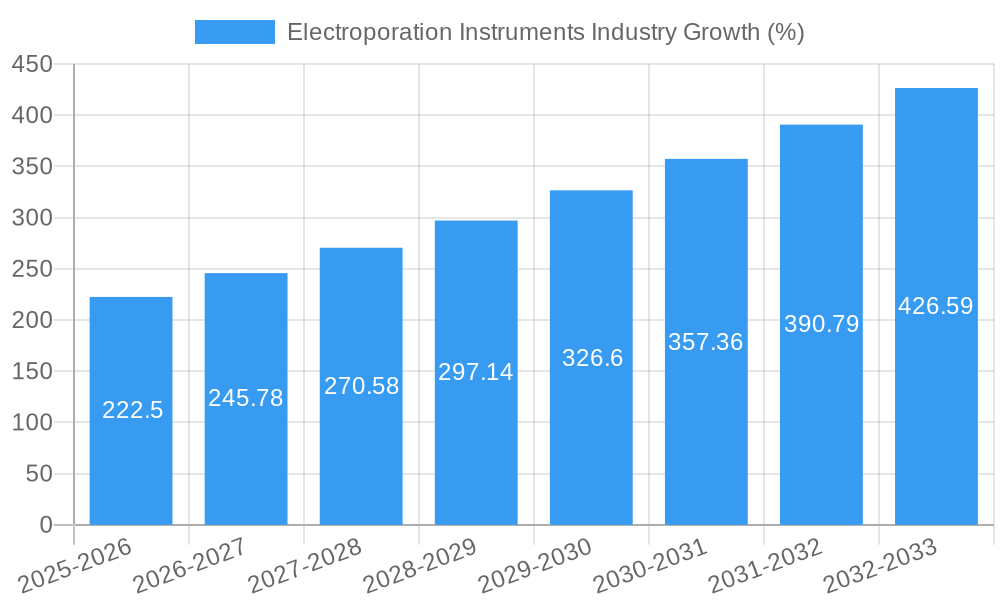
While the market faces restraints such as the high cost of instruments and the need for skilled personnel, the overall positive trends are expected to outweigh these challenges. Competition among key players like Mirus Bio, Promega, Bio-Rad, Merck KGaA, and Thermo Fisher Scientific is driving innovation and pushing prices down, making electroporation technology more accessible to a wider range of researchers and healthcare providers. The market is anticipated to witness consolidation as larger companies acquire smaller players to expand their product portfolio and geographic reach. The continuous development of novel applications, coupled with ongoing technological enhancements, points towards a sustained period of market growth and expansion throughout the forecast period (2025-2033). The projected CAGR of 9.10% indicates a substantial increase in market value over the next decade.
Electroporation Instruments Industry Report: 2019-2033
This comprehensive report provides a detailed analysis of the global electroporation instruments market, offering valuable insights for industry professionals, investors, and researchers. The study period covers 2019-2033, with 2025 as the base and estimated year, and a forecast period of 2025-2033. The report analyzes market size, growth drivers, challenges, key players, and future trends, providing actionable intelligence for strategic decision-making. The market is segmented by method (Reagent-based, Instrument-based, Other Methods) and application (Biomedical Research, Therapeutic Delivery, Protein Production). Expected market value in Millions (USD) is used throughout.

Electroporation Instruments Industry Market Structure & Innovation Trends
The electroporation instruments market exhibits a moderately consolidated structure, with several major players holding significant market share. The top ten companies—Mirus Bio, Promega Corporation, Bio-Rad Laboratories Inc, Merck KGaA, Lonza Group, Altogen Biosystems, Polyplus-transfection SA, SignaGen Laboratories, Qiagen NV, and Thermo Fisher Scientific—account for an estimated xx% of the global market in 2025. Market share distribution is dynamic, influenced by continuous innovation, strategic acquisitions, and evolving regulatory landscapes. Innovation is driven by the demand for higher efficiency, precision, and automation in electroporation techniques. The market is subject to stringent regulatory frameworks governing medical devices and biotechnologies, impacting product approvals and commercialization timelines. The primary substitutes for electroporation instruments are other gene delivery methods like viral transduction and lipid-based transfection, constantly vying for market share. End-user demographics are primarily research institutions, pharmaceutical companies, and biotechnology firms engaged in drug discovery, gene therapy development, and cell-based therapies. M&A activities in the sector have been noteworthy in recent years, with deal values reaching xx Million in the period 2019-2024, further consolidating the market and accelerating innovation.
Electroporation Instruments Industry Market Dynamics & Trends
The electroporation instruments market is experiencing robust growth, driven primarily by the burgeoning fields of gene therapy, cell therapy, and personalized medicine. The global market CAGR is projected at xx% during the forecast period (2025-2033). Technological disruptions, particularly in microfluidics and automation, are significantly impacting market dynamics, leading to the development of more efficient and high-throughput electroporation systems. Consumer preferences are shifting toward automated, user-friendly instruments with improved reproducibility and data analysis capabilities. Competitive dynamics are characterized by intense R&D investments, strategic partnerships, and the continuous introduction of novel products. Market penetration is particularly high in developed economies with advanced research infrastructure and robust funding for life sciences research. The increasing prevalence of chronic diseases and rising demand for effective therapies are further driving the adoption of electroporation instruments across various applications.
Dominant Regions & Segments in Electroporation Instruments Industry
North America currently dominates the electroporation instruments market, followed by Europe and Asia Pacific. The dominance of North America is attributed to a robust biomedical research sector, strong regulatory support for biotechnology, and high healthcare expenditure. Key drivers in North America include substantial funding for R&D, a highly skilled workforce, and a well-established infrastructure for clinical trials.
- Key Drivers of North American Dominance:
- High R&D spending in biotechnology and pharmaceutical sectors.
- Well-developed healthcare infrastructure.
- Stringent yet supportive regulatory environment.
- Early adoption of innovative technologies.
Europe holds a substantial market share due to the presence of numerous research institutions and pharmaceutical companies, as well as a strong focus on cell and gene therapy advancements. The Asia Pacific region is experiencing rapid growth, fueled by increasing healthcare spending, burgeoning pharmaceutical industries, and rising awareness of advanced therapies.
In terms of segments, the instrument-based method holds the largest market share, driven by the increasing demand for high-throughput, automated systems offering better reproducibility and scalability. Biomedical research is the largest application segment due to extensive use of electroporation techniques in various research applications. However, the therapeutic delivery and protein production segments are witnessing significant growth, driven by advances in cell and gene therapy and the development of novel biopharmaceutical products.
Electroporation Instruments Industry Product Innovations
Recent advancements in electroporation technology focus on miniaturization, improved cell viability, and enhanced transfection efficiency. Microfluidic-based electroporation devices are gaining traction, offering precise control over electric field parameters and enabling high-throughput processing. The development of novel pulse waveforms and electrode designs further improves transfection efficiency and reduces cell damage. These innovations cater to the growing demand for precise, efficient, and high-throughput solutions in cell and gene therapy applications and advanced research.
Report Scope & Segmentation Analysis
Method: The report segments the market by method, including Reagent-based, Instrument-based, and Other Methods. The instrument-based method is projected to experience significant growth due to high throughput capabilities. The Reagent-based method is also a significant segment due to its established market presence. Other methods represent a smaller but growing niche.
Application: The market is segmented by application, including Biomedical Research, Therapeutic Delivery, and Protein Production. Biomedical research currently holds the largest market share but Therapeutic Delivery is expected to demonstrate the highest growth rate due to the burgeoning field of gene therapy. Protein production is also a growing application segment. Each segment exhibits unique competitive dynamics and growth projections, detailed within the full report.
Key Drivers of Electroporation Instruments Industry Growth
The growth of the electroporation instruments market is primarily fueled by the rising demand for efficient gene delivery techniques in biotechnology and pharmaceutical research. Advances in gene editing technologies, like CRISPR-Cas9, have further increased the demand for efficient and precise gene delivery methods, driving market expansion. The increasing prevalence of chronic diseases and the development of novel cell and gene therapies are also key growth drivers. Favorable regulatory landscapes in several countries promoting research and development in these areas contribute significantly to market expansion.
Challenges in the Electroporation Instruments Industry Sector
The electroporation instruments industry faces challenges from high manufacturing costs and regulatory complexities associated with medical device approvals. The need for skilled personnel to operate sophisticated instruments can also pose a barrier to entry for smaller companies. Intense competition among established players and the continuous emergence of new technologies contribute to pressure on profit margins. Furthermore, supply chain disruptions and the availability of raw materials can impact production and lead to price fluctuations.
Emerging Opportunities in Electroporation Instruments Industry
Emerging opportunities lie in the development of next-generation electroporation devices with improved efficiency, automation, and miniaturization. The integration of artificial intelligence and machine learning for optimizing electroporation parameters offers significant potential. Expansion into new therapeutic areas, such as oncology and infectious diseases, presents further growth opportunities. Exploring new applications in areas such as personalized medicine and drug delivery further expands the market potential.
Leading Players in the Electroporation Instruments Industry Market
- Mirus Bio
- Promega Corporation
- Bio-Rad Laboratories Inc
- Merck KGaA
- Lonza Group
- Altogen Biosystems
- Polyplus-transfection SA
- SignaGen Laboratories
- Qiagen NV
- Thermo Fisher Scientific
Key Developments in Electroporation Instruments Industry Industry
- September 2022: Polyplus launched the in vivo-jetRNA+ transfection reagent for in vivo mRNA delivery. This expands their mRNA support portfolio and strengthens their position in the cell and gene therapy market.
- February 2022: Mirus Bio launched TransIT-VirusGEN SELECT Transfection Kits for large-scale viral vector production. This caters to the growing demand for efficient viral vector production in cell and gene therapy.
Future Outlook for Electroporation Instruments Industry Market
The future outlook for the electroporation instruments market remains positive, driven by continuous advancements in gene editing technologies, rising demand for cell and gene therapies, and increasing investments in biomedical research. The development of novel electroporation techniques, coupled with the integration of advanced technologies, promises significant growth opportunities. Strategic partnerships and collaborations between industry players and academic institutions will play a crucial role in driving market innovation and expansion. The market is projected to witness robust growth throughout the forecast period, with significant opportunities for established players and new entrants alike.
Electroporation Instruments Industry Segmentation
-
1. Method
- 1.1. Reagent-based Method
- 1.2. Instrument-based Method
- 1.3. Other Methods
-
2. Application
- 2.1. Biomedical Research
- 2.2. Therapeutic Delivery
- 2.3. Protein Production
Electroporation Instruments Industry Segmentation By Geography
-
1. North America
- 1.1. United States
- 1.2. Canada
- 1.3. Mexico
-
2. Europe
- 2.1. Germany
- 2.2. United Kingdom
- 2.3. France
- 2.4. Italy
- 2.5. Spain
- 2.6. Rest of Europe
-
3. Asia Pacific
- 3.1. China
- 3.2. Japan
- 3.3. India
- 3.4. Australia
- 3.5. South Korea
- 3.6. Rest of Asia Pacific
-
4. Middle East and Africa
- 4.1. GCC
- 4.2. South Africa
- 4.3. Rest of Middle East and Africa
-
5. South America
- 5.1. Brazil
- 5.2. Argentina
- 5.3. Rest of South America
Electroporation Instruments Industry REPORT HIGHLIGHTS
| Aspects | Details |
|---|---|
| Study Period | 2019-2033 |
| Base Year | 2024 |
| Estimated Year | 2025 |
| Forecast Period | 2025-2033 |
| Historical Period | 2019-2024 |
| Growth Rate | CAGR of 9.10% from 2019-2033 |
| Segmentation |
|
Table of Contents
- 1. Introduction
- 1.1. Research Scope
- 1.2. Market Segmentation
- 1.3. Research Methodology
- 1.4. Definitions and Assumptions
- 2. Executive Summary
- 2.1. Introduction
- 3. Market Dynamics
- 3.1. Introduction
- 3.2. Market Drivers
- 3.2.1. Rising Incidences of Chronic Diseases; Increase in Research & Development in the Field of Cell Based Therapies
- 3.3. Market Restrains
- 3.3.1. High Cost of Transfection Technology Instruments
- 3.4. Market Trends
- 3.4.1. Reagent-based Method is Showing Significant Growth in the Transfection Technologies Market
- 4. Market Factor Analysis
- 4.1. Porters Five Forces
- 4.2. Supply/Value Chain
- 4.3. PESTEL analysis
- 4.4. Market Entropy
- 4.5. Patent/Trademark Analysis
- 5. Global Electroporation Instruments Industry Analysis, Insights and Forecast, 2019-2031
- 5.1. Market Analysis, Insights and Forecast - by Method
- 5.1.1. Reagent-based Method
- 5.1.2. Instrument-based Method
- 5.1.3. Other Methods
- 5.2. Market Analysis, Insights and Forecast - by Application
- 5.2.1. Biomedical Research
- 5.2.2. Therapeutic Delivery
- 5.2.3. Protein Production
- 5.3. Market Analysis, Insights and Forecast - by Region
- 5.3.1. North America
- 5.3.2. Europe
- 5.3.3. Asia Pacific
- 5.3.4. Middle East and Africa
- 5.3.5. South America
- 5.1. Market Analysis, Insights and Forecast - by Method
- 6. North America Electroporation Instruments Industry Analysis, Insights and Forecast, 2019-2031
- 6.1. Market Analysis, Insights and Forecast - by Method
- 6.1.1. Reagent-based Method
- 6.1.2. Instrument-based Method
- 6.1.3. Other Methods
- 6.2. Market Analysis, Insights and Forecast - by Application
- 6.2.1. Biomedical Research
- 6.2.2. Therapeutic Delivery
- 6.2.3. Protein Production
- 6.1. Market Analysis, Insights and Forecast - by Method
- 7. Europe Electroporation Instruments Industry Analysis, Insights and Forecast, 2019-2031
- 7.1. Market Analysis, Insights and Forecast - by Method
- 7.1.1. Reagent-based Method
- 7.1.2. Instrument-based Method
- 7.1.3. Other Methods
- 7.2. Market Analysis, Insights and Forecast - by Application
- 7.2.1. Biomedical Research
- 7.2.2. Therapeutic Delivery
- 7.2.3. Protein Production
- 7.1. Market Analysis, Insights and Forecast - by Method
- 8. Asia Pacific Electroporation Instruments Industry Analysis, Insights and Forecast, 2019-2031
- 8.1. Market Analysis, Insights and Forecast - by Method
- 8.1.1. Reagent-based Method
- 8.1.2. Instrument-based Method
- 8.1.3. Other Methods
- 8.2. Market Analysis, Insights and Forecast - by Application
- 8.2.1. Biomedical Research
- 8.2.2. Therapeutic Delivery
- 8.2.3. Protein Production
- 8.1. Market Analysis, Insights and Forecast - by Method
- 9. Middle East and Africa Electroporation Instruments Industry Analysis, Insights and Forecast, 2019-2031
- 9.1. Market Analysis, Insights and Forecast - by Method
- 9.1.1. Reagent-based Method
- 9.1.2. Instrument-based Method
- 9.1.3. Other Methods
- 9.2. Market Analysis, Insights and Forecast - by Application
- 9.2.1. Biomedical Research
- 9.2.2. Therapeutic Delivery
- 9.2.3. Protein Production
- 9.1. Market Analysis, Insights and Forecast - by Method
- 10. South America Electroporation Instruments Industry Analysis, Insights and Forecast, 2019-2031
- 10.1. Market Analysis, Insights and Forecast - by Method
- 10.1.1. Reagent-based Method
- 10.1.2. Instrument-based Method
- 10.1.3. Other Methods
- 10.2. Market Analysis, Insights and Forecast - by Application
- 10.2.1. Biomedical Research
- 10.2.2. Therapeutic Delivery
- 10.2.3. Protein Production
- 10.1. Market Analysis, Insights and Forecast - by Method
- 11. North America Electroporation Instruments Industry Analysis, Insights and Forecast, 2019-2031
- 11.1. Market Analysis, Insights and Forecast - By Country/Sub-region
- 11.1.1. undefined
- 12. Europe Electroporation Instruments Industry Analysis, Insights and Forecast, 2019-2031
- 12.1. Market Analysis, Insights and Forecast - By Country/Sub-region
- 12.1.1. undefined
- 13. Asia Pacific Electroporation Instruments Industry Analysis, Insights and Forecast, 2019-2031
- 13.1. Market Analysis, Insights and Forecast - By Country/Sub-region
- 13.1.1. undefined
- 14. Middle East and Africa Electroporation Instruments Industry Analysis, Insights and Forecast, 2019-2031
- 14.1. Market Analysis, Insights and Forecast - By Country/Sub-region
- 14.1.1. undefined
- 15. South America Electroporation Instruments Industry Analysis, Insights and Forecast, 2019-2031
- 15.1. Market Analysis, Insights and Forecast - By Country/Sub-region
- 15.1.1. undefined
- 16. Competitive Analysis
- 16.1. Global Market Share Analysis 2024
- 16.2. Company Profiles
- 16.2.1 Mirus Bio
- 16.2.1.1. Overview
- 16.2.1.2. Products
- 16.2.1.3. SWOT Analysis
- 16.2.1.4. Recent Developments
- 16.2.1.5. Financials (Based on Availability)
- 16.2.2 Promega Corporation
- 16.2.2.1. Overview
- 16.2.2.2. Products
- 16.2.2.3. SWOT Analysis
- 16.2.2.4. Recent Developments
- 16.2.2.5. Financials (Based on Availability)
- 16.2.3 Bio-Rad Laboratories Inc
- 16.2.3.1. Overview
- 16.2.3.2. Products
- 16.2.3.3. SWOT Analysis
- 16.2.3.4. Recent Developments
- 16.2.3.5. Financials (Based on Availability)
- 16.2.4 Merck KGaA
- 16.2.4.1. Overview
- 16.2.4.2. Products
- 16.2.4.3. SWOT Analysis
- 16.2.4.4. Recent Developments
- 16.2.4.5. Financials (Based on Availability)
- 16.2.5 Lonza Group
- 16.2.5.1. Overview
- 16.2.5.2. Products
- 16.2.5.3. SWOT Analysis
- 16.2.5.4. Recent Developments
- 16.2.5.5. Financials (Based on Availability)
- 16.2.6 Altogen Biosystems
- 16.2.6.1. Overview
- 16.2.6.2. Products
- 16.2.6.3. SWOT Analysis
- 16.2.6.4. Recent Developments
- 16.2.6.5. Financials (Based on Availability)
- 16.2.7 Polyplus-transfection SA
- 16.2.7.1. Overview
- 16.2.7.2. Products
- 16.2.7.3. SWOT Analysis
- 16.2.7.4. Recent Developments
- 16.2.7.5. Financials (Based on Availability)
- 16.2.8 SignaGen Laboratories
- 16.2.8.1. Overview
- 16.2.8.2. Products
- 16.2.8.3. SWOT Analysis
- 16.2.8.4. Recent Developments
- 16.2.8.5. Financials (Based on Availability)
- 16.2.9 Qiagen NV
- 16.2.9.1. Overview
- 16.2.9.2. Products
- 16.2.9.3. SWOT Analysis
- 16.2.9.4. Recent Developments
- 16.2.9.5. Financials (Based on Availability)
- 16.2.10 Thermo Fisher Scientific
- 16.2.10.1. Overview
- 16.2.10.2. Products
- 16.2.10.3. SWOT Analysis
- 16.2.10.4. Recent Developments
- 16.2.10.5. Financials (Based on Availability)
- 16.2.1 Mirus Bio
List of Figures
- Figure 1: Global Electroporation Instruments Industry Revenue Breakdown (Million, %) by Region 2024 & 2032
- Figure 2: Global Electroporation Instruments Industry Volume Breakdown (K Unit, %) by Region 2024 & 2032
- Figure 3: North America Electroporation Instruments Industry Revenue (Million), by Country 2024 & 2032
- Figure 4: North America Electroporation Instruments Industry Volume (K Unit), by Country 2024 & 2032
- Figure 5: North America Electroporation Instruments Industry Revenue Share (%), by Country 2024 & 2032
- Figure 6: North America Electroporation Instruments Industry Volume Share (%), by Country 2024 & 2032
- Figure 7: Europe Electroporation Instruments Industry Revenue (Million), by Country 2024 & 2032
- Figure 8: Europe Electroporation Instruments Industry Volume (K Unit), by Country 2024 & 2032
- Figure 9: Europe Electroporation Instruments Industry Revenue Share (%), by Country 2024 & 2032
- Figure 10: Europe Electroporation Instruments Industry Volume Share (%), by Country 2024 & 2032
- Figure 11: Asia Pacific Electroporation Instruments Industry Revenue (Million), by Country 2024 & 2032
- Figure 12: Asia Pacific Electroporation Instruments Industry Volume (K Unit), by Country 2024 & 2032
- Figure 13: Asia Pacific Electroporation Instruments Industry Revenue Share (%), by Country 2024 & 2032
- Figure 14: Asia Pacific Electroporation Instruments Industry Volume Share (%), by Country 2024 & 2032
- Figure 15: Middle East and Africa Electroporation Instruments Industry Revenue (Million), by Country 2024 & 2032
- Figure 16: Middle East and Africa Electroporation Instruments Industry Volume (K Unit), by Country 2024 & 2032
- Figure 17: Middle East and Africa Electroporation Instruments Industry Revenue Share (%), by Country 2024 & 2032
- Figure 18: Middle East and Africa Electroporation Instruments Industry Volume Share (%), by Country 2024 & 2032
- Figure 19: South America Electroporation Instruments Industry Revenue (Million), by Country 2024 & 2032
- Figure 20: South America Electroporation Instruments Industry Volume (K Unit), by Country 2024 & 2032
- Figure 21: South America Electroporation Instruments Industry Revenue Share (%), by Country 2024 & 2032
- Figure 22: South America Electroporation Instruments Industry Volume Share (%), by Country 2024 & 2032
- Figure 23: North America Electroporation Instruments Industry Revenue (Million), by Method 2024 & 2032
- Figure 24: North America Electroporation Instruments Industry Volume (K Unit), by Method 2024 & 2032
- Figure 25: North America Electroporation Instruments Industry Revenue Share (%), by Method 2024 & 2032
- Figure 26: North America Electroporation Instruments Industry Volume Share (%), by Method 2024 & 2032
- Figure 27: North America Electroporation Instruments Industry Revenue (Million), by Application 2024 & 2032
- Figure 28: North America Electroporation Instruments Industry Volume (K Unit), by Application 2024 & 2032
- Figure 29: North America Electroporation Instruments Industry Revenue Share (%), by Application 2024 & 2032
- Figure 30: North America Electroporation Instruments Industry Volume Share (%), by Application 2024 & 2032
- Figure 31: North America Electroporation Instruments Industry Revenue (Million), by Country 2024 & 2032
- Figure 32: North America Electroporation Instruments Industry Volume (K Unit), by Country 2024 & 2032
- Figure 33: North America Electroporation Instruments Industry Revenue Share (%), by Country 2024 & 2032
- Figure 34: North America Electroporation Instruments Industry Volume Share (%), by Country 2024 & 2032
- Figure 35: Europe Electroporation Instruments Industry Revenue (Million), by Method 2024 & 2032
- Figure 36: Europe Electroporation Instruments Industry Volume (K Unit), by Method 2024 & 2032
- Figure 37: Europe Electroporation Instruments Industry Revenue Share (%), by Method 2024 & 2032
- Figure 38: Europe Electroporation Instruments Industry Volume Share (%), by Method 2024 & 2032
- Figure 39: Europe Electroporation Instruments Industry Revenue (Million), by Application 2024 & 2032
- Figure 40: Europe Electroporation Instruments Industry Volume (K Unit), by Application 2024 & 2032
- Figure 41: Europe Electroporation Instruments Industry Revenue Share (%), by Application 2024 & 2032
- Figure 42: Europe Electroporation Instruments Industry Volume Share (%), by Application 2024 & 2032
- Figure 43: Europe Electroporation Instruments Industry Revenue (Million), by Country 2024 & 2032
- Figure 44: Europe Electroporation Instruments Industry Volume (K Unit), by Country 2024 & 2032
- Figure 45: Europe Electroporation Instruments Industry Revenue Share (%), by Country 2024 & 2032
- Figure 46: Europe Electroporation Instruments Industry Volume Share (%), by Country 2024 & 2032
- Figure 47: Asia Pacific Electroporation Instruments Industry Revenue (Million), by Method 2024 & 2032
- Figure 48: Asia Pacific Electroporation Instruments Industry Volume (K Unit), by Method 2024 & 2032
- Figure 49: Asia Pacific Electroporation Instruments Industry Revenue Share (%), by Method 2024 & 2032
- Figure 50: Asia Pacific Electroporation Instruments Industry Volume Share (%), by Method 2024 & 2032
- Figure 51: Asia Pacific Electroporation Instruments Industry Revenue (Million), by Application 2024 & 2032
- Figure 52: Asia Pacific Electroporation Instruments Industry Volume (K Unit), by Application 2024 & 2032
- Figure 53: Asia Pacific Electroporation Instruments Industry Revenue Share (%), by Application 2024 & 2032
- Figure 54: Asia Pacific Electroporation Instruments Industry Volume Share (%), by Application 2024 & 2032
- Figure 55: Asia Pacific Electroporation Instruments Industry Revenue (Million), by Country 2024 & 2032
- Figure 56: Asia Pacific Electroporation Instruments Industry Volume (K Unit), by Country 2024 & 2032
- Figure 57: Asia Pacific Electroporation Instruments Industry Revenue Share (%), by Country 2024 & 2032
- Figure 58: Asia Pacific Electroporation Instruments Industry Volume Share (%), by Country 2024 & 2032
- Figure 59: Middle East and Africa Electroporation Instruments Industry Revenue (Million), by Method 2024 & 2032
- Figure 60: Middle East and Africa Electroporation Instruments Industry Volume (K Unit), by Method 2024 & 2032
- Figure 61: Middle East and Africa Electroporation Instruments Industry Revenue Share (%), by Method 2024 & 2032
- Figure 62: Middle East and Africa Electroporation Instruments Industry Volume Share (%), by Method 2024 & 2032
- Figure 63: Middle East and Africa Electroporation Instruments Industry Revenue (Million), by Application 2024 & 2032
- Figure 64: Middle East and Africa Electroporation Instruments Industry Volume (K Unit), by Application 2024 & 2032
- Figure 65: Middle East and Africa Electroporation Instruments Industry Revenue Share (%), by Application 2024 & 2032
- Figure 66: Middle East and Africa Electroporation Instruments Industry Volume Share (%), by Application 2024 & 2032
- Figure 67: Middle East and Africa Electroporation Instruments Industry Revenue (Million), by Country 2024 & 2032
- Figure 68: Middle East and Africa Electroporation Instruments Industry Volume (K Unit), by Country 2024 & 2032
- Figure 69: Middle East and Africa Electroporation Instruments Industry Revenue Share (%), by Country 2024 & 2032
- Figure 70: Middle East and Africa Electroporation Instruments Industry Volume Share (%), by Country 2024 & 2032
- Figure 71: South America Electroporation Instruments Industry Revenue (Million), by Method 2024 & 2032
- Figure 72: South America Electroporation Instruments Industry Volume (K Unit), by Method 2024 & 2032
- Figure 73: South America Electroporation Instruments Industry Revenue Share (%), by Method 2024 & 2032
- Figure 74: South America Electroporation Instruments Industry Volume Share (%), by Method 2024 & 2032
- Figure 75: South America Electroporation Instruments Industry Revenue (Million), by Application 2024 & 2032
- Figure 76: South America Electroporation Instruments Industry Volume (K Unit), by Application 2024 & 2032
- Figure 77: South America Electroporation Instruments Industry Revenue Share (%), by Application 2024 & 2032
- Figure 78: South America Electroporation Instruments Industry Volume Share (%), by Application 2024 & 2032
- Figure 79: South America Electroporation Instruments Industry Revenue (Million), by Country 2024 & 2032
- Figure 80: South America Electroporation Instruments Industry Volume (K Unit), by Country 2024 & 2032
- Figure 81: South America Electroporation Instruments Industry Revenue Share (%), by Country 2024 & 2032
- Figure 82: South America Electroporation Instruments Industry Volume Share (%), by Country 2024 & 2032
List of Tables
- Table 1: Global Electroporation Instruments Industry Revenue Million Forecast, by Region 2019 & 2032
- Table 2: Global Electroporation Instruments Industry Volume K Unit Forecast, by Region 2019 & 2032
- Table 3: Global Electroporation Instruments Industry Revenue Million Forecast, by Method 2019 & 2032
- Table 4: Global Electroporation Instruments Industry Volume K Unit Forecast, by Method 2019 & 2032
- Table 5: Global Electroporation Instruments Industry Revenue Million Forecast, by Application 2019 & 2032
- Table 6: Global Electroporation Instruments Industry Volume K Unit Forecast, by Application 2019 & 2032
- Table 7: Global Electroporation Instruments Industry Revenue Million Forecast, by Region 2019 & 2032
- Table 8: Global Electroporation Instruments Industry Volume K Unit Forecast, by Region 2019 & 2032
- Table 9: Global Electroporation Instruments Industry Revenue Million Forecast, by Country 2019 & 2032
- Table 10: Global Electroporation Instruments Industry Volume K Unit Forecast, by Country 2019 & 2032
- Table 11: Global Electroporation Instruments Industry Revenue Million Forecast, by Country 2019 & 2032
- Table 12: Global Electroporation Instruments Industry Volume K Unit Forecast, by Country 2019 & 2032
- Table 13: Global Electroporation Instruments Industry Revenue Million Forecast, by Country 2019 & 2032
- Table 14: Global Electroporation Instruments Industry Volume K Unit Forecast, by Country 2019 & 2032
- Table 15: Global Electroporation Instruments Industry Revenue Million Forecast, by Country 2019 & 2032
- Table 16: Global Electroporation Instruments Industry Volume K Unit Forecast, by Country 2019 & 2032
- Table 17: Global Electroporation Instruments Industry Revenue Million Forecast, by Country 2019 & 2032
- Table 18: Global Electroporation Instruments Industry Volume K Unit Forecast, by Country 2019 & 2032
- Table 19: Global Electroporation Instruments Industry Revenue Million Forecast, by Method 2019 & 2032
- Table 20: Global Electroporation Instruments Industry Volume K Unit Forecast, by Method 2019 & 2032
- Table 21: Global Electroporation Instruments Industry Revenue Million Forecast, by Application 2019 & 2032
- Table 22: Global Electroporation Instruments Industry Volume K Unit Forecast, by Application 2019 & 2032
- Table 23: Global Electroporation Instruments Industry Revenue Million Forecast, by Country 2019 & 2032
- Table 24: Global Electroporation Instruments Industry Volume K Unit Forecast, by Country 2019 & 2032
- Table 25: United States Electroporation Instruments Industry Revenue (Million) Forecast, by Application 2019 & 2032
- Table 26: United States Electroporation Instruments Industry Volume (K Unit) Forecast, by Application 2019 & 2032
- Table 27: Canada Electroporation Instruments Industry Revenue (Million) Forecast, by Application 2019 & 2032
- Table 28: Canada Electroporation Instruments Industry Volume (K Unit) Forecast, by Application 2019 & 2032
- Table 29: Mexico Electroporation Instruments Industry Revenue (Million) Forecast, by Application 2019 & 2032
- Table 30: Mexico Electroporation Instruments Industry Volume (K Unit) Forecast, by Application 2019 & 2032
- Table 31: Global Electroporation Instruments Industry Revenue Million Forecast, by Method 2019 & 2032
- Table 32: Global Electroporation Instruments Industry Volume K Unit Forecast, by Method 2019 & 2032
- Table 33: Global Electroporation Instruments Industry Revenue Million Forecast, by Application 2019 & 2032
- Table 34: Global Electroporation Instruments Industry Volume K Unit Forecast, by Application 2019 & 2032
- Table 35: Global Electroporation Instruments Industry Revenue Million Forecast, by Country 2019 & 2032
- Table 36: Global Electroporation Instruments Industry Volume K Unit Forecast, by Country 2019 & 2032
- Table 37: Germany Electroporation Instruments Industry Revenue (Million) Forecast, by Application 2019 & 2032
- Table 38: Germany Electroporation Instruments Industry Volume (K Unit) Forecast, by Application 2019 & 2032
- Table 39: United Kingdom Electroporation Instruments Industry Revenue (Million) Forecast, by Application 2019 & 2032
- Table 40: United Kingdom Electroporation Instruments Industry Volume (K Unit) Forecast, by Application 2019 & 2032
- Table 41: France Electroporation Instruments Industry Revenue (Million) Forecast, by Application 2019 & 2032
- Table 42: France Electroporation Instruments Industry Volume (K Unit) Forecast, by Application 2019 & 2032
- Table 43: Italy Electroporation Instruments Industry Revenue (Million) Forecast, by Application 2019 & 2032
- Table 44: Italy Electroporation Instruments Industry Volume (K Unit) Forecast, by Application 2019 & 2032
- Table 45: Spain Electroporation Instruments Industry Revenue (Million) Forecast, by Application 2019 & 2032
- Table 46: Spain Electroporation Instruments Industry Volume (K Unit) Forecast, by Application 2019 & 2032
- Table 47: Rest of Europe Electroporation Instruments Industry Revenue (Million) Forecast, by Application 2019 & 2032
- Table 48: Rest of Europe Electroporation Instruments Industry Volume (K Unit) Forecast, by Application 2019 & 2032
- Table 49: Global Electroporation Instruments Industry Revenue Million Forecast, by Method 2019 & 2032
- Table 50: Global Electroporation Instruments Industry Volume K Unit Forecast, by Method 2019 & 2032
- Table 51: Global Electroporation Instruments Industry Revenue Million Forecast, by Application 2019 & 2032
- Table 52: Global Electroporation Instruments Industry Volume K Unit Forecast, by Application 2019 & 2032
- Table 53: Global Electroporation Instruments Industry Revenue Million Forecast, by Country 2019 & 2032
- Table 54: Global Electroporation Instruments Industry Volume K Unit Forecast, by Country 2019 & 2032
- Table 55: China Electroporation Instruments Industry Revenue (Million) Forecast, by Application 2019 & 2032
- Table 56: China Electroporation Instruments Industry Volume (K Unit) Forecast, by Application 2019 & 2032
- Table 57: Japan Electroporation Instruments Industry Revenue (Million) Forecast, by Application 2019 & 2032
- Table 58: Japan Electroporation Instruments Industry Volume (K Unit) Forecast, by Application 2019 & 2032
- Table 59: India Electroporation Instruments Industry Revenue (Million) Forecast, by Application 2019 & 2032
- Table 60: India Electroporation Instruments Industry Volume (K Unit) Forecast, by Application 2019 & 2032
- Table 61: Australia Electroporation Instruments Industry Revenue (Million) Forecast, by Application 2019 & 2032
- Table 62: Australia Electroporation Instruments Industry Volume (K Unit) Forecast, by Application 2019 & 2032
- Table 63: South Korea Electroporation Instruments Industry Revenue (Million) Forecast, by Application 2019 & 2032
- Table 64: South Korea Electroporation Instruments Industry Volume (K Unit) Forecast, by Application 2019 & 2032
- Table 65: Rest of Asia Pacific Electroporation Instruments Industry Revenue (Million) Forecast, by Application 2019 & 2032
- Table 66: Rest of Asia Pacific Electroporation Instruments Industry Volume (K Unit) Forecast, by Application 2019 & 2032
- Table 67: Global Electroporation Instruments Industry Revenue Million Forecast, by Method 2019 & 2032
- Table 68: Global Electroporation Instruments Industry Volume K Unit Forecast, by Method 2019 & 2032
- Table 69: Global Electroporation Instruments Industry Revenue Million Forecast, by Application 2019 & 2032
- Table 70: Global Electroporation Instruments Industry Volume K Unit Forecast, by Application 2019 & 2032
- Table 71: Global Electroporation Instruments Industry Revenue Million Forecast, by Country 2019 & 2032
- Table 72: Global Electroporation Instruments Industry Volume K Unit Forecast, by Country 2019 & 2032
- Table 73: GCC Electroporation Instruments Industry Revenue (Million) Forecast, by Application 2019 & 2032
- Table 74: GCC Electroporation Instruments Industry Volume (K Unit) Forecast, by Application 2019 & 2032
- Table 75: South Africa Electroporation Instruments Industry Revenue (Million) Forecast, by Application 2019 & 2032
- Table 76: South Africa Electroporation Instruments Industry Volume (K Unit) Forecast, by Application 2019 & 2032
- Table 77: Rest of Middle East and Africa Electroporation Instruments Industry Revenue (Million) Forecast, by Application 2019 & 2032
- Table 78: Rest of Middle East and Africa Electroporation Instruments Industry Volume (K Unit) Forecast, by Application 2019 & 2032
- Table 79: Global Electroporation Instruments Industry Revenue Million Forecast, by Method 2019 & 2032
- Table 80: Global Electroporation Instruments Industry Volume K Unit Forecast, by Method 2019 & 2032
- Table 81: Global Electroporation Instruments Industry Revenue Million Forecast, by Application 2019 & 2032
- Table 82: Global Electroporation Instruments Industry Volume K Unit Forecast, by Application 2019 & 2032
- Table 83: Global Electroporation Instruments Industry Revenue Million Forecast, by Country 2019 & 2032
- Table 84: Global Electroporation Instruments Industry Volume K Unit Forecast, by Country 2019 & 2032
- Table 85: Brazil Electroporation Instruments Industry Revenue (Million) Forecast, by Application 2019 & 2032
- Table 86: Brazil Electroporation Instruments Industry Volume (K Unit) Forecast, by Application 2019 & 2032
- Table 87: Argentina Electroporation Instruments Industry Revenue (Million) Forecast, by Application 2019 & 2032
- Table 88: Argentina Electroporation Instruments Industry Volume (K Unit) Forecast, by Application 2019 & 2032
- Table 89: Rest of South America Electroporation Instruments Industry Revenue (Million) Forecast, by Application 2019 & 2032
- Table 90: Rest of South America Electroporation Instruments Industry Volume (K Unit) Forecast, by Application 2019 & 2032
Frequently Asked Questions
1. What is the projected Compound Annual Growth Rate (CAGR) of the Electroporation Instruments Industry?
The projected CAGR is approximately 9.10%.
2. Which companies are prominent players in the Electroporation Instruments Industry?
Key companies in the market include Mirus Bio, Promega Corporation, Bio-Rad Laboratories Inc, Merck KGaA, Lonza Group, Altogen Biosystems, Polyplus-transfection SA, SignaGen Laboratories, Qiagen NV, Thermo Fisher Scientific.
3. What are the main segments of the Electroporation Instruments Industry?
The market segments include Method, Application.
4. Can you provide details about the market size?
The market size is estimated to be USD XX Million as of 2022.
5. What are some drivers contributing to market growth?
Rising Incidences of Chronic Diseases; Increase in Research & Development in the Field of Cell Based Therapies.
6. What are the notable trends driving market growth?
Reagent-based Method is Showing Significant Growth in the Transfection Technologies Market.
7. Are there any restraints impacting market growth?
High Cost of Transfection Technology Instruments.
8. Can you provide examples of recent developments in the market?
September 2022: Polyplus, a leading upstream solutions provider for advanced biologic and cell and gene therapy production from research to commercial grade, continues to build out the mRNA support portfolio. The team has launched the in vivo-jetRNA+ transfection reagent for in vivo mRNA delivery using a preformed liposome.
9. What pricing options are available for accessing the report?
Pricing options include single-user, multi-user, and enterprise licenses priced at USD 4750, USD 5250, and USD 8750 respectively.
10. Is the market size provided in terms of value or volume?
The market size is provided in terms of value, measured in Million and volume, measured in K Unit.
11. Are there any specific market keywords associated with the report?
Yes, the market keyword associated with the report is "Electroporation Instruments Industry," which aids in identifying and referencing the specific market segment covered.
12. How do I determine which pricing option suits my needs best?
The pricing options vary based on user requirements and access needs. Individual users may opt for single-user licenses, while businesses requiring broader access may choose multi-user or enterprise licenses for cost-effective access to the report.
13. Are there any additional resources or data provided in the Electroporation Instruments Industry report?
While the report offers comprehensive insights, it's advisable to review the specific contents or supplementary materials provided to ascertain if additional resources or data are available.
14. How can I stay updated on further developments or reports in the Electroporation Instruments Industry?
To stay informed about further developments, trends, and reports in the Electroporation Instruments Industry, consider subscribing to industry newsletters, following relevant companies and organizations, or regularly checking reputable industry news sources and publications.
Methodology
Step 1 - Identification of Relevant Samples Size from Population Database


Step 2 - Approaches for Defining Global Market Size (Value, Volume* & Price*)

Note*: In applicable scenarios
Step 3 - Data Sources
Primary Research
- Web Analytics
- Survey Reports
- Research Institute
- Latest Research Reports
- Opinion Leaders
Secondary Research
- Annual Reports
- White Paper
- Latest Press Release
- Industry Association
- Paid Database
- Investor Presentations

Step 4 - Data Triangulation
Involves using different sources of information in order to increase the validity of a study
These sources are likely to be stakeholders in a program - participants, other researchers, program staff, other community members, and so on.
Then we put all data in single framework & apply various statistical tools to find out the dynamic on the market.
During the analysis stage, feedback from the stakeholder groups would be compared to determine areas of agreement as well as areas of divergence


