
Key Insights
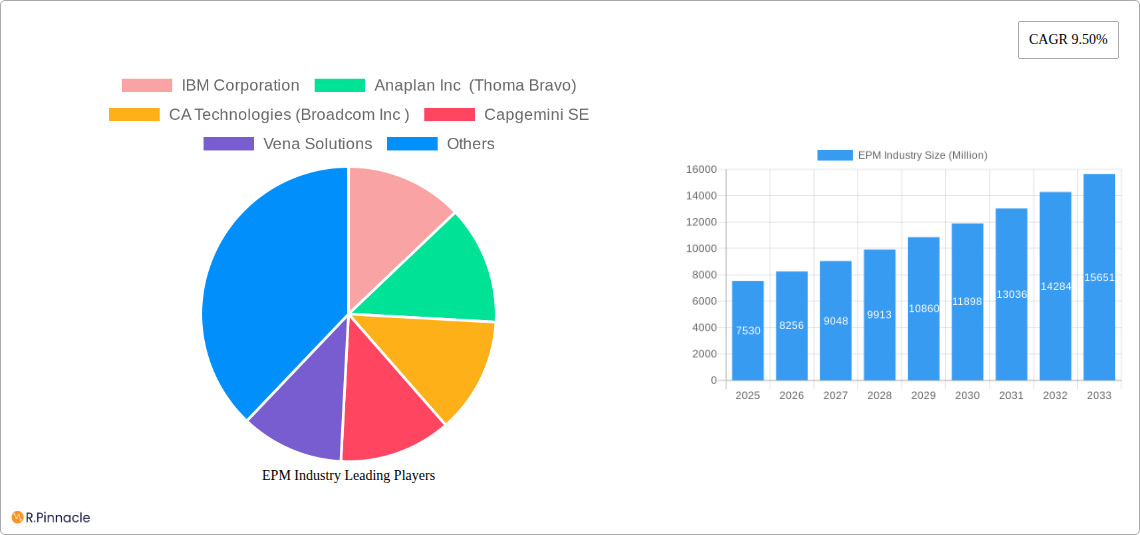
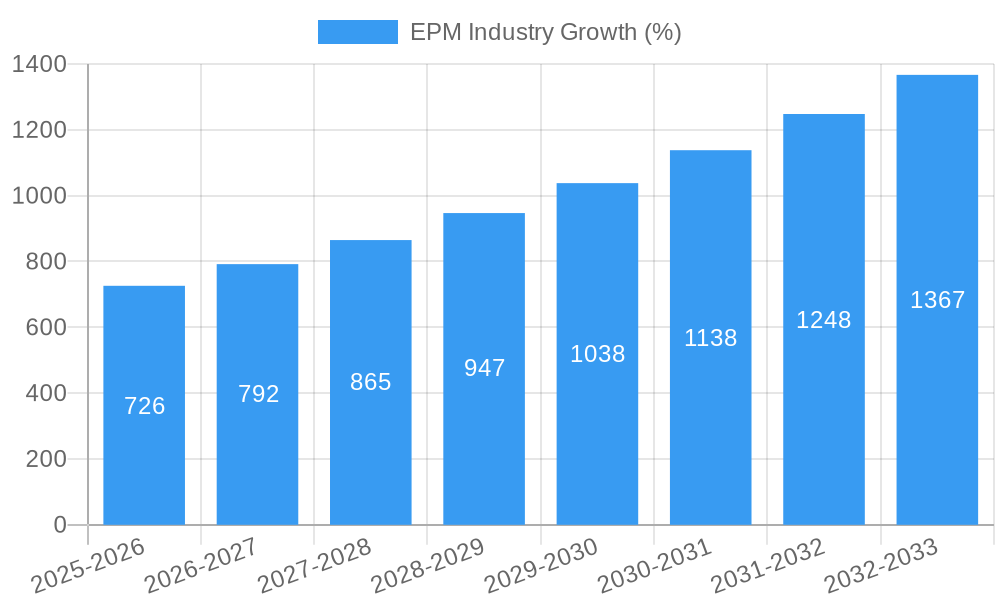
The Enterprise Performance Management (EPM) market is experiencing robust growth, projected to reach a substantial size with a Compound Annual Growth Rate (CAGR) of 9.50% from 2025 to 2033. This expansion is fueled by several key factors. The increasing need for real-time business intelligence and data-driven decision-making across diverse industries is a primary driver. Businesses, particularly large enterprises in sectors like BFSI (Banking, Financial Services, and Insurance), Telecommunications, and Healthcare, are actively adopting EPM solutions to optimize operational efficiency, enhance financial planning and analysis (FP&A), and improve overall performance. The shift towards cloud-based deployment models offers scalability, accessibility, and cost-effectiveness, further accelerating market growth. Furthermore, the rising adoption of advanced analytics and artificial intelligence (AI) within EPM platforms is enabling more sophisticated forecasting, risk management, and scenario planning capabilities, attracting more users.
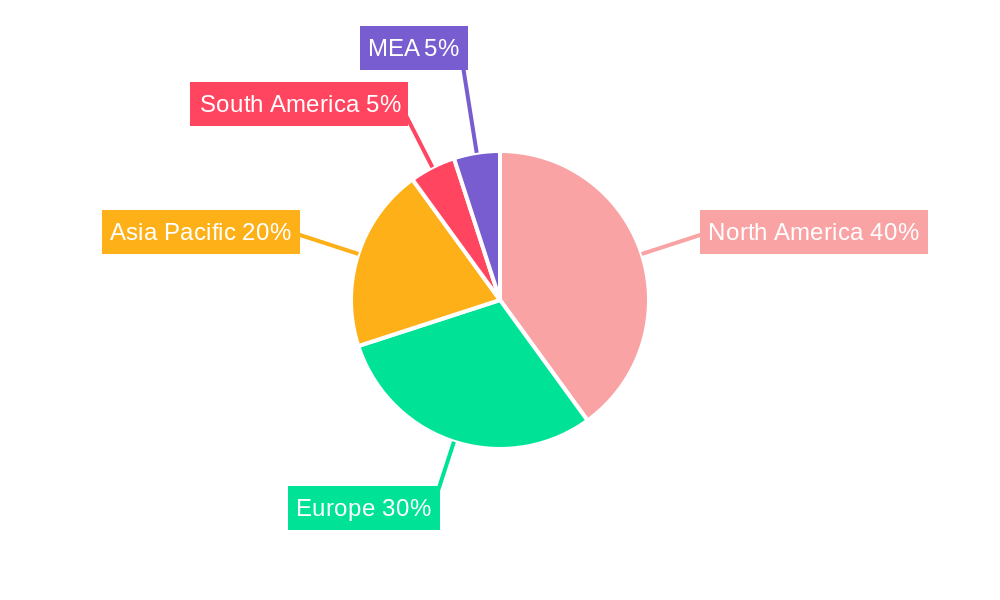
The market segmentation reveals significant opportunities across various deployment models (on-premise and cloud), enterprise sizes (small and medium-sized enterprises (SMEs) and large enterprises), and end-user industries. While North America currently holds a dominant market share, the Asia-Pacific region is expected to witness significant growth in the coming years driven by increasing digital transformation initiatives and economic expansion in key markets like China and India. Competitive landscape analysis indicates a mix of established players like IBM, Oracle, and SAP, alongside emerging technology providers, fostering innovation and competition. However, factors such as the high initial investment costs associated with implementing EPM solutions and the need for specialized expertise to manage and maintain these systems pose challenges to wider adoption. Despite these restraints, the overall market outlook remains positive, with continued growth projected throughout the forecast period.
This comprehensive report provides a detailed analysis of the Enterprise Performance Management (EPM) industry, offering invaluable insights for industry professionals, investors, and strategic decision-makers. We project a market valued at $XX Million in 2025, growing at a CAGR of XX% from 2025 to 2033. The report covers the period 2019-2033, with a focus on the forecast period of 2025-2033 and a base year of 2025.
EPM Industry Market Structure & Innovation Trends
This section analyzes the competitive landscape of the EPM market, encompassing market concentration, innovation drivers, regulatory influences, product substitution dynamics, end-user demographics, and mergers & acquisitions (M&A) activities. We examine the market share held by key players like IBM, Oracle, and SAP, alongside emerging competitors. Our analysis reveals a moderately concentrated market with ongoing consolidation through M&A activities, with total deal values exceeding $XX Million over the historical period.
- Market Concentration: High, with major players holding significant market share.
- Innovation Drivers: Increasing demand for real-time analytics, cloud adoption, and AI integration.
- Regulatory Frameworks: Compliance requirements (e.g., GDPR, SOX) are driving adoption.
- Product Substitutes: Limited, with specialized solutions offering niche functionalities.
- End-User Demographics: Growth across all enterprise sizes, with a strong focus on large enterprises.
- M&A Activity: Significant consolidation, with major players acquiring smaller firms to expand capabilities and market reach. Notable examples include Anaplan's partnership expansion and Thoma Bravo's acquisition of Anaplan.
EPM Industry Market Dynamics & Trends
This section dives deep into the factors driving market growth, technological advancements, shifting consumer preferences, and competitive dynamics within the EPM sector. The industry is experiencing robust growth fueled by the increasing need for advanced analytics and data-driven decision-making across diverse industries.
The transition to cloud-based solutions is a major trend, enhancing accessibility and scalability for businesses of all sizes. The rising adoption of AI and machine learning is revolutionizing EPM capabilities, providing predictive insights and automated processes. Competitive dynamics are characterized by continuous innovation, strategic partnerships, and M&A activities, leading to a dynamic and evolving market landscape.
Dominant Regions & Segments in EPM Industry
This section identifies the leading regions, countries, and segments within the EPM industry. The global nature of the market sees strong growth across various geographical locations, with North America and Europe maintaining leading positions due to high technology adoption and established business infrastructure. Within segments:
- Deployment: Cloud deployment is experiencing rapid growth due to its scalability and cost-effectiveness.
- Enterprise Size: Large enterprises dominate the market, driven by their greater need for sophisticated EPM solutions.
- End-User Industry: BFSI (Banking, Financial Services, and Insurance) and the manufacturing sector are key drivers, followed by the healthcare and telecommunications industries. These sectors require stringent regulatory compliance and robust financial reporting.
EPM Industry Product Innovations
The EPM industry is characterized by continuous product innovation, driven by advancements in cloud computing, AI, and big data analytics. New solutions offer enhanced functionalities such as predictive analytics, integrated business planning, and advanced reporting capabilities. This innovation improves the accuracy and timeliness of financial and operational insights, ultimately leading to better decision-making and improved business outcomes.
Report Scope & Segmentation Analysis
This report comprehensively segments the EPM market across various parameters, providing a granular view of the market size and growth potential for each segment.
- Deployment: On-premise and Cloud. Cloud deployment is projected to show the highest growth.
- Enterprise Size: Small and Medium Enterprises (SMEs) and Large Enterprises. Large Enterprises currently dominate but SMEs are a key growth area.
- End-user Industry: BFSI, Telecommunication, Healthcare, Manufacturing, and Other End-user Industries. Each industry segment exhibits unique growth drivers and adoption patterns.
Key Drivers of EPM Industry Growth
Several factors fuel the growth of the EPM industry. The increasing demand for real-time business intelligence, driven by the need for data-driven decision-making, is a primary driver. The widespread adoption of cloud computing and the integration of advanced analytics and AI are transforming the capabilities of EPM solutions. Further, stringent regulatory compliance requirements and the need for improved operational efficiency are fueling industry growth.
Challenges in the EPM Industry Sector
The EPM industry faces several challenges, including the high cost of implementation and maintenance of sophisticated solutions, the complexity of integrating EPM systems with existing IT infrastructure, and the need for skilled professionals to manage and interpret the data generated by these systems. Furthermore, competitive pressures and evolving regulatory landscapes pose further hurdles to market growth.
Emerging Opportunities in EPM Industry
The EPM market presents several emerging opportunities, driven by the expanding adoption of cloud-based solutions, the increasing integration of artificial intelligence and machine learning, and the growing demand for advanced analytics capabilities. New markets, particularly in developing economies, offer significant potential for growth. Specialized EPM solutions catering to niche industry needs also present lucrative avenues for market expansion.
Leading Players in the EPM Industry Market
- IBM Corporation
- Anaplan Inc (Thoma Bravo)
- CA Technologies (Broadcom Inc)
- Capgemini SE
- Vena Solutions
- Adaptive Insights Inc (Workday Inc)
- Oracle Corporation
- Talentia Software
- Workiva Inc
- HCL Technologies Limited
- SAP SE
Key Developments in EPM Industry
- January 2022: PT Metrodata Electronics Tbk became a regional integration partner of Anaplan, expanding Anaplan's reach in Indonesia.
- April 2022: Oracle Corporation extended support for Hyperion Enterprise Performance Management 11.2 until at least 2033.
Future Outlook for EPM Industry Market
The EPM industry is poised for continued growth, driven by technological advancements, increasing demand for data-driven decision-making, and the expanding adoption of cloud-based solutions. Strategic partnerships and mergers and acquisitions will further shape the market landscape. The integration of AI and machine learning will enhance the capabilities of EPM solutions, providing more accurate and timely insights to businesses. This will lead to improved operational efficiency and better strategic decision-making, driving further growth in the years to come.
EPM Industry Segmentation
-
1. Deployment
- 1.1. On-premise
- 1.2. Cloud
-
2. Size of Enterprise
- 2.1. Small and Medium
- 2.2. Large
-
3. End-user Industry
- 3.1. BFSI
- 3.2. Telecommunication
- 3.3. Healthcare
- 3.4. Manufacturing
- 3.5. Other End -user Industries
EPM Industry Segmentation By Geography
- 1. North America
- 2. Europe
- 3. Asia Pacific
- 4. Rest of World
EPM Industry REPORT HIGHLIGHTS
| Aspects | Details |
|---|---|
| Study Period | 2019-2033 |
| Base Year | 2024 |
| Estimated Year | 2025 |
| Forecast Period | 2025-2033 |
| Historical Period | 2019-2024 |
| Growth Rate | CAGR of 9.50% from 2019-2033 |
| Segmentation |
|
Table of Contents
- 1. Introduction
- 1.1. Research Scope
- 1.2. Market Segmentation
- 1.3. Research Methodology
- 1.4. Definitions and Assumptions
- 2. Executive Summary
- 2.1. Introduction
- 3. Market Dynamics
- 3.1. Introduction
- 3.2. Market Drivers
- 3.2.1. Need for Minimizing Operational Expenses; Proliferation of Data Driven Decision Making
- 3.3. Market Restrains
- 3.3.1. Lack of Awareness and Knowledge Among Enterprises
- 3.4. Market Trends
- 3.4.1. BFSI Sector is Expected to Account for Major Market Share
- 4. Market Factor Analysis
- 4.1. Porters Five Forces
- 4.2. Supply/Value Chain
- 4.3. PESTEL analysis
- 4.4. Market Entropy
- 4.5. Patent/Trademark Analysis
- 5. Global EPM Industry Analysis, Insights and Forecast, 2019-2031
- 5.1. Market Analysis, Insights and Forecast - by Deployment
- 5.1.1. On-premise
- 5.1.2. Cloud
- 5.2. Market Analysis, Insights and Forecast - by Size of Enterprise
- 5.2.1. Small and Medium
- 5.2.2. Large
- 5.3. Market Analysis, Insights and Forecast - by End-user Industry
- 5.3.1. BFSI
- 5.3.2. Telecommunication
- 5.3.3. Healthcare
- 5.3.4. Manufacturing
- 5.3.5. Other End -user Industries
- 5.4. Market Analysis, Insights and Forecast - by Region
- 5.4.1. North America
- 5.4.2. Europe
- 5.4.3. Asia Pacific
- 5.4.4. Rest of World
- 5.1. Market Analysis, Insights and Forecast - by Deployment
- 6. North America EPM Industry Analysis, Insights and Forecast, 2019-2031
- 6.1. Market Analysis, Insights and Forecast - by Deployment
- 6.1.1. On-premise
- 6.1.2. Cloud
- 6.2. Market Analysis, Insights and Forecast - by Size of Enterprise
- 6.2.1. Small and Medium
- 6.2.2. Large
- 6.3. Market Analysis, Insights and Forecast - by End-user Industry
- 6.3.1. BFSI
- 6.3.2. Telecommunication
- 6.3.3. Healthcare
- 6.3.4. Manufacturing
- 6.3.5. Other End -user Industries
- 6.1. Market Analysis, Insights and Forecast - by Deployment
- 7. Europe EPM Industry Analysis, Insights and Forecast, 2019-2031
- 7.1. Market Analysis, Insights and Forecast - by Deployment
- 7.1.1. On-premise
- 7.1.2. Cloud
- 7.2. Market Analysis, Insights and Forecast - by Size of Enterprise
- 7.2.1. Small and Medium
- 7.2.2. Large
- 7.3. Market Analysis, Insights and Forecast - by End-user Industry
- 7.3.1. BFSI
- 7.3.2. Telecommunication
- 7.3.3. Healthcare
- 7.3.4. Manufacturing
- 7.3.5. Other End -user Industries
- 7.1. Market Analysis, Insights and Forecast - by Deployment
- 8. Asia Pacific EPM Industry Analysis, Insights and Forecast, 2019-2031
- 8.1. Market Analysis, Insights and Forecast - by Deployment
- 8.1.1. On-premise
- 8.1.2. Cloud
- 8.2. Market Analysis, Insights and Forecast - by Size of Enterprise
- 8.2.1. Small and Medium
- 8.2.2. Large
- 8.3. Market Analysis, Insights and Forecast - by End-user Industry
- 8.3.1. BFSI
- 8.3.2. Telecommunication
- 8.3.3. Healthcare
- 8.3.4. Manufacturing
- 8.3.5. Other End -user Industries
- 8.1. Market Analysis, Insights and Forecast - by Deployment
- 9. Rest of World EPM Industry Analysis, Insights and Forecast, 2019-2031
- 9.1. Market Analysis, Insights and Forecast - by Deployment
- 9.1.1. On-premise
- 9.1.2. Cloud
- 9.2. Market Analysis, Insights and Forecast - by Size of Enterprise
- 9.2.1. Small and Medium
- 9.2.2. Large
- 9.3. Market Analysis, Insights and Forecast - by End-user Industry
- 9.3.1. BFSI
- 9.3.2. Telecommunication
- 9.3.3. Healthcare
- 9.3.4. Manufacturing
- 9.3.5. Other End -user Industries
- 9.1. Market Analysis, Insights and Forecast - by Deployment
- 10. North America EPM Industry Analysis, Insights and Forecast, 2019-2031
- 10.1. Market Analysis, Insights and Forecast - By Country/Sub-region
- 10.1.1 United States
- 10.1.2 Canada
- 10.1.3 Mexico
- 11. Europe EPM Industry Analysis, Insights and Forecast, 2019-2031
- 11.1. Market Analysis, Insights and Forecast - By Country/Sub-region
- 11.1.1 Germany
- 11.1.2 United Kingdom
- 11.1.3 France
- 11.1.4 Spain
- 11.1.5 Italy
- 11.1.6 Spain
- 11.1.7 Belgium
- 11.1.8 Netherland
- 11.1.9 Nordics
- 11.1.10 Rest of Europe
- 12. Asia Pacific EPM Industry Analysis, Insights and Forecast, 2019-2031
- 12.1. Market Analysis, Insights and Forecast - By Country/Sub-region
- 12.1.1 China
- 12.1.2 Japan
- 12.1.3 India
- 12.1.4 South Korea
- 12.1.5 Southeast Asia
- 12.1.6 Australia
- 12.1.7 Indonesia
- 12.1.8 Phillipes
- 12.1.9 Singapore
- 12.1.10 Thailandc
- 12.1.11 Rest of Asia Pacific
- 13. South America EPM Industry Analysis, Insights and Forecast, 2019-2031
- 13.1. Market Analysis, Insights and Forecast - By Country/Sub-region
- 13.1.1 Brazil
- 13.1.2 Argentina
- 13.1.3 Peru
- 13.1.4 Chile
- 13.1.5 Colombia
- 13.1.6 Ecuador
- 13.1.7 Venezuela
- 13.1.8 Rest of South America
- 14. North America EPM Industry Analysis, Insights and Forecast, 2019-2031
- 14.1. Market Analysis, Insights and Forecast - By Country/Sub-region
- 14.1.1 United States
- 14.1.2 Canada
- 14.1.3 Mexico
- 15. MEA EPM Industry Analysis, Insights and Forecast, 2019-2031
- 15.1. Market Analysis, Insights and Forecast - By Country/Sub-region
- 15.1.1 United Arab Emirates
- 15.1.2 Saudi Arabia
- 15.1.3 South Africa
- 15.1.4 Rest of Middle East and Africa
- 16. Competitive Analysis
- 16.1. Global Market Share Analysis 2024
- 16.2. Company Profiles
- 16.2.1 IBM Corporation
- 16.2.1.1. Overview
- 16.2.1.2. Products
- 16.2.1.3. SWOT Analysis
- 16.2.1.4. Recent Developments
- 16.2.1.5. Financials (Based on Availability)
- 16.2.2 Anaplan Inc (Thoma Bravo)
- 16.2.2.1. Overview
- 16.2.2.2. Products
- 16.2.2.3. SWOT Analysis
- 16.2.2.4. Recent Developments
- 16.2.2.5. Financials (Based on Availability)
- 16.2.3 CA Technologies (Broadcom Inc )
- 16.2.3.1. Overview
- 16.2.3.2. Products
- 16.2.3.3. SWOT Analysis
- 16.2.3.4. Recent Developments
- 16.2.3.5. Financials (Based on Availability)
- 16.2.4 Capgemini SE
- 16.2.4.1. Overview
- 16.2.4.2. Products
- 16.2.4.3. SWOT Analysis
- 16.2.4.4. Recent Developments
- 16.2.4.5. Financials (Based on Availability)
- 16.2.5 Vena Solutions
- 16.2.5.1. Overview
- 16.2.5.2. Products
- 16.2.5.3. SWOT Analysis
- 16.2.5.4. Recent Developments
- 16.2.5.5. Financials (Based on Availability)
- 16.2.6 Adaptive Insights Inc (Workday Inc )
- 16.2.6.1. Overview
- 16.2.6.2. Products
- 16.2.6.3. SWOT Analysis
- 16.2.6.4. Recent Developments
- 16.2.6.5. Financials (Based on Availability)
- 16.2.7 Oracle Corporation
- 16.2.7.1. Overview
- 16.2.7.2. Products
- 16.2.7.3. SWOT Analysis
- 16.2.7.4. Recent Developments
- 16.2.7.5. Financials (Based on Availability)
- 16.2.8 Talentia Software*List Not Exhaustive
- 16.2.8.1. Overview
- 16.2.8.2. Products
- 16.2.8.3. SWOT Analysis
- 16.2.8.4. Recent Developments
- 16.2.8.5. Financials (Based on Availability)
- 16.2.9 Workiva Inc
- 16.2.9.1. Overview
- 16.2.9.2. Products
- 16.2.9.3. SWOT Analysis
- 16.2.9.4. Recent Developments
- 16.2.9.5. Financials (Based on Availability)
- 16.2.10 HCL Technologies Limited
- 16.2.10.1. Overview
- 16.2.10.2. Products
- 16.2.10.3. SWOT Analysis
- 16.2.10.4. Recent Developments
- 16.2.10.5. Financials (Based on Availability)
- 16.2.11 SAP SE
- 16.2.11.1. Overview
- 16.2.11.2. Products
- 16.2.11.3. SWOT Analysis
- 16.2.11.4. Recent Developments
- 16.2.11.5. Financials (Based on Availability)
- 16.2.1 IBM Corporation
List of Figures
- Figure 1: Global EPM Industry Revenue Breakdown (Million, %) by Region 2024 & 2032
- Figure 2: North America EPM Industry Revenue (Million), by Country 2024 & 2032
- Figure 3: North America EPM Industry Revenue Share (%), by Country 2024 & 2032
- Figure 4: Europe EPM Industry Revenue (Million), by Country 2024 & 2032
- Figure 5: Europe EPM Industry Revenue Share (%), by Country 2024 & 2032
- Figure 6: Asia Pacific EPM Industry Revenue (Million), by Country 2024 & 2032
- Figure 7: Asia Pacific EPM Industry Revenue Share (%), by Country 2024 & 2032
- Figure 8: South America EPM Industry Revenue (Million), by Country 2024 & 2032
- Figure 9: South America EPM Industry Revenue Share (%), by Country 2024 & 2032
- Figure 10: North America EPM Industry Revenue (Million), by Country 2024 & 2032
- Figure 11: North America EPM Industry Revenue Share (%), by Country 2024 & 2032
- Figure 12: MEA EPM Industry Revenue (Million), by Country 2024 & 2032
- Figure 13: MEA EPM Industry Revenue Share (%), by Country 2024 & 2032
- Figure 14: North America EPM Industry Revenue (Million), by Deployment 2024 & 2032
- Figure 15: North America EPM Industry Revenue Share (%), by Deployment 2024 & 2032
- Figure 16: North America EPM Industry Revenue (Million), by Size of Enterprise 2024 & 2032
- Figure 17: North America EPM Industry Revenue Share (%), by Size of Enterprise 2024 & 2032
- Figure 18: North America EPM Industry Revenue (Million), by End-user Industry 2024 & 2032
- Figure 19: North America EPM Industry Revenue Share (%), by End-user Industry 2024 & 2032
- Figure 20: North America EPM Industry Revenue (Million), by Country 2024 & 2032
- Figure 21: North America EPM Industry Revenue Share (%), by Country 2024 & 2032
- Figure 22: Europe EPM Industry Revenue (Million), by Deployment 2024 & 2032
- Figure 23: Europe EPM Industry Revenue Share (%), by Deployment 2024 & 2032
- Figure 24: Europe EPM Industry Revenue (Million), by Size of Enterprise 2024 & 2032
- Figure 25: Europe EPM Industry Revenue Share (%), by Size of Enterprise 2024 & 2032
- Figure 26: Europe EPM Industry Revenue (Million), by End-user Industry 2024 & 2032
- Figure 27: Europe EPM Industry Revenue Share (%), by End-user Industry 2024 & 2032
- Figure 28: Europe EPM Industry Revenue (Million), by Country 2024 & 2032
- Figure 29: Europe EPM Industry Revenue Share (%), by Country 2024 & 2032
- Figure 30: Asia Pacific EPM Industry Revenue (Million), by Deployment 2024 & 2032
- Figure 31: Asia Pacific EPM Industry Revenue Share (%), by Deployment 2024 & 2032
- Figure 32: Asia Pacific EPM Industry Revenue (Million), by Size of Enterprise 2024 & 2032
- Figure 33: Asia Pacific EPM Industry Revenue Share (%), by Size of Enterprise 2024 & 2032
- Figure 34: Asia Pacific EPM Industry Revenue (Million), by End-user Industry 2024 & 2032
- Figure 35: Asia Pacific EPM Industry Revenue Share (%), by End-user Industry 2024 & 2032
- Figure 36: Asia Pacific EPM Industry Revenue (Million), by Country 2024 & 2032
- Figure 37: Asia Pacific EPM Industry Revenue Share (%), by Country 2024 & 2032
- Figure 38: Rest of World EPM Industry Revenue (Million), by Deployment 2024 & 2032
- Figure 39: Rest of World EPM Industry Revenue Share (%), by Deployment 2024 & 2032
- Figure 40: Rest of World EPM Industry Revenue (Million), by Size of Enterprise 2024 & 2032
- Figure 41: Rest of World EPM Industry Revenue Share (%), by Size of Enterprise 2024 & 2032
- Figure 42: Rest of World EPM Industry Revenue (Million), by End-user Industry 2024 & 2032
- Figure 43: Rest of World EPM Industry Revenue Share (%), by End-user Industry 2024 & 2032
- Figure 44: Rest of World EPM Industry Revenue (Million), by Country 2024 & 2032
- Figure 45: Rest of World EPM Industry Revenue Share (%), by Country 2024 & 2032
List of Tables
- Table 1: Global EPM Industry Revenue Million Forecast, by Region 2019 & 2032
- Table 2: Global EPM Industry Revenue Million Forecast, by Deployment 2019 & 2032
- Table 3: Global EPM Industry Revenue Million Forecast, by Size of Enterprise 2019 & 2032
- Table 4: Global EPM Industry Revenue Million Forecast, by End-user Industry 2019 & 2032
- Table 5: Global EPM Industry Revenue Million Forecast, by Region 2019 & 2032
- Table 6: Global EPM Industry Revenue Million Forecast, by Country 2019 & 2032
- Table 7: United States EPM Industry Revenue (Million) Forecast, by Application 2019 & 2032
- Table 8: Canada EPM Industry Revenue (Million) Forecast, by Application 2019 & 2032
- Table 9: Mexico EPM Industry Revenue (Million) Forecast, by Application 2019 & 2032
- Table 10: Global EPM Industry Revenue Million Forecast, by Country 2019 & 2032
- Table 11: Germany EPM Industry Revenue (Million) Forecast, by Application 2019 & 2032
- Table 12: United Kingdom EPM Industry Revenue (Million) Forecast, by Application 2019 & 2032
- Table 13: France EPM Industry Revenue (Million) Forecast, by Application 2019 & 2032
- Table 14: Spain EPM Industry Revenue (Million) Forecast, by Application 2019 & 2032
- Table 15: Italy EPM Industry Revenue (Million) Forecast, by Application 2019 & 2032
- Table 16: Spain EPM Industry Revenue (Million) Forecast, by Application 2019 & 2032
- Table 17: Belgium EPM Industry Revenue (Million) Forecast, by Application 2019 & 2032
- Table 18: Netherland EPM Industry Revenue (Million) Forecast, by Application 2019 & 2032
- Table 19: Nordics EPM Industry Revenue (Million) Forecast, by Application 2019 & 2032
- Table 20: Rest of Europe EPM Industry Revenue (Million) Forecast, by Application 2019 & 2032
- Table 21: Global EPM Industry Revenue Million Forecast, by Country 2019 & 2032
- Table 22: China EPM Industry Revenue (Million) Forecast, by Application 2019 & 2032
- Table 23: Japan EPM Industry Revenue (Million) Forecast, by Application 2019 & 2032
- Table 24: India EPM Industry Revenue (Million) Forecast, by Application 2019 & 2032
- Table 25: South Korea EPM Industry Revenue (Million) Forecast, by Application 2019 & 2032
- Table 26: Southeast Asia EPM Industry Revenue (Million) Forecast, by Application 2019 & 2032
- Table 27: Australia EPM Industry Revenue (Million) Forecast, by Application 2019 & 2032
- Table 28: Indonesia EPM Industry Revenue (Million) Forecast, by Application 2019 & 2032
- Table 29: Phillipes EPM Industry Revenue (Million) Forecast, by Application 2019 & 2032
- Table 30: Singapore EPM Industry Revenue (Million) Forecast, by Application 2019 & 2032
- Table 31: Thailandc EPM Industry Revenue (Million) Forecast, by Application 2019 & 2032
- Table 32: Rest of Asia Pacific EPM Industry Revenue (Million) Forecast, by Application 2019 & 2032
- Table 33: Global EPM Industry Revenue Million Forecast, by Country 2019 & 2032
- Table 34: Brazil EPM Industry Revenue (Million) Forecast, by Application 2019 & 2032
- Table 35: Argentina EPM Industry Revenue (Million) Forecast, by Application 2019 & 2032
- Table 36: Peru EPM Industry Revenue (Million) Forecast, by Application 2019 & 2032
- Table 37: Chile EPM Industry Revenue (Million) Forecast, by Application 2019 & 2032
- Table 38: Colombia EPM Industry Revenue (Million) Forecast, by Application 2019 & 2032
- Table 39: Ecuador EPM Industry Revenue (Million) Forecast, by Application 2019 & 2032
- Table 40: Venezuela EPM Industry Revenue (Million) Forecast, by Application 2019 & 2032
- Table 41: Rest of South America EPM Industry Revenue (Million) Forecast, by Application 2019 & 2032
- Table 42: Global EPM Industry Revenue Million Forecast, by Country 2019 & 2032
- Table 43: United States EPM Industry Revenue (Million) Forecast, by Application 2019 & 2032
- Table 44: Canada EPM Industry Revenue (Million) Forecast, by Application 2019 & 2032
- Table 45: Mexico EPM Industry Revenue (Million) Forecast, by Application 2019 & 2032
- Table 46: Global EPM Industry Revenue Million Forecast, by Country 2019 & 2032
- Table 47: United Arab Emirates EPM Industry Revenue (Million) Forecast, by Application 2019 & 2032
- Table 48: Saudi Arabia EPM Industry Revenue (Million) Forecast, by Application 2019 & 2032
- Table 49: South Africa EPM Industry Revenue (Million) Forecast, by Application 2019 & 2032
- Table 50: Rest of Middle East and Africa EPM Industry Revenue (Million) Forecast, by Application 2019 & 2032
- Table 51: Global EPM Industry Revenue Million Forecast, by Deployment 2019 & 2032
- Table 52: Global EPM Industry Revenue Million Forecast, by Size of Enterprise 2019 & 2032
- Table 53: Global EPM Industry Revenue Million Forecast, by End-user Industry 2019 & 2032
- Table 54: Global EPM Industry Revenue Million Forecast, by Country 2019 & 2032
- Table 55: Global EPM Industry Revenue Million Forecast, by Deployment 2019 & 2032
- Table 56: Global EPM Industry Revenue Million Forecast, by Size of Enterprise 2019 & 2032
- Table 57: Global EPM Industry Revenue Million Forecast, by End-user Industry 2019 & 2032
- Table 58: Global EPM Industry Revenue Million Forecast, by Country 2019 & 2032
- Table 59: Global EPM Industry Revenue Million Forecast, by Deployment 2019 & 2032
- Table 60: Global EPM Industry Revenue Million Forecast, by Size of Enterprise 2019 & 2032
- Table 61: Global EPM Industry Revenue Million Forecast, by End-user Industry 2019 & 2032
- Table 62: Global EPM Industry Revenue Million Forecast, by Country 2019 & 2032
- Table 63: Global EPM Industry Revenue Million Forecast, by Deployment 2019 & 2032
- Table 64: Global EPM Industry Revenue Million Forecast, by Size of Enterprise 2019 & 2032
- Table 65: Global EPM Industry Revenue Million Forecast, by End-user Industry 2019 & 2032
- Table 66: Global EPM Industry Revenue Million Forecast, by Country 2019 & 2032
Frequently Asked Questions
1. What is the projected Compound Annual Growth Rate (CAGR) of the EPM Industry?
The projected CAGR is approximately 9.50%.
2. Which companies are prominent players in the EPM Industry?
Key companies in the market include IBM Corporation, Anaplan Inc (Thoma Bravo), CA Technologies (Broadcom Inc ), Capgemini SE, Vena Solutions, Adaptive Insights Inc (Workday Inc ), Oracle Corporation, Talentia Software*List Not Exhaustive, Workiva Inc, HCL Technologies Limited, SAP SE.
3. What are the main segments of the EPM Industry?
The market segments include Deployment, Size of Enterprise, End-user Industry.
4. Can you provide details about the market size?
The market size is estimated to be USD 7.53 Million as of 2022.
5. What are some drivers contributing to market growth?
Need for Minimizing Operational Expenses; Proliferation of Data Driven Decision Making.
6. What are the notable trends driving market growth?
BFSI Sector is Expected to Account for Major Market Share.
7. Are there any restraints impacting market growth?
Lack of Awareness and Knowledge Among Enterprises.
8. Can you provide examples of recent developments in the market?
April 2022 - Oracle Corporation extended support for the Hyperion Enterprise Performance Management 11.2, including Oracle Applications Unlimited, through at least 2033. The Oracle Applications covered under the extension include Hyperion, PeopleSoft, Siebel CRM, Oracle E-Business Suite, and others.
9. What pricing options are available for accessing the report?
Pricing options include single-user, multi-user, and enterprise licenses priced at USD 4750, USD 5250, and USD 8750 respectively.
10. Is the market size provided in terms of value or volume?
The market size is provided in terms of value, measured in Million.
11. Are there any specific market keywords associated with the report?
Yes, the market keyword associated with the report is "EPM Industry," which aids in identifying and referencing the specific market segment covered.
12. How do I determine which pricing option suits my needs best?
The pricing options vary based on user requirements and access needs. Individual users may opt for single-user licenses, while businesses requiring broader access may choose multi-user or enterprise licenses for cost-effective access to the report.
13. Are there any additional resources or data provided in the EPM Industry report?
While the report offers comprehensive insights, it's advisable to review the specific contents or supplementary materials provided to ascertain if additional resources or data are available.
14. How can I stay updated on further developments or reports in the EPM Industry?
To stay informed about further developments, trends, and reports in the EPM Industry, consider subscribing to industry newsletters, following relevant companies and organizations, or regularly checking reputable industry news sources and publications.
Methodology
Step 1 - Identification of Relevant Samples Size from Population Database


Step 2 - Approaches for Defining Global Market Size (Value, Volume* & Price*)

Note*: In applicable scenarios
Step 3 - Data Sources
Primary Research
- Web Analytics
- Survey Reports
- Research Institute
- Latest Research Reports
- Opinion Leaders
Secondary Research
- Annual Reports
- White Paper
- Latest Press Release
- Industry Association
- Paid Database
- Investor Presentations

Step 4 - Data Triangulation
Involves using different sources of information in order to increase the validity of a study
These sources are likely to be stakeholders in a program - participants, other researchers, program staff, other community members, and so on.
Then we put all data in single framework & apply various statistical tools to find out the dynamic on the market.
During the analysis stage, feedback from the stakeholder groups would be compared to determine areas of agreement as well as areas of divergence


