
Key Insights
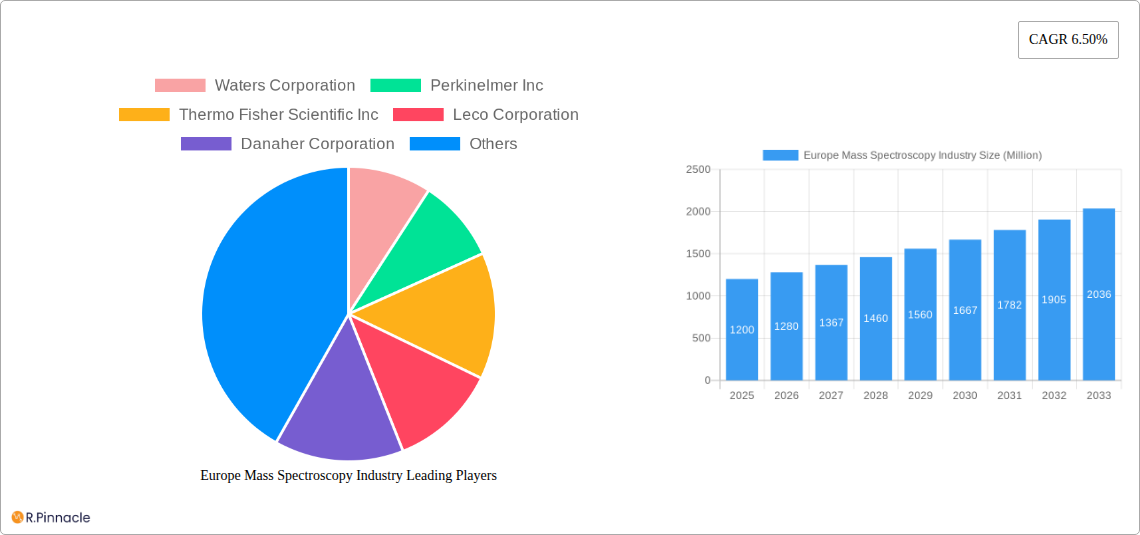
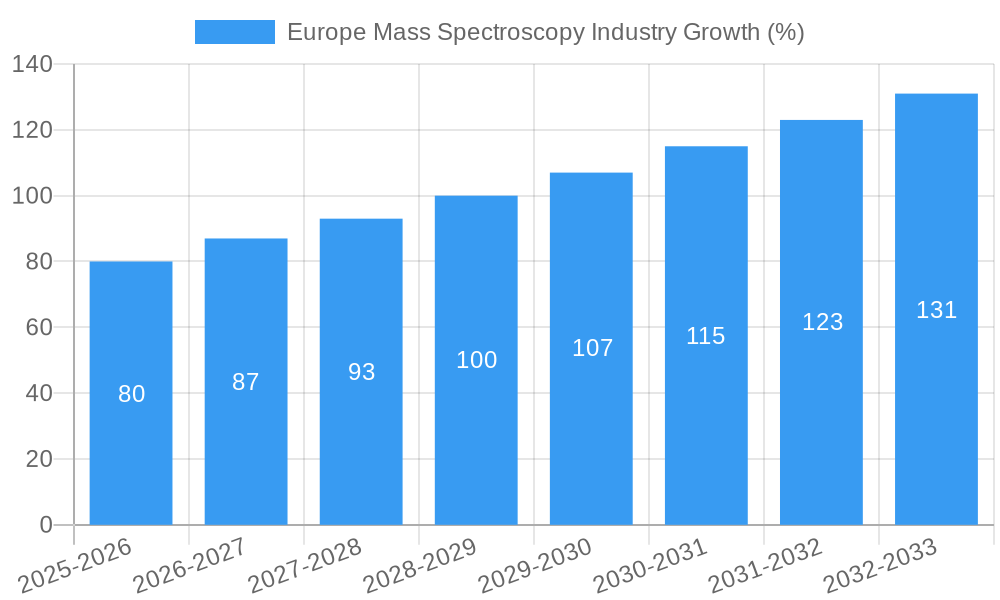
The European mass spectrometry market, valued at approximately €1.2 billion in 2025, is poised for robust growth, exhibiting a Compound Annual Growth Rate (CAGR) of 6.5% from 2025 to 2033. This expansion is driven primarily by the pharmaceutical and biotechnology sectors' increasing reliance on mass spectrometry for drug discovery, development, and quality control. Technological advancements, particularly in high-resolution mass spectrometry techniques like FTMS and advancements in hybrid systems, are further fueling market growth. The rising prevalence of chronic diseases and the consequent demand for advanced diagnostic tools contribute significantly to the market's upward trajectory. Germany, France, and the UK represent the largest national markets within Europe, benefiting from established research infrastructure and a strong presence of key players like Thermo Fisher Scientific, Waters Corporation, and Bruker Corporation. However, the market faces potential restraints, such as high instrument costs and the need for specialized expertise to operate and maintain these sophisticated systems.
Despite these challenges, the market's future remains optimistic. The burgeoning field of proteomics, metabolomics, and other "omics" research areas are creating significant demand for advanced mass spectrometry solutions. Furthermore, the growing adoption of miniaturized and more user-friendly mass spectrometers is expected to broaden the market's reach beyond large research institutions and pharmaceutical companies, encompassing smaller laboratories and clinical settings. This expansion, coupled with ongoing technological innovation and increasing regulatory approvals, will solidify the position of mass spectrometry as an indispensable tool across various scientific disciplines within Europe. The continued investment in R&D by key players and the emergence of new applications in fields like environmental monitoring and food safety further contribute to the positive growth outlook.
Europe Mass Spectroscopy Industry: A Comprehensive Market Report (2019-2033)
This in-depth report provides a comprehensive analysis of the Europe Mass Spectroscopy industry, offering invaluable insights for industry professionals, investors, and strategic decision-makers. We examine market dynamics, segmentation, leading players, and future growth potential, providing actionable intelligence for navigating this dynamic sector. The report covers the period 2019-2033, with a focus on the estimated year 2025 and a forecast period of 2025-2033.
Europe Mass Spectroscopy Industry Market Structure & Innovation Trends
This section analyzes the competitive landscape, encompassing market concentration, innovation drivers, regulatory influences, and market dynamics within the European Mass Spectroscopy industry. We delve into the impact of mergers and acquisitions (M&A) activity on market share and competitive dynamics.
The European Mass Spectrometry market is moderately concentrated, with key players holding significant market share. The estimated market share for the top 5 players in 2025 is approximately 65%, indicating a degree of oligopoly. M&A activity has played a crucial role in shaping the market structure. For example, the xx Million acquisition of Company X by Company Y in 2023 significantly altered market share dynamics. Regulatory frameworks, particularly those related to healthcare and environmental monitoring, heavily influence innovation and market access. Furthermore, the increasing demand for high-throughput screening and advanced analytical techniques drives the adoption of innovative mass spectrometry technologies. The emergence of miniaturized and portable mass spectrometers presents a significant disruption, offering enhanced accessibility and cost-effectiveness.
- Market Concentration: Moderately concentrated, with top 5 players holding ~65% market share in 2025.
- Innovation Drivers: Demand for high-throughput screening, miniaturization, advanced analytical techniques.
- M&A Activity: Significant impact on market share; average deal value estimated at xx Million in 2024.
- Regulatory Frameworks: Stringent regulations impact innovation and market access.
- Product Substitutes: Limited direct substitutes; competition comes from alternative analytical techniques.
Europe Mass Spectroscopy Industry Market Dynamics & Trends
This section explores the factors driving market growth, including technological advancements, evolving consumer preferences, and competitive landscape dynamics within the European Mass Spectrometry market. We examine the Compound Annual Growth Rate (CAGR) and market penetration of key segments.
The European Mass Spectroscopy market is experiencing robust growth, driven by the increasing demand for advanced analytical solutions across various industries. The pharmaceutical and biotechnology sectors are major drivers, fueled by the need for precise and efficient drug discovery and development. Technological disruptions, such as the development of hybrid mass spectrometry systems, are reshaping the market landscape. The market is witnessing a shift towards higher sensitivity, faster analysis times, and improved data processing capabilities. The rising adoption of mass spectrometry in environmental monitoring and food safety testing further contributes to market expansion. The CAGR for the forecast period (2025-2033) is projected to be approximately xx%. Market penetration in key application segments like pharmaceuticals is estimated to reach xx% by 2033. Competitive dynamics are primarily shaped by technological innovation, product differentiation, and strategic partnerships.
Dominant Regions & Segments in Europe Mass Spectroscopy Industry
This section identifies the leading regions, countries, and market segments within the European Mass Spectrometry industry, analyzing the factors driving their dominance.
Leading Region: Germany is projected to be the leading market in Europe, driven by a strong presence of pharmaceutical and biotechnology companies, robust research infrastructure, and government support for scientific research.
Dominant Segments:
- Technology: Hybrid mass spectrometry is the fastest-growing segment, fueled by its versatility and high performance capabilities.
- Application: The pharmaceuticals industry is the dominant application segment due to its high demand for precise drug discovery and development tools.
Key Drivers:
- Germany: Strong pharmaceutical and biotech presence, excellent research infrastructure, government funding.
- Pharmaceuticals: Demand for efficient drug discovery and development, stringent regulatory requirements.
- Hybrid Mass Spectrometry: Versatility, high performance, adaptability to various applications.
The UK and France also hold significant market share, driven by their strong research capabilities and growing investments in the life sciences sector. However, Germany's robust pharmaceutical industry and sophisticated regulatory framework position it as the leading market. The dominance of the pharmaceuticals segment reflects its critical need for advanced analytical tools to ensure drug safety and efficacy.
Europe Mass Spectroscopy Industry Product Innovations
Recent years have witnessed significant advancements in mass spectrometry technology, with a focus on improving sensitivity, speed, and ease of use. Hybrid mass spectrometers, combining different mass analysis techniques, offer enhanced performance for complex sample analysis. The integration of advanced software and data processing capabilities further enhances the value proposition of these instruments. Miniaturization efforts are producing smaller, more portable devices, making mass spectrometry accessible to a wider range of users and applications. This trend aligns with increasing demand for point-of-care diagnostics and field-based analysis.
Report Scope & Segmentation Analysis
This report provides a comprehensive segmentation of the European Mass Spectroscopy market across technology and application.
Technology: Hybrid Mass Spectrometry, FTMS (Fourier Transform Mass Spectrometry), Single Mass Spectrometry, Time-of-flight (TOF), Other Mass Spectrometry. Each segment's growth is influenced by specific technological advancements and market demand. The hybrid mass spectrometry segment is projected to exhibit the highest growth, driven by its versatility.
Application: Pharmaceuticals Industry, Biotechnology Industry, Chemical Industry, Other Applications. The pharmaceuticals industry is the largest segment due to stringent regulatory requirements for drug purity and safety. The biotechnology segment is also rapidly expanding, driven by advancements in proteomics and genomics research.
Growth projections vary across segments, reflecting differing market dynamics and technological trends. Competitive dynamics within each segment are influenced by factors such as technological innovation, product differentiation, and pricing strategies.
Key Drivers of Europe Mass Spectroscopy Industry Growth
The growth of the European mass spectrometry market is propelled by several key factors. Firstly, the increasing demand for advanced analytical techniques across various industries, particularly pharmaceuticals and biotechnology, is a significant driver. Secondly, continuous technological advancements, such as the development of hybrid mass spectrometry systems, are enhancing the capabilities of these instruments, attracting wider adoption. Finally, supportive government regulations and funding for research and development in the life sciences sector are fostering market expansion.
Challenges in the Europe Mass Spectroscopy Industry Sector
The Europe Mass Spectroscopy industry faces several challenges. High instrument costs and specialized maintenance requirements can limit accessibility, especially for smaller laboratories. Furthermore, the complexity of data analysis and the need for skilled personnel present barriers to widespread adoption. Intense competition among established players and the emergence of new technologies further add to the challenges. These factors contribute to a complex market landscape where continuous innovation and strategic adaptations are vital for success.
Emerging Opportunities in Europe Mass Spectroscopy Industry
The European mass spectrometry market presents several promising opportunities. The growing demand for point-of-care diagnostics and environmental monitoring applications is opening new market segments. Furthermore, advancements in miniaturization and portability are making mass spectrometry more accessible to various users and settings. The development of advanced data analysis software and integration with other analytical techniques further expands the potential of this technology. These trends point to significant growth and innovation opportunities in the coming years.
Leading Players in the Europe Mass Spectroscopy Industry Market
- Waters Corporation
- PerkinElmer Inc
- Thermo Fisher Scientific Inc
- Leco Corporation
- Danaher Corporation
- Agilent Technologies Inc
- Dani Instruments SpA
- Bruker Corporation
- Shimadzu Corporation
Key Developments in Europe Mass Spectroscopy Industry
June 2022: Waters Corporation unveiled new instruments, software, and product enhancements to drive drug discovery and development. This launch strengthened their position in the high-growth pharmaceutical segment.
April 2022: Bruker acquired IonSense, expanding their capabilities in ambient ionization and broadening their market reach. This acquisition enhanced Bruker's product portfolio and market competitiveness.
Future Outlook for Europe Mass Spectroscopy Industry Market
The future of the European mass spectrometry market looks promising, driven by sustained growth across various application areas. Continued technological advancements, particularly in miniaturization, higher sensitivity, and ease of use, will drive further adoption. Expanding applications in environmental monitoring, food safety, and point-of-care diagnostics will create significant growth opportunities. Strategic partnerships and collaborations will be key to navigating the competitive landscape and fostering innovation within this dynamic market. The forecast period suggests significant market expansion, indicating attractive investment opportunities and sustained industry growth.
Europe Mass Spectroscopy Industry Segmentation
-
1. Technology
-
1.1. Hybrid Mass Spectrometry
- 1.1.1. Triple Quadrupole (Tandem)
- 1.1.2. Quadrupole TOF (Q-TOF)
- 1.1.3. FTMS (Fourier Transform Mass Spectrometry)
-
1.2. Single Mass Spectrometry
- 1.2.1. ION Trap
- 1.2.2. Time-of-flight (TOF)
- 1.3. Other Mass Spectrometry
-
1.1. Hybrid Mass Spectrometry
-
2. Application
- 2.1. Pharmaceuticals Industry
- 2.2. Biotechnology Industry
- 2.3. Chemical Industry
- 2.4. Other Applications
Europe Mass Spectroscopy Industry Segmentation By Geography
- 1. Germany
- 2. United Kingdom
- 3. France
- 4. Italy
- 5. Spain
- 6. Rest of Europe
Europe Mass Spectroscopy Industry REPORT HIGHLIGHTS
| Aspects | Details |
|---|---|
| Study Period | 2019-2033 |
| Base Year | 2024 |
| Estimated Year | 2025 |
| Forecast Period | 2025-2033 |
| Historical Period | 2019-2024 |
| Growth Rate | CAGR of 6.50% from 2019-2033 |
| Segmentation |
|
Table of Contents
- 1. Introduction
- 1.1. Research Scope
- 1.2. Market Segmentation
- 1.3. Research Methodology
- 1.4. Definitions and Assumptions
- 2. Executive Summary
- 2.1. Introduction
- 3. Market Dynamics
- 3.1. Introduction
- 3.2. Market Drivers
- 3.2.1. Increasing Technological Advancement; Increased Pharmaceutical and Biotechnological Compounds in Pipeline
- 3.3. Market Restrains
- 3.3.1. High Cost of Instrument; Shortage of Skilled Technicians
- 3.4. Market Trends
- 3.4.1. Triple Quadrupole (Tandem Mass Spectrometry Devices) Segment is Expected to Dominate the Market over the Forecast Period
- 4. Market Factor Analysis
- 4.1. Porters Five Forces
- 4.2. Supply/Value Chain
- 4.3. PESTEL analysis
- 4.4. Market Entropy
- 4.5. Patent/Trademark Analysis
- 5. Europe Mass Spectroscopy Industry Analysis, Insights and Forecast, 2019-2031
- 5.1. Market Analysis, Insights and Forecast - by Technology
- 5.1.1. Hybrid Mass Spectrometry
- 5.1.1.1. Triple Quadrupole (Tandem)
- 5.1.1.2. Quadrupole TOF (Q-TOF)
- 5.1.1.3. FTMS (Fourier Transform Mass Spectrometry)
- 5.1.2. Single Mass Spectrometry
- 5.1.2.1. ION Trap
- 5.1.2.2. Time-of-flight (TOF)
- 5.1.3. Other Mass Spectrometry
- 5.1.1. Hybrid Mass Spectrometry
- 5.2. Market Analysis, Insights and Forecast - by Application
- 5.2.1. Pharmaceuticals Industry
- 5.2.2. Biotechnology Industry
- 5.2.3. Chemical Industry
- 5.2.4. Other Applications
- 5.3. Market Analysis, Insights and Forecast - by Region
- 5.3.1. Germany
- 5.3.2. United Kingdom
- 5.3.3. France
- 5.3.4. Italy
- 5.3.5. Spain
- 5.3.6. Rest of Europe
- 5.1. Market Analysis, Insights and Forecast - by Technology
- 6. Germany Europe Mass Spectroscopy Industry Analysis, Insights and Forecast, 2019-2031
- 6.1. Market Analysis, Insights and Forecast - by Technology
- 6.1.1. Hybrid Mass Spectrometry
- 6.1.1.1. Triple Quadrupole (Tandem)
- 6.1.1.2. Quadrupole TOF (Q-TOF)
- 6.1.1.3. FTMS (Fourier Transform Mass Spectrometry)
- 6.1.2. Single Mass Spectrometry
- 6.1.2.1. ION Trap
- 6.1.2.2. Time-of-flight (TOF)
- 6.1.3. Other Mass Spectrometry
- 6.1.1. Hybrid Mass Spectrometry
- 6.2. Market Analysis, Insights and Forecast - by Application
- 6.2.1. Pharmaceuticals Industry
- 6.2.2. Biotechnology Industry
- 6.2.3. Chemical Industry
- 6.2.4. Other Applications
- 6.1. Market Analysis, Insights and Forecast - by Technology
- 7. United Kingdom Europe Mass Spectroscopy Industry Analysis, Insights and Forecast, 2019-2031
- 7.1. Market Analysis, Insights and Forecast - by Technology
- 7.1.1. Hybrid Mass Spectrometry
- 7.1.1.1. Triple Quadrupole (Tandem)
- 7.1.1.2. Quadrupole TOF (Q-TOF)
- 7.1.1.3. FTMS (Fourier Transform Mass Spectrometry)
- 7.1.2. Single Mass Spectrometry
- 7.1.2.1. ION Trap
- 7.1.2.2. Time-of-flight (TOF)
- 7.1.3. Other Mass Spectrometry
- 7.1.1. Hybrid Mass Spectrometry
- 7.2. Market Analysis, Insights and Forecast - by Application
- 7.2.1. Pharmaceuticals Industry
- 7.2.2. Biotechnology Industry
- 7.2.3. Chemical Industry
- 7.2.4. Other Applications
- 7.1. Market Analysis, Insights and Forecast - by Technology
- 8. France Europe Mass Spectroscopy Industry Analysis, Insights and Forecast, 2019-2031
- 8.1. Market Analysis, Insights and Forecast - by Technology
- 8.1.1. Hybrid Mass Spectrometry
- 8.1.1.1. Triple Quadrupole (Tandem)
- 8.1.1.2. Quadrupole TOF (Q-TOF)
- 8.1.1.3. FTMS (Fourier Transform Mass Spectrometry)
- 8.1.2. Single Mass Spectrometry
- 8.1.2.1. ION Trap
- 8.1.2.2. Time-of-flight (TOF)
- 8.1.3. Other Mass Spectrometry
- 8.1.1. Hybrid Mass Spectrometry
- 8.2. Market Analysis, Insights and Forecast - by Application
- 8.2.1. Pharmaceuticals Industry
- 8.2.2. Biotechnology Industry
- 8.2.3. Chemical Industry
- 8.2.4. Other Applications
- 8.1. Market Analysis, Insights and Forecast - by Technology
- 9. Italy Europe Mass Spectroscopy Industry Analysis, Insights and Forecast, 2019-2031
- 9.1. Market Analysis, Insights and Forecast - by Technology
- 9.1.1. Hybrid Mass Spectrometry
- 9.1.1.1. Triple Quadrupole (Tandem)
- 9.1.1.2. Quadrupole TOF (Q-TOF)
- 9.1.1.3. FTMS (Fourier Transform Mass Spectrometry)
- 9.1.2. Single Mass Spectrometry
- 9.1.2.1. ION Trap
- 9.1.2.2. Time-of-flight (TOF)
- 9.1.3. Other Mass Spectrometry
- 9.1.1. Hybrid Mass Spectrometry
- 9.2. Market Analysis, Insights and Forecast - by Application
- 9.2.1. Pharmaceuticals Industry
- 9.2.2. Biotechnology Industry
- 9.2.3. Chemical Industry
- 9.2.4. Other Applications
- 9.1. Market Analysis, Insights and Forecast - by Technology
- 10. Spain Europe Mass Spectroscopy Industry Analysis, Insights and Forecast, 2019-2031
- 10.1. Market Analysis, Insights and Forecast - by Technology
- 10.1.1. Hybrid Mass Spectrometry
- 10.1.1.1. Triple Quadrupole (Tandem)
- 10.1.1.2. Quadrupole TOF (Q-TOF)
- 10.1.1.3. FTMS (Fourier Transform Mass Spectrometry)
- 10.1.2. Single Mass Spectrometry
- 10.1.2.1. ION Trap
- 10.1.2.2. Time-of-flight (TOF)
- 10.1.3. Other Mass Spectrometry
- 10.1.1. Hybrid Mass Spectrometry
- 10.2. Market Analysis, Insights and Forecast - by Application
- 10.2.1. Pharmaceuticals Industry
- 10.2.2. Biotechnology Industry
- 10.2.3. Chemical Industry
- 10.2.4. Other Applications
- 10.1. Market Analysis, Insights and Forecast - by Technology
- 11. Rest of Europe Europe Mass Spectroscopy Industry Analysis, Insights and Forecast, 2019-2031
- 11.1. Market Analysis, Insights and Forecast - by Technology
- 11.1.1. Hybrid Mass Spectrometry
- 11.1.1.1. Triple Quadrupole (Tandem)
- 11.1.1.2. Quadrupole TOF (Q-TOF)
- 11.1.1.3. FTMS (Fourier Transform Mass Spectrometry)
- 11.1.2. Single Mass Spectrometry
- 11.1.2.1. ION Trap
- 11.1.2.2. Time-of-flight (TOF)
- 11.1.3. Other Mass Spectrometry
- 11.1.1. Hybrid Mass Spectrometry
- 11.2. Market Analysis, Insights and Forecast - by Application
- 11.2.1. Pharmaceuticals Industry
- 11.2.2. Biotechnology Industry
- 11.2.3. Chemical Industry
- 11.2.4. Other Applications
- 11.1. Market Analysis, Insights and Forecast - by Technology
- 12. Germany Europe Mass Spectroscopy Industry Analysis, Insights and Forecast, 2019-2031
- 13. France Europe Mass Spectroscopy Industry Analysis, Insights and Forecast, 2019-2031
- 14. Italy Europe Mass Spectroscopy Industry Analysis, Insights and Forecast, 2019-2031
- 15. United Kingdom Europe Mass Spectroscopy Industry Analysis, Insights and Forecast, 2019-2031
- 16. Netherlands Europe Mass Spectroscopy Industry Analysis, Insights and Forecast, 2019-2031
- 17. Sweden Europe Mass Spectroscopy Industry Analysis, Insights and Forecast, 2019-2031
- 18. Rest of Europe Europe Mass Spectroscopy Industry Analysis, Insights and Forecast, 2019-2031
- 19. Competitive Analysis
- 19.1. Market Share Analysis 2024
- 19.2. Company Profiles
- 19.2.1 Waters Corporation
- 19.2.1.1. Overview
- 19.2.1.2. Products
- 19.2.1.3. SWOT Analysis
- 19.2.1.4. Recent Developments
- 19.2.1.5. Financials (Based on Availability)
- 19.2.2 Perkinelmer Inc
- 19.2.2.1. Overview
- 19.2.2.2. Products
- 19.2.2.3. SWOT Analysis
- 19.2.2.4. Recent Developments
- 19.2.2.5. Financials (Based on Availability)
- 19.2.3 Thermo Fisher Scientific Inc
- 19.2.3.1. Overview
- 19.2.3.2. Products
- 19.2.3.3. SWOT Analysis
- 19.2.3.4. Recent Developments
- 19.2.3.5. Financials (Based on Availability)
- 19.2.4 Leco Corporation
- 19.2.4.1. Overview
- 19.2.4.2. Products
- 19.2.4.3. SWOT Analysis
- 19.2.4.4. Recent Developments
- 19.2.4.5. Financials (Based on Availability)
- 19.2.5 Danaher Corporation
- 19.2.5.1. Overview
- 19.2.5.2. Products
- 19.2.5.3. SWOT Analysis
- 19.2.5.4. Recent Developments
- 19.2.5.5. Financials (Based on Availability)
- 19.2.6 Agilent Technologies Inc
- 19.2.6.1. Overview
- 19.2.6.2. Products
- 19.2.6.3. SWOT Analysis
- 19.2.6.4. Recent Developments
- 19.2.6.5. Financials (Based on Availability)
- 19.2.7 Dani Instruments SpA
- 19.2.7.1. Overview
- 19.2.7.2. Products
- 19.2.7.3. SWOT Analysis
- 19.2.7.4. Recent Developments
- 19.2.7.5. Financials (Based on Availability)
- 19.2.8 Bruker Corporation
- 19.2.8.1. Overview
- 19.2.8.2. Products
- 19.2.8.3. SWOT Analysis
- 19.2.8.4. Recent Developments
- 19.2.8.5. Financials (Based on Availability)
- 19.2.9 Shimadzu Corporation
- 19.2.9.1. Overview
- 19.2.9.2. Products
- 19.2.9.3. SWOT Analysis
- 19.2.9.4. Recent Developments
- 19.2.9.5. Financials (Based on Availability)
- 19.2.1 Waters Corporation
List of Figures
- Figure 1: Europe Mass Spectroscopy Industry Revenue Breakdown (Million, %) by Product 2024 & 2032
- Figure 2: Europe Mass Spectroscopy Industry Share (%) by Company 2024
List of Tables
- Table 1: Europe Mass Spectroscopy Industry Revenue Million Forecast, by Region 2019 & 2032
- Table 2: Europe Mass Spectroscopy Industry Volume K Unit Forecast, by Region 2019 & 2032
- Table 3: Europe Mass Spectroscopy Industry Revenue Million Forecast, by Technology 2019 & 2032
- Table 4: Europe Mass Spectroscopy Industry Volume K Unit Forecast, by Technology 2019 & 2032
- Table 5: Europe Mass Spectroscopy Industry Revenue Million Forecast, by Application 2019 & 2032
- Table 6: Europe Mass Spectroscopy Industry Volume K Unit Forecast, by Application 2019 & 2032
- Table 7: Europe Mass Spectroscopy Industry Revenue Million Forecast, by Region 2019 & 2032
- Table 8: Europe Mass Spectroscopy Industry Volume K Unit Forecast, by Region 2019 & 2032
- Table 9: Europe Mass Spectroscopy Industry Revenue Million Forecast, by Country 2019 & 2032
- Table 10: Europe Mass Spectroscopy Industry Volume K Unit Forecast, by Country 2019 & 2032
- Table 11: Germany Europe Mass Spectroscopy Industry Revenue (Million) Forecast, by Application 2019 & 2032
- Table 12: Germany Europe Mass Spectroscopy Industry Volume (K Unit) Forecast, by Application 2019 & 2032
- Table 13: France Europe Mass Spectroscopy Industry Revenue (Million) Forecast, by Application 2019 & 2032
- Table 14: France Europe Mass Spectroscopy Industry Volume (K Unit) Forecast, by Application 2019 & 2032
- Table 15: Italy Europe Mass Spectroscopy Industry Revenue (Million) Forecast, by Application 2019 & 2032
- Table 16: Italy Europe Mass Spectroscopy Industry Volume (K Unit) Forecast, by Application 2019 & 2032
- Table 17: United Kingdom Europe Mass Spectroscopy Industry Revenue (Million) Forecast, by Application 2019 & 2032
- Table 18: United Kingdom Europe Mass Spectroscopy Industry Volume (K Unit) Forecast, by Application 2019 & 2032
- Table 19: Netherlands Europe Mass Spectroscopy Industry Revenue (Million) Forecast, by Application 2019 & 2032
- Table 20: Netherlands Europe Mass Spectroscopy Industry Volume (K Unit) Forecast, by Application 2019 & 2032
- Table 21: Sweden Europe Mass Spectroscopy Industry Revenue (Million) Forecast, by Application 2019 & 2032
- Table 22: Sweden Europe Mass Spectroscopy Industry Volume (K Unit) Forecast, by Application 2019 & 2032
- Table 23: Rest of Europe Europe Mass Spectroscopy Industry Revenue (Million) Forecast, by Application 2019 & 2032
- Table 24: Rest of Europe Europe Mass Spectroscopy Industry Volume (K Unit) Forecast, by Application 2019 & 2032
- Table 25: Europe Mass Spectroscopy Industry Revenue Million Forecast, by Technology 2019 & 2032
- Table 26: Europe Mass Spectroscopy Industry Volume K Unit Forecast, by Technology 2019 & 2032
- Table 27: Europe Mass Spectroscopy Industry Revenue Million Forecast, by Application 2019 & 2032
- Table 28: Europe Mass Spectroscopy Industry Volume K Unit Forecast, by Application 2019 & 2032
- Table 29: Europe Mass Spectroscopy Industry Revenue Million Forecast, by Country 2019 & 2032
- Table 30: Europe Mass Spectroscopy Industry Volume K Unit Forecast, by Country 2019 & 2032
- Table 31: Europe Mass Spectroscopy Industry Revenue Million Forecast, by Technology 2019 & 2032
- Table 32: Europe Mass Spectroscopy Industry Volume K Unit Forecast, by Technology 2019 & 2032
- Table 33: Europe Mass Spectroscopy Industry Revenue Million Forecast, by Application 2019 & 2032
- Table 34: Europe Mass Spectroscopy Industry Volume K Unit Forecast, by Application 2019 & 2032
- Table 35: Europe Mass Spectroscopy Industry Revenue Million Forecast, by Country 2019 & 2032
- Table 36: Europe Mass Spectroscopy Industry Volume K Unit Forecast, by Country 2019 & 2032
- Table 37: Europe Mass Spectroscopy Industry Revenue Million Forecast, by Technology 2019 & 2032
- Table 38: Europe Mass Spectroscopy Industry Volume K Unit Forecast, by Technology 2019 & 2032
- Table 39: Europe Mass Spectroscopy Industry Revenue Million Forecast, by Application 2019 & 2032
- Table 40: Europe Mass Spectroscopy Industry Volume K Unit Forecast, by Application 2019 & 2032
- Table 41: Europe Mass Spectroscopy Industry Revenue Million Forecast, by Country 2019 & 2032
- Table 42: Europe Mass Spectroscopy Industry Volume K Unit Forecast, by Country 2019 & 2032
- Table 43: Europe Mass Spectroscopy Industry Revenue Million Forecast, by Technology 2019 & 2032
- Table 44: Europe Mass Spectroscopy Industry Volume K Unit Forecast, by Technology 2019 & 2032
- Table 45: Europe Mass Spectroscopy Industry Revenue Million Forecast, by Application 2019 & 2032
- Table 46: Europe Mass Spectroscopy Industry Volume K Unit Forecast, by Application 2019 & 2032
- Table 47: Europe Mass Spectroscopy Industry Revenue Million Forecast, by Country 2019 & 2032
- Table 48: Europe Mass Spectroscopy Industry Volume K Unit Forecast, by Country 2019 & 2032
- Table 49: Europe Mass Spectroscopy Industry Revenue Million Forecast, by Technology 2019 & 2032
- Table 50: Europe Mass Spectroscopy Industry Volume K Unit Forecast, by Technology 2019 & 2032
- Table 51: Europe Mass Spectroscopy Industry Revenue Million Forecast, by Application 2019 & 2032
- Table 52: Europe Mass Spectroscopy Industry Volume K Unit Forecast, by Application 2019 & 2032
- Table 53: Europe Mass Spectroscopy Industry Revenue Million Forecast, by Country 2019 & 2032
- Table 54: Europe Mass Spectroscopy Industry Volume K Unit Forecast, by Country 2019 & 2032
- Table 55: Europe Mass Spectroscopy Industry Revenue Million Forecast, by Technology 2019 & 2032
- Table 56: Europe Mass Spectroscopy Industry Volume K Unit Forecast, by Technology 2019 & 2032
- Table 57: Europe Mass Spectroscopy Industry Revenue Million Forecast, by Application 2019 & 2032
- Table 58: Europe Mass Spectroscopy Industry Volume K Unit Forecast, by Application 2019 & 2032
- Table 59: Europe Mass Spectroscopy Industry Revenue Million Forecast, by Country 2019 & 2032
- Table 60: Europe Mass Spectroscopy Industry Volume K Unit Forecast, by Country 2019 & 2032
Frequently Asked Questions
1. What is the projected Compound Annual Growth Rate (CAGR) of the Europe Mass Spectroscopy Industry?
The projected CAGR is approximately 6.50%.
2. Which companies are prominent players in the Europe Mass Spectroscopy Industry?
Key companies in the market include Waters Corporation, Perkinelmer Inc, Thermo Fisher Scientific Inc, Leco Corporation, Danaher Corporation, Agilent Technologies Inc, Dani Instruments SpA, Bruker Corporation, Shimadzu Corporation.
3. What are the main segments of the Europe Mass Spectroscopy Industry?
The market segments include Technology, Application.
4. Can you provide details about the market size?
The market size is estimated to be USD XX Million as of 2022.
5. What are some drivers contributing to market growth?
Increasing Technological Advancement; Increased Pharmaceutical and Biotechnological Compounds in Pipeline.
6. What are the notable trends driving market growth?
Triple Quadrupole (Tandem Mass Spectrometry Devices) Segment is Expected to Dominate the Market over the Forecast Period.
7. Are there any restraints impacting market growth?
High Cost of Instrument; Shortage of Skilled Technicians.
8. Can you provide examples of recent developments in the market?
June 2022: Waters Corporation unveiled new instruments, software, and product enhancements to drive drug discovery and development.
9. What pricing options are available for accessing the report?
Pricing options include single-user, multi-user, and enterprise licenses priced at USD 4750, USD 5250, and USD 8750 respectively.
10. Is the market size provided in terms of value or volume?
The market size is provided in terms of value, measured in Million and volume, measured in K Unit.
11. Are there any specific market keywords associated with the report?
Yes, the market keyword associated with the report is "Europe Mass Spectroscopy Industry," which aids in identifying and referencing the specific market segment covered.
12. How do I determine which pricing option suits my needs best?
The pricing options vary based on user requirements and access needs. Individual users may opt for single-user licenses, while businesses requiring broader access may choose multi-user or enterprise licenses for cost-effective access to the report.
13. Are there any additional resources or data provided in the Europe Mass Spectroscopy Industry report?
While the report offers comprehensive insights, it's advisable to review the specific contents or supplementary materials provided to ascertain if additional resources or data are available.
14. How can I stay updated on further developments or reports in the Europe Mass Spectroscopy Industry?
To stay informed about further developments, trends, and reports in the Europe Mass Spectroscopy Industry, consider subscribing to industry newsletters, following relevant companies and organizations, or regularly checking reputable industry news sources and publications.
Methodology
Step 1 - Identification of Relevant Samples Size from Population Database


Step 2 - Approaches for Defining Global Market Size (Value, Volume* & Price*)

Note*: In applicable scenarios
Step 3 - Data Sources
Primary Research
- Web Analytics
- Survey Reports
- Research Institute
- Latest Research Reports
- Opinion Leaders
Secondary Research
- Annual Reports
- White Paper
- Latest Press Release
- Industry Association
- Paid Database
- Investor Presentations

Step 4 - Data Triangulation
Involves using different sources of information in order to increase the validity of a study
These sources are likely to be stakeholders in a program - participants, other researchers, program staff, other community members, and so on.
Then we put all data in single framework & apply various statistical tools to find out the dynamic on the market.
During the analysis stage, feedback from the stakeholder groups would be compared to determine areas of agreement as well as areas of divergence


