
Key Insights
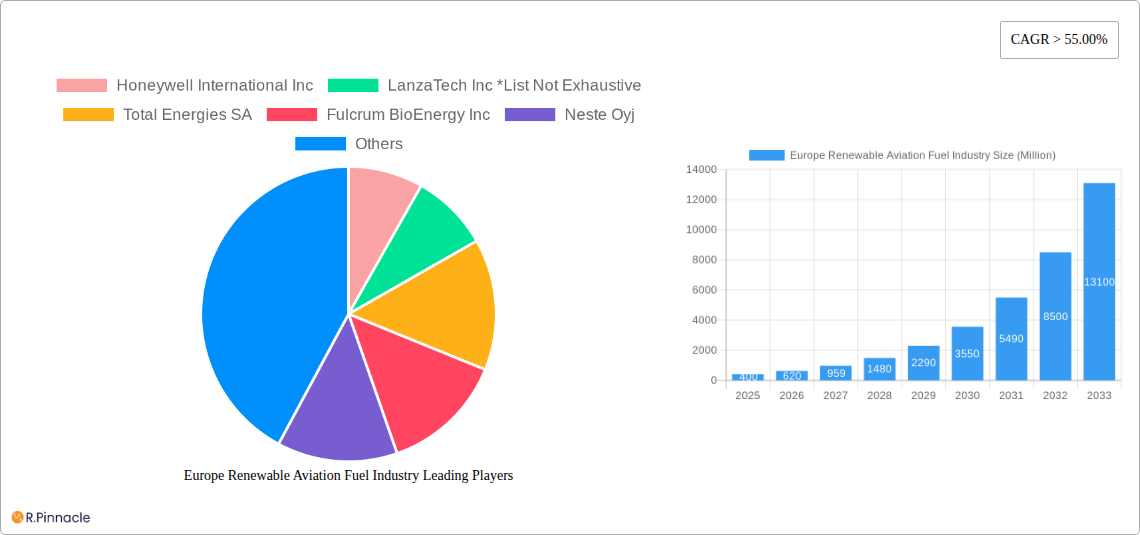
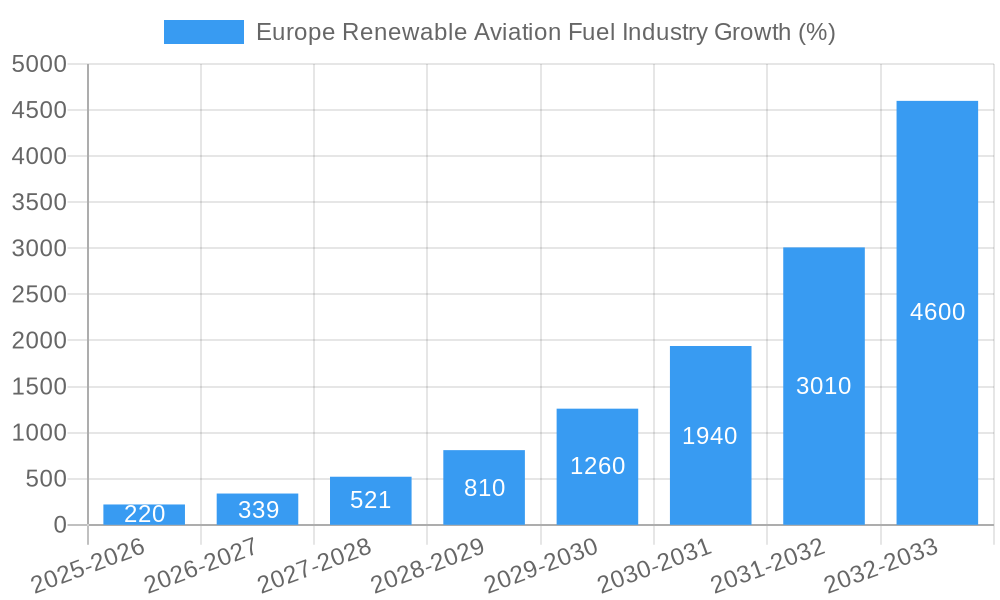
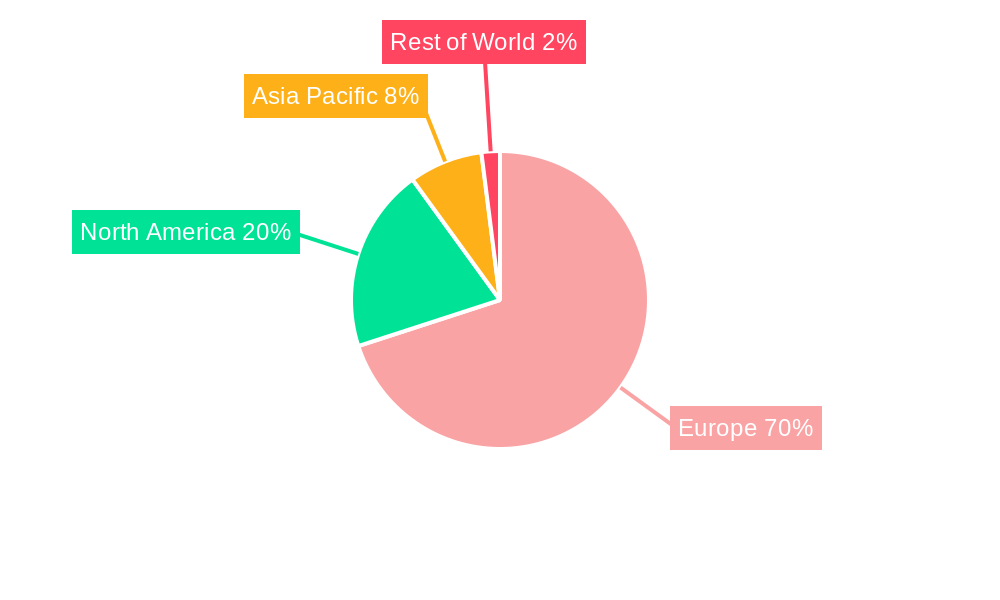
The European renewable aviation fuel (RAF) market is experiencing explosive growth, driven by stringent environmental regulations aimed at reducing aviation's carbon footprint and a rising consumer demand for sustainable travel. With a Compound Annual Growth Rate (CAGR) exceeding 55% and a 2025 market value estimated in the hundreds of millions of Euros (precise figures unavailable, but based on global market trends and the stated CAGR, a reasonable estimate would be between €300-€500 million), the sector presents significant investment opportunities. Key drivers include the increasing cost of traditional jet fuel, government incentives supporting sustainable aviation, and advancements in RAF production technologies like Fischer-Tropsch (FT), Hydroprocessed Esters and Fatty Acids (HEFA), Synthesized Iso-Paraffinic (SIP), and Alcohol-to-Jet (AJT). Germany, France, the UK, and the Netherlands are leading the European market, benefiting from established biofuel infrastructure and supportive policy frameworks. However, challenges remain, including the relatively high production costs of RAF compared to conventional fuels and the need for further scaling up of production capacity to meet the growing demand. Segment-wise, the commercial aviation sector dominates current consumption, while the defense sector is expected to show significant growth in the coming years.
The forecast period (2025-2033) anticipates continuous expansion, with market leaders such as Honeywell International Inc, LanzaTech Inc, Total Energies SA, Fulcrum BioEnergy Inc, Neste Oyj, Swedish Biofuels AB, and Gevo Inc, competing intensely for market share. Technological advancements, particularly in improving the efficiency and cost-effectiveness of different RAF production pathways, will be crucial for future market growth. Furthermore, the successful integration of RAF into existing aviation infrastructure and the development of robust supply chains across Europe will be paramount in achieving sustainable air travel. The expanding market holds significant promise for investors, innovators, and policymakers alike, paving the way for a more environmentally responsible aviation industry.
Europe Renewable Aviation Fuel Industry: A Comprehensive Market Report (2019-2033)
This in-depth report provides a comprehensive analysis of the Europe Renewable Aviation Fuel (RAF) industry, offering valuable insights for industry professionals, investors, and policymakers. The report covers the period 2019-2033, with a focus on the 2025-2033 forecast period and includes key data for the base year 2025. Expect detailed analysis of market dynamics, technological advancements, leading players, and future growth opportunities within the European RAF landscape. Discover actionable intelligence to navigate this rapidly evolving sector.
Europe Renewable Aviation Fuel Industry Market Structure & Innovation Trends
This section delves into the competitive landscape of the European RAF market, analyzing market concentration, innovation drivers, regulatory frameworks, and M&A activities. We explore the influence of product substitutes and end-user demographics on market growth. The report quantifies market share among key players and provides an overview of significant M&A deal values (in Millions).
- Market Concentration: Analysis of market share held by major players like Neste Oyj, Total Energies SA, and Honeywell International Inc. We will quantify the level of market concentration and identify any emerging dominant players. xx% market share held by top 5 players (2025 estimate).
- Innovation Drivers: Examination of key technological advancements driving RAF production, including HEFA, FT, SIP, and AJT technologies. We will analyze the impact of R&D investments and government incentives.
- Regulatory Frameworks: Detailed assessment of EU regulations and policies impacting RAF production and adoption, including emission reduction targets and sustainable fuel mandates.
- Product Substitutes: Evaluation of alternative sustainable aviation fuels and their competitive impact on the RAF market.
- End-User Demographics: Analysis of the demand for RAF across different aviation segments, including commercial and defense applications.
- M&A Activities: Overview of recent mergers, acquisitions, and joint ventures in the European RAF industry, including deal values (in Millions) and their implications for market consolidation. Example: xx Million deal value in a key M&A transaction (year).
Europe Renewable Aviation Fuel Industry Market Dynamics & Trends
This section provides a detailed analysis of market growth drivers, technological disruptions, consumer preferences, and competitive dynamics within the European RAF market. The report provides quantitative data such as CAGR and market penetration rates. We will analyze market growth drivers, technological disruptions, and the evolution of consumer preferences impacting the industry's trajectory.
- Market size projections for 2025 and 2033 (in Millions).
- CAGR for the forecast period (2025-2033).
- Market penetration analysis across various segments (Commercial, Defense, etc.).
- Detailed analysis of competitive dynamics, including market share and strategic partnerships.
- In-depth examination of evolving consumer preferences and their impact on demand for RAF.
- Assessment of the impact of technological advancements on RAF production costs and efficiency.
Dominant Regions & Segments in Europe Renewable Aviation Fuel Industry
This section identifies the leading regions, countries, and RAF segments within Europe. We analyze key drivers, including economic policies and infrastructure development.
- Leading Region/Country: [Name of leading region/country], driven by [reasons, e.g., supportive government policies, established infrastructure].
- Dominant Application Segment: [Commercial/Defense - specify which and the reasoning].
- Leading Technology Segment: [HEFA/FT/SIP/AJT - specify which and the reasoning].
- Key Drivers:
- Favorable government regulations and incentives.
- Robust infrastructure for RAF production and distribution.
- High demand from major airlines.
- Availability of suitable feedstock.
- Detailed analysis of the factors contributing to the dominance of specific regions, countries, and RAF segments.
Europe Renewable Aviation Fuel Industry Product Innovations
This section summarizes recent product developments, applications, and competitive advantages within the European RAF market, highlighting technological trends and market fit. We explore the latest advancements in RAF production technologies, focusing on their market impact and competitive advantages. This includes analysis of how the innovations address market demands for sustainable and cost-effective aviation fuel.
Report Scope & Segmentation Analysis
This section details market segmentations based on application (Commercial, Defense) and technology (Fischer-Tropsch (FT), Hydroprocessed Esters and Fatty Acids (HEFA), Synthesisized Iso-Paraffinic (SIP), and Alcohol-to-Jet (AJT)). It includes growth projections, market sizes (in Millions), and competitive dynamics for each segment.
- Application: Commercial Aviation (growth projections, market size), Defense Aviation (growth projections, market size)
- Technology: FT (growth projections, market size, competitive landscape), HEFA (growth projections, market size, competitive landscape), SIP (growth projections, market size, competitive landscape), AJT (growth projections, market size, competitive landscape)
Key Drivers of Europe Renewable Aviation Fuel Industry Growth
This section outlines the key technological, economic, and regulatory factors driving the growth of the European RAF industry. Specific examples will illustrate the impact of each driver. We analyze the underlying forces propelling the growth of the European RAF market, including technological advancements, supportive government policies, and rising environmental concerns.
Challenges in the Europe Renewable Aviation Fuel Industry Sector
This section discusses the barriers and restraints impacting the European RAF industry, including regulatory hurdles, supply chain issues, and competitive pressures. Quantifiable impacts of these challenges will be presented. We examine the key challenges hindering the growth of the European RAF market, such as high production costs, limited feedstock availability, and regulatory uncertainties.
Emerging Opportunities in Europe Renewable Aviation Fuel Industry
This section highlights emerging trends and opportunities in the European RAF market, focusing on new markets, technologies, and consumer preferences. Examples of promising avenues for growth include expanding into new markets, developing innovative technologies, and adapting to evolving consumer demands.
Leading Players in the Europe Renewable Aviation Fuel Industry Market
- Honeywell International Inc
- LanzaTech Inc
- Total Energies SA
- Fulcrum BioEnergy Inc
- Neste Oyj
- Swedish Biofuels AB
- Gevo Inc
Key Developments in Europe Renewable Aviation Fuel Industry Industry
- December 2022: TotalEnergies signed a memorandum of understanding to deliver more than 800,000 tonnes of sustainable aviation fuel to Air France-KLM Group airlines over ten years (2023-2033). This signifies a major commitment to the adoption of SAF.
- January 2022: Cepsa partnered with Iberia and Iberia Express to develop large-scale SAF production using waste, recycled oils, and second-generation plant-based bio-feedstock. This highlights the growing interest in utilizing waste materials for SAF production.
Future Outlook for Europe Renewable Aviation Fuel Industry Market
This section summarizes the growth accelerators for the European RAF market, focusing on its future potential and strategic opportunities. The outlook for the European RAF market is positive, driven by factors such as increasing environmental regulations, growing consumer demand for sustainable aviation, and continued technological advancements. The market is poised for significant expansion in the coming years, presenting attractive opportunities for investors and industry players.
Europe Renewable Aviation Fuel Industry Segmentation
-
1. Technology
- 1.1. Fischer-Tropsch (FT)
- 1.2. Hydroprocessed Esters and Fatty Acids (HEFA)
- 1.3. Synthesi
-
2. Application
- 2.1. Commercial
- 2.2. Defense
Europe Renewable Aviation Fuel Industry Segmentation By Geography
- 1. Germany
- 2. France
- 3. United Kingdom
- 4. Rest of Europe
Europe Renewable Aviation Fuel Industry REPORT HIGHLIGHTS
| Aspects | Details |
|---|---|
| Study Period | 2019-2033 |
| Base Year | 2024 |
| Estimated Year | 2025 |
| Forecast Period | 2025-2033 |
| Historical Period | 2019-2024 |
| Growth Rate | CAGR of > 55.00% from 2019-2033 |
| Segmentation |
|
Table of Contents
- 1. Introduction
- 1.1. Research Scope
- 1.2. Market Segmentation
- 1.3. Research Methodology
- 1.4. Definitions and Assumptions
- 2. Executive Summary
- 2.1. Introduction
- 3. Market Dynamics
- 3.1. Introduction
- 3.2. Market Drivers
- 3.2.1. 4.; Declining Solar Panel Costs4.; Supportive Government Policies
- 3.3. Market Restrains
- 3.3.1. 4.; High Upfront Cost
- 3.4. Market Trends
- 3.4.1. Commercial Sector to be the Largest Segment
- 4. Market Factor Analysis
- 4.1. Porters Five Forces
- 4.2. Supply/Value Chain
- 4.3. PESTEL analysis
- 4.4. Market Entropy
- 4.5. Patent/Trademark Analysis
- 5. Europe Renewable Aviation Fuel Industry Analysis, Insights and Forecast, 2019-2031
- 5.1. Market Analysis, Insights and Forecast - by Technology
- 5.1.1. Fischer-Tropsch (FT)
- 5.1.2. Hydroprocessed Esters and Fatty Acids (HEFA)
- 5.1.3. Synthesi
- 5.2. Market Analysis, Insights and Forecast - by Application
- 5.2.1. Commercial
- 5.2.2. Defense
- 5.3. Market Analysis, Insights and Forecast - by Region
- 5.3.1. Germany
- 5.3.2. France
- 5.3.3. United Kingdom
- 5.3.4. Rest of Europe
- 5.1. Market Analysis, Insights and Forecast - by Technology
- 6. Germany Europe Renewable Aviation Fuel Industry Analysis, Insights and Forecast, 2019-2031
- 6.1. Market Analysis, Insights and Forecast - by Technology
- 6.1.1. Fischer-Tropsch (FT)
- 6.1.2. Hydroprocessed Esters and Fatty Acids (HEFA)
- 6.1.3. Synthesi
- 6.2. Market Analysis, Insights and Forecast - by Application
- 6.2.1. Commercial
- 6.2.2. Defense
- 6.1. Market Analysis, Insights and Forecast - by Technology
- 7. France Europe Renewable Aviation Fuel Industry Analysis, Insights and Forecast, 2019-2031
- 7.1. Market Analysis, Insights and Forecast - by Technology
- 7.1.1. Fischer-Tropsch (FT)
- 7.1.2. Hydroprocessed Esters and Fatty Acids (HEFA)
- 7.1.3. Synthesi
- 7.2. Market Analysis, Insights and Forecast - by Application
- 7.2.1. Commercial
- 7.2.2. Defense
- 7.1. Market Analysis, Insights and Forecast - by Technology
- 8. United Kingdom Europe Renewable Aviation Fuel Industry Analysis, Insights and Forecast, 2019-2031
- 8.1. Market Analysis, Insights and Forecast - by Technology
- 8.1.1. Fischer-Tropsch (FT)
- 8.1.2. Hydroprocessed Esters and Fatty Acids (HEFA)
- 8.1.3. Synthesi
- 8.2. Market Analysis, Insights and Forecast - by Application
- 8.2.1. Commercial
- 8.2.2. Defense
- 8.1. Market Analysis, Insights and Forecast - by Technology
- 9. Rest of Europe Europe Renewable Aviation Fuel Industry Analysis, Insights and Forecast, 2019-2031
- 9.1. Market Analysis, Insights and Forecast - by Technology
- 9.1.1. Fischer-Tropsch (FT)
- 9.1.2. Hydroprocessed Esters and Fatty Acids (HEFA)
- 9.1.3. Synthesi
- 9.2. Market Analysis, Insights and Forecast - by Application
- 9.2.1. Commercial
- 9.2.2. Defense
- 9.1. Market Analysis, Insights and Forecast - by Technology
- 10. Germany Europe Renewable Aviation Fuel Industry Analysis, Insights and Forecast, 2019-2031
- 11. France Europe Renewable Aviation Fuel Industry Analysis, Insights and Forecast, 2019-2031
- 12. Italy Europe Renewable Aviation Fuel Industry Analysis, Insights and Forecast, 2019-2031
- 13. United Kingdom Europe Renewable Aviation Fuel Industry Analysis, Insights and Forecast, 2019-2031
- 14. Netherlands Europe Renewable Aviation Fuel Industry Analysis, Insights and Forecast, 2019-2031
- 15. Sweden Europe Renewable Aviation Fuel Industry Analysis, Insights and Forecast, 2019-2031
- 16. Rest of Europe Europe Renewable Aviation Fuel Industry Analysis, Insights and Forecast, 2019-2031
- 17. Competitive Analysis
- 17.1. Market Share Analysis 2024
- 17.2. Company Profiles
- 17.2.1 Honeywell International Inc
- 17.2.1.1. Overview
- 17.2.1.2. Products
- 17.2.1.3. SWOT Analysis
- 17.2.1.4. Recent Developments
- 17.2.1.5. Financials (Based on Availability)
- 17.2.2 LanzaTech Inc *List Not Exhaustive
- 17.2.2.1. Overview
- 17.2.2.2. Products
- 17.2.2.3. SWOT Analysis
- 17.2.2.4. Recent Developments
- 17.2.2.5. Financials (Based on Availability)
- 17.2.3 Total Energies SA
- 17.2.3.1. Overview
- 17.2.3.2. Products
- 17.2.3.3. SWOT Analysis
- 17.2.3.4. Recent Developments
- 17.2.3.5. Financials (Based on Availability)
- 17.2.4 Fulcrum BioEnergy Inc
- 17.2.4.1. Overview
- 17.2.4.2. Products
- 17.2.4.3. SWOT Analysis
- 17.2.4.4. Recent Developments
- 17.2.4.5. Financials (Based on Availability)
- 17.2.5 Neste Oyj
- 17.2.5.1. Overview
- 17.2.5.2. Products
- 17.2.5.3. SWOT Analysis
- 17.2.5.4. Recent Developments
- 17.2.5.5. Financials (Based on Availability)
- 17.2.6 Swedish Biofuels AB
- 17.2.6.1. Overview
- 17.2.6.2. Products
- 17.2.6.3. SWOT Analysis
- 17.2.6.4. Recent Developments
- 17.2.6.5. Financials (Based on Availability)
- 17.2.7 Gevo Inc
- 17.2.7.1. Overview
- 17.2.7.2. Products
- 17.2.7.3. SWOT Analysis
- 17.2.7.4. Recent Developments
- 17.2.7.5. Financials (Based on Availability)
- 17.2.1 Honeywell International Inc
List of Figures
- Figure 1: Europe Renewable Aviation Fuel Industry Revenue Breakdown (Million, %) by Product 2024 & 2032
- Figure 2: Europe Renewable Aviation Fuel Industry Share (%) by Company 2024
List of Tables
- Table 1: Europe Renewable Aviation Fuel Industry Revenue Million Forecast, by Region 2019 & 2032
- Table 2: Europe Renewable Aviation Fuel Industry Volume K Tons Forecast, by Region 2019 & 2032
- Table 3: Europe Renewable Aviation Fuel Industry Revenue Million Forecast, by Technology 2019 & 2032
- Table 4: Europe Renewable Aviation Fuel Industry Volume K Tons Forecast, by Technology 2019 & 2032
- Table 5: Europe Renewable Aviation Fuel Industry Revenue Million Forecast, by Application 2019 & 2032
- Table 6: Europe Renewable Aviation Fuel Industry Volume K Tons Forecast, by Application 2019 & 2032
- Table 7: Europe Renewable Aviation Fuel Industry Revenue Million Forecast, by Region 2019 & 2032
- Table 8: Europe Renewable Aviation Fuel Industry Volume K Tons Forecast, by Region 2019 & 2032
- Table 9: Europe Renewable Aviation Fuel Industry Revenue Million Forecast, by Country 2019 & 2032
- Table 10: Europe Renewable Aviation Fuel Industry Volume K Tons Forecast, by Country 2019 & 2032
- Table 11: Germany Europe Renewable Aviation Fuel Industry Revenue (Million) Forecast, by Application 2019 & 2032
- Table 12: Germany Europe Renewable Aviation Fuel Industry Volume (K Tons) Forecast, by Application 2019 & 2032
- Table 13: France Europe Renewable Aviation Fuel Industry Revenue (Million) Forecast, by Application 2019 & 2032
- Table 14: France Europe Renewable Aviation Fuel Industry Volume (K Tons) Forecast, by Application 2019 & 2032
- Table 15: Italy Europe Renewable Aviation Fuel Industry Revenue (Million) Forecast, by Application 2019 & 2032
- Table 16: Italy Europe Renewable Aviation Fuel Industry Volume (K Tons) Forecast, by Application 2019 & 2032
- Table 17: United Kingdom Europe Renewable Aviation Fuel Industry Revenue (Million) Forecast, by Application 2019 & 2032
- Table 18: United Kingdom Europe Renewable Aviation Fuel Industry Volume (K Tons) Forecast, by Application 2019 & 2032
- Table 19: Netherlands Europe Renewable Aviation Fuel Industry Revenue (Million) Forecast, by Application 2019 & 2032
- Table 20: Netherlands Europe Renewable Aviation Fuel Industry Volume (K Tons) Forecast, by Application 2019 & 2032
- Table 21: Sweden Europe Renewable Aviation Fuel Industry Revenue (Million) Forecast, by Application 2019 & 2032
- Table 22: Sweden Europe Renewable Aviation Fuel Industry Volume (K Tons) Forecast, by Application 2019 & 2032
- Table 23: Rest of Europe Europe Renewable Aviation Fuel Industry Revenue (Million) Forecast, by Application 2019 & 2032
- Table 24: Rest of Europe Europe Renewable Aviation Fuel Industry Volume (K Tons) Forecast, by Application 2019 & 2032
- Table 25: Europe Renewable Aviation Fuel Industry Revenue Million Forecast, by Technology 2019 & 2032
- Table 26: Europe Renewable Aviation Fuel Industry Volume K Tons Forecast, by Technology 2019 & 2032
- Table 27: Europe Renewable Aviation Fuel Industry Revenue Million Forecast, by Application 2019 & 2032
- Table 28: Europe Renewable Aviation Fuel Industry Volume K Tons Forecast, by Application 2019 & 2032
- Table 29: Europe Renewable Aviation Fuel Industry Revenue Million Forecast, by Country 2019 & 2032
- Table 30: Europe Renewable Aviation Fuel Industry Volume K Tons Forecast, by Country 2019 & 2032
- Table 31: Europe Renewable Aviation Fuel Industry Revenue Million Forecast, by Technology 2019 & 2032
- Table 32: Europe Renewable Aviation Fuel Industry Volume K Tons Forecast, by Technology 2019 & 2032
- Table 33: Europe Renewable Aviation Fuel Industry Revenue Million Forecast, by Application 2019 & 2032
- Table 34: Europe Renewable Aviation Fuel Industry Volume K Tons Forecast, by Application 2019 & 2032
- Table 35: Europe Renewable Aviation Fuel Industry Revenue Million Forecast, by Country 2019 & 2032
- Table 36: Europe Renewable Aviation Fuel Industry Volume K Tons Forecast, by Country 2019 & 2032
- Table 37: Europe Renewable Aviation Fuel Industry Revenue Million Forecast, by Technology 2019 & 2032
- Table 38: Europe Renewable Aviation Fuel Industry Volume K Tons Forecast, by Technology 2019 & 2032
- Table 39: Europe Renewable Aviation Fuel Industry Revenue Million Forecast, by Application 2019 & 2032
- Table 40: Europe Renewable Aviation Fuel Industry Volume K Tons Forecast, by Application 2019 & 2032
- Table 41: Europe Renewable Aviation Fuel Industry Revenue Million Forecast, by Country 2019 & 2032
- Table 42: Europe Renewable Aviation Fuel Industry Volume K Tons Forecast, by Country 2019 & 2032
- Table 43: Europe Renewable Aviation Fuel Industry Revenue Million Forecast, by Technology 2019 & 2032
- Table 44: Europe Renewable Aviation Fuel Industry Volume K Tons Forecast, by Technology 2019 & 2032
- Table 45: Europe Renewable Aviation Fuel Industry Revenue Million Forecast, by Application 2019 & 2032
- Table 46: Europe Renewable Aviation Fuel Industry Volume K Tons Forecast, by Application 2019 & 2032
- Table 47: Europe Renewable Aviation Fuel Industry Revenue Million Forecast, by Country 2019 & 2032
- Table 48: Europe Renewable Aviation Fuel Industry Volume K Tons Forecast, by Country 2019 & 2032
Frequently Asked Questions
1. What is the projected Compound Annual Growth Rate (CAGR) of the Europe Renewable Aviation Fuel Industry?
The projected CAGR is approximately > 55.00%.
2. Which companies are prominent players in the Europe Renewable Aviation Fuel Industry?
Key companies in the market include Honeywell International Inc, LanzaTech Inc *List Not Exhaustive, Total Energies SA, Fulcrum BioEnergy Inc, Neste Oyj, Swedish Biofuels AB, Gevo Inc.
3. What are the main segments of the Europe Renewable Aviation Fuel Industry?
The market segments include Technology, Application.
4. Can you provide details about the market size?
The market size is estimated to be USD XX Million as of 2022.
5. What are some drivers contributing to market growth?
4.; Declining Solar Panel Costs4.; Supportive Government Policies.
6. What are the notable trends driving market growth?
Commercial Sector to be the Largest Segment.
7. Are there any restraints impacting market growth?
4.; High Upfront Cost.
8. Can you provide examples of recent developments in the market?
December 2022: TotalEnergies signed a memorandum of understanding to deliver more than one million cubic meters/800,000 tonnes of sustainable aviation fuel to Air France-KLM Group airlines over the ten years from 2023 to 2033.
9. What pricing options are available for accessing the report?
Pricing options include single-user, multi-user, and enterprise licenses priced at USD 4750, USD 5250, and USD 8750 respectively.
10. Is the market size provided in terms of value or volume?
The market size is provided in terms of value, measured in Million and volume, measured in K Tons.
11. Are there any specific market keywords associated with the report?
Yes, the market keyword associated with the report is "Europe Renewable Aviation Fuel Industry," which aids in identifying and referencing the specific market segment covered.
12. How do I determine which pricing option suits my needs best?
The pricing options vary based on user requirements and access needs. Individual users may opt for single-user licenses, while businesses requiring broader access may choose multi-user or enterprise licenses for cost-effective access to the report.
13. Are there any additional resources or data provided in the Europe Renewable Aviation Fuel Industry report?
While the report offers comprehensive insights, it's advisable to review the specific contents or supplementary materials provided to ascertain if additional resources or data are available.
14. How can I stay updated on further developments or reports in the Europe Renewable Aviation Fuel Industry?
To stay informed about further developments, trends, and reports in the Europe Renewable Aviation Fuel Industry, consider subscribing to industry newsletters, following relevant companies and organizations, or regularly checking reputable industry news sources and publications.
Methodology
Step 1 - Identification of Relevant Samples Size from Population Database


Step 2 - Approaches for Defining Global Market Size (Value, Volume* & Price*)

Note*: In applicable scenarios
Step 3 - Data Sources
Primary Research
- Web Analytics
- Survey Reports
- Research Institute
- Latest Research Reports
- Opinion Leaders
Secondary Research
- Annual Reports
- White Paper
- Latest Press Release
- Industry Association
- Paid Database
- Investor Presentations

Step 4 - Data Triangulation
Involves using different sources of information in order to increase the validity of a study
These sources are likely to be stakeholders in a program - participants, other researchers, program staff, other community members, and so on.
Then we put all data in single framework & apply various statistical tools to find out the dynamic on the market.
During the analysis stage, feedback from the stakeholder groups would be compared to determine areas of agreement as well as areas of divergence


