
Key Insights
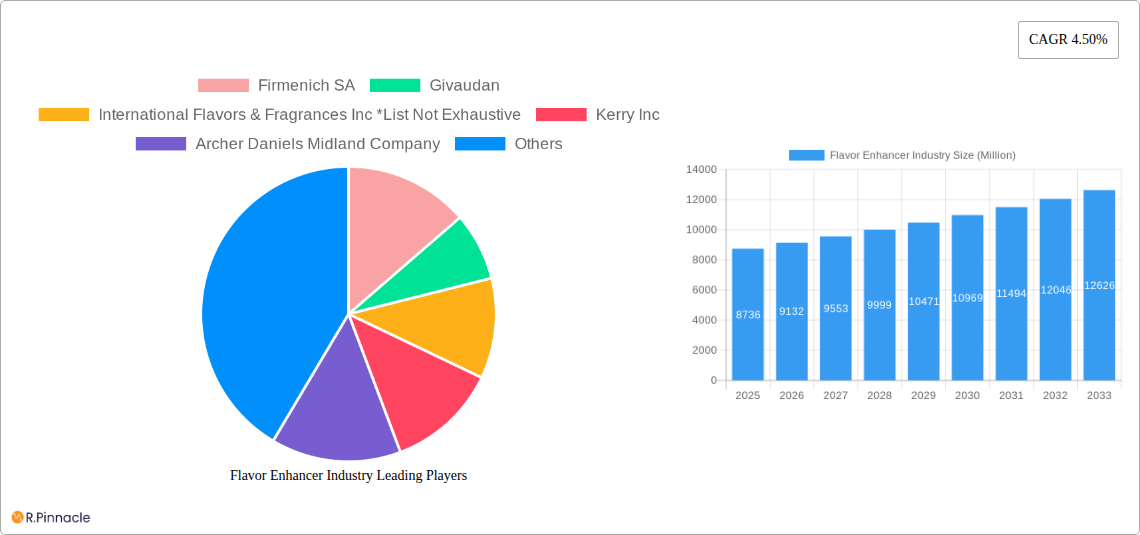
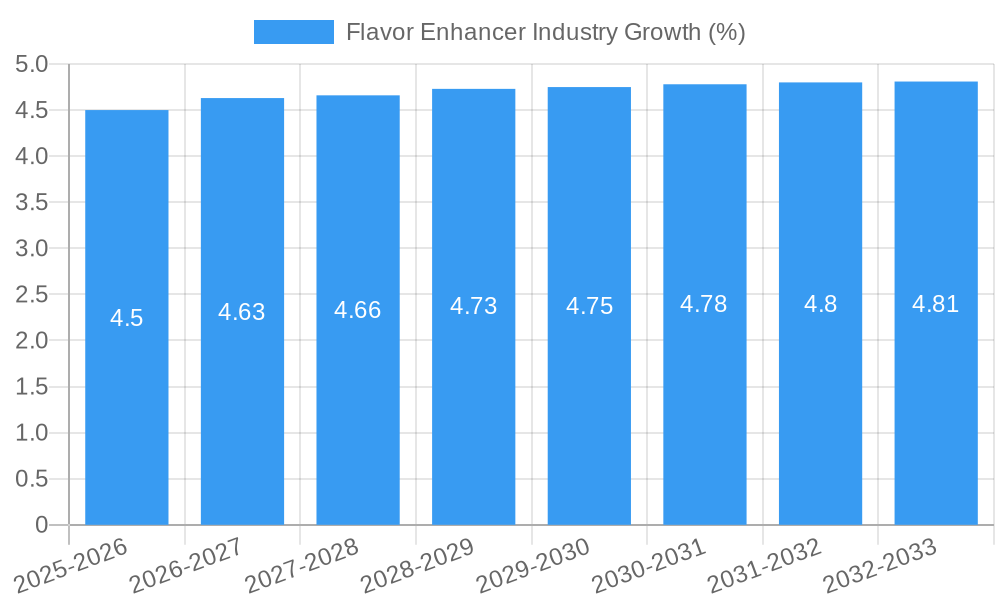
The global flavor enhancer market, currently valued at $8,736 million in 2025, is projected to experience robust growth, driven by increasing demand for convenient and flavorful food products across diverse applications. The compound annual growth rate (CAGR) of 4.50% from 2025 to 2033 indicates a significant expansion in market size, exceeding $12,000 million by the end of the forecast period. Key drivers include the rising popularity of processed foods, particularly in developing economies, the increasing consumer preference for ready-to-eat meals and snacks, and the growing demand for customized flavor profiles to cater to diverse palates. Furthermore, advancements in flavor enhancer technology, leading to the development of more natural and clean-label options, are contributing to market expansion. The savory snacks segment is expected to be a significant revenue contributor due to its high growth potential within the processed food industry. Major players such as Firmenich SA, Givaudan, and International Flavors & Fragrances Inc. are driving innovation through research and development of novel flavor solutions. However, potential restraints include fluctuating raw material prices and increasing health concerns related to excessive consumption of processed foods, necessitating the development of healthier alternatives.
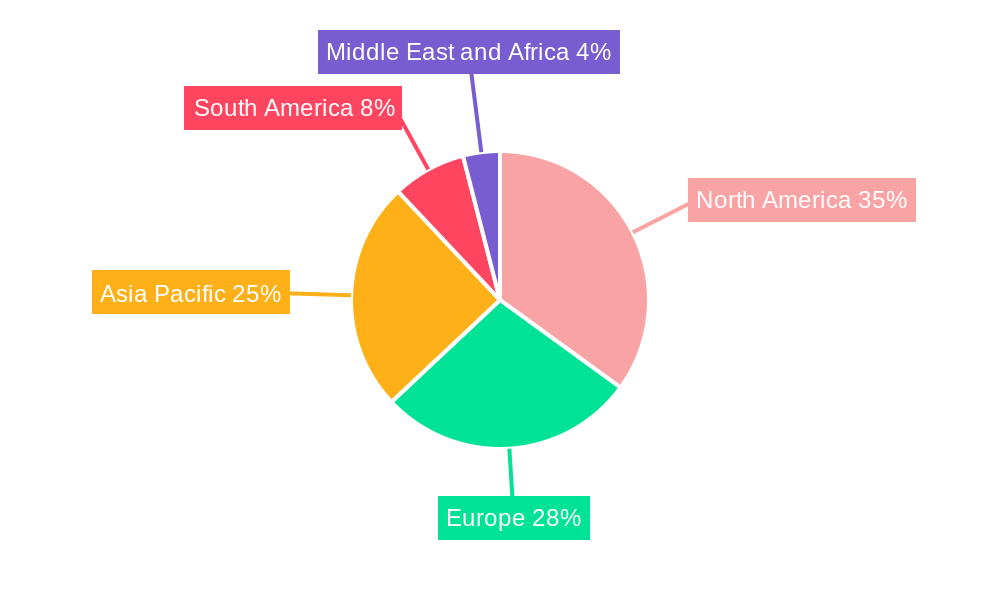
The regional landscape reveals significant market opportunities across North America, Europe, and Asia-Pacific. North America currently holds a substantial market share, fueled by high consumption of processed foods and a developed food industry infrastructure. Asia-Pacific, however, is expected to witness the fastest growth due to rapid urbanization, rising disposable incomes, and expanding food processing industries in countries like China and India. European markets demonstrate a mature but steady growth trajectory, driven by innovation in flavor profiles and increasing demand for natural and organic flavor enhancers. Strategic partnerships, acquisitions, and product diversification are key strategies employed by leading companies to enhance their market position and capitalize on emerging market trends. The continued emphasis on clean-label products and the exploration of novel flavor profiles derived from natural sources will be crucial for sustainable growth in the coming years.
Flavor Enhancer Industry Market Report: 2019-2033
This comprehensive report provides a detailed analysis of the Flavor Enhancer Industry, offering invaluable insights for industry professionals, investors, and strategic decision-makers. The report covers the period from 2019 to 2033, with a focus on the forecast period 2025-2033 and a base year of 2025. Market values are expressed in Millions.
Flavor Enhancer Industry Market Structure & Innovation Trends
The flavor enhancer market is moderately concentrated, with key players such as Firmenich SA, Givaudan, International Flavors & Fragrances Inc., Kerry Inc., Archer Daniels Midland Company, Koninklijke DSM N.V., Ajinomoto Group, Bell Flavors & Fragrances, Symrise AG, Sensient Technologies Corporation, and Corbion NV holding significant market share. The exact market share distribution varies by segment and region, but these companies collectively control a substantial portion of the global market, estimated at xx Million in 2025. Innovation in this sector is driven by consumer demand for natural and clean-label products, growing health consciousness, and evolving culinary trends. Regulatory frameworks concerning food additives and labeling significantly influence product development and market access. The industry also witnesses frequent M&A activity, with deal values reaching xx Million annually in recent years, reflecting the pursuit of market consolidation and technological advancements. Substitutes for flavor enhancers exist but often lack the versatility and cost-effectiveness of established products. End-user demographics, including age, income levels, and cultural preferences, strongly impact consumer choices within different flavor enhancer segments.
- Market Concentration: Moderately concentrated, with top players controlling a significant share.
- Innovation Drivers: Consumer demand for natural and clean-label products, health concerns, culinary trends.
- Regulatory Impact: Stringent food additive regulations impact product development and market entry.
- M&A Activity: Significant M&A activity with annual deal values reaching xx Million.
Flavor Enhancer Industry Market Dynamics & Trends
The flavor enhancer market exhibits a robust growth trajectory, driven by several factors. The rising global population, increasing disposable incomes in developing economies, and the expanding food processing industry fuel demand. Technological advancements, such as precision fermentation and improved extraction techniques, enhance the production efficiency and quality of flavor enhancers. Changing consumer preferences towards convenient, ready-to-eat meals and the popularity of diverse cuisines propel market growth. The competitive landscape is characterized by intense rivalry amongst established players and the emergence of innovative start-ups. Market penetration rates vary across different geographical regions and application segments, with established markets in North America and Europe showing relatively high penetration. The compound annual growth rate (CAGR) for the flavor enhancer market is estimated to be xx% during the forecast period (2025-2033), projecting a market size of xx Million by 2033.
Dominant Regions & Segments in Flavor Enhancer Industry
The Asia-Pacific region dominates the flavor enhancer market, driven by rapid economic growth, population increase, and increasing consumption of processed foods. Within application segments, Savory Snacks and Seasoning & Condiments show the highest growth rates.
Key Drivers in Asia-Pacific:
- Rapid economic growth and rising disposable incomes.
- High population density and increasing consumption of processed foods.
- Expanding food processing and manufacturing industries.
- Supportive government policies promoting food processing and exports.
Dominant Segments: Savory Snacks and Seasoning & Condiments demonstrate significantly higher growth compared to Soups and Noodles and Other Applications, due to factors like convenience, changing consumer preferences, and expanding fast food chains.
Flavor Enhancer Industry Product Innovations
Recent innovations in the flavor enhancer industry focus on natural and clean-label ingredients, responding to growing consumer demand for healthier and more sustainable products. Companies are developing plant-based alternatives to traditional flavor enhancers and exploring novel extraction and production methods to improve efficacy and reduce environmental impact. These innovations provide competitive advantages by offering superior product quality, enhanced functionality, and alignment with consumer preferences for transparency and sustainability. Technological advancements like precision fermentation are boosting product development and enabling the creation of customized flavor profiles.
Report Scope & Segmentation Analysis
This report segments the flavor enhancer market by application: Soups and Noodles, Savory Snacks, Seasoning and Condiments, and Other Applications. Each segment's growth projection, market size, and competitive dynamics are analyzed separately. The Soups and Noodles segment is experiencing steady growth, while Savory Snacks and Seasoning and Condiments segments are witnessing rapid expansion due to increased snack consumption and convenience food demand. The "Other Applications" segment represents a diverse range of uses and demonstrates a moderate growth rate.
Key Drivers of Flavor Enhancer Industry Growth
The flavor enhancer industry's growth is primarily fueled by factors including the expanding food processing industry, increasing demand for convenience foods, growing consumer preference for diverse flavors and improved taste, and technological advancements leading to improved product quality and efficiency. Government regulations and support for the food processing sector further contribute to market expansion.
Challenges in the Flavor Enhancer Industry Sector
The flavor enhancer industry faces challenges such as stringent regulatory requirements for food additives, fluctuating raw material prices impacting profitability, intense competition among established players and new entrants, and potential supply chain disruptions affecting production and distribution. These factors can lead to decreased profitability and hinder market growth, with estimated annual losses of xx Million due to supply chain volatility.
Emerging Opportunities in Flavor Enhancer Industry
Emerging opportunities lie in the development of plant-based and clean-label flavor enhancers, expansion into new geographical markets with high growth potential (particularly in developing economies), and the application of advanced technologies such as artificial intelligence and machine learning to optimize flavor profiles and enhance production processes. Focusing on sustainable and ethical sourcing practices will further enhance market position.
Leading Players in the Flavor Enhancer Industry Market
- Firmenich SA
- Givaudan
- International Flavors & Fragrances Inc.
- Kerry Inc
- Archer Daniels Midland Company
- Koninklijke DSM N.V.
- Ajinomoto Group
- Bell Flavors & Fragrances
- Symrise AG
- Sensient Technologies Corporation
- Corbion NV
Key Developments in Flavor Enhancer Industry
- June 2021: Kerry Group opened a new taste facility in Irapuato, Mexico, expanding its capacity in Latin America.
- May 2022: Givaudan launched NaNino+, a plant-based nitrite alternative for processed meat.
- January 2023: International Flavors & Fragrances Inc. launched ChoozIt Vintage, aiding cheddar cheese aging.
Future Outlook for Flavor Enhancer Industry Market
The flavor enhancer market is poised for continued growth driven by evolving consumer preferences, technological advancements, and expansion into new markets. Strategic collaborations, focus on sustainable practices, and innovation in clean-label products will be key to success in this dynamic sector. The market is projected to reach xx Million by 2033, driven by ongoing growth in emerging economies and a sustained demand for enhanced flavor profiles in food and beverage products.
Flavor Enhancer Industry Segmentation
-
1. Application
- 1.1. Soups and Noodles
- 1.2. Savory Snacks
- 1.3. Seasoning and Condiments
- 1.4. Other Applications
Flavor Enhancer Industry Segmentation By Geography
-
1. North America
- 1.1. United States
- 1.2. Canada
- 1.3. Mexico
- 1.4. Rest of North America
-
2. Europe
- 2.1. Spain
- 2.2. United Kingdom
- 2.3. Germany
- 2.4. France
- 2.5. Italy
- 2.6. Russia
- 2.7. Rest of Europe
-
3. Asia Pacific
- 3.1. China
- 3.2. Japan
- 3.3. India
- 3.4. Australia
- 3.5. Rest of Asia Pacific
-
4. South America
- 4.1. Brazil
- 4.2. Argentina
- 4.3. Rest of South America
-
5. Middle East and Africa
- 5.1. South Africa
- 5.2. Saudi Arabia
- 5.3. Rest of Middle East and Africa
Flavor Enhancer Industry REPORT HIGHLIGHTS
| Aspects | Details |
|---|---|
| Study Period | 2019-2033 |
| Base Year | 2024 |
| Estimated Year | 2025 |
| Forecast Period | 2025-2033 |
| Historical Period | 2019-2024 |
| Growth Rate | CAGR of 4.50% from 2019-2033 |
| Segmentation |
|
Table of Contents
- 1. Introduction
- 1.1. Research Scope
- 1.2. Market Segmentation
- 1.3. Research Methodology
- 1.4. Definitions and Assumptions
- 2. Executive Summary
- 2.1. Introduction
- 3. Market Dynamics
- 3.1. Introduction
- 3.2. Market Drivers
- 3.2.1. Demand for Convenient Ready-to-Eat Food Products; Growing Affinity Toward Ethnic and Organic Frozen Ready Meals
- 3.3. Market Restrains
- 3.3.1. Rising Concerns Over Food Safety and Quality
- 3.4. Market Trends
- 3.4.1. Consumer Preferences Drive Flavors Enhancers Sectors
- 4. Market Factor Analysis
- 4.1. Porters Five Forces
- 4.2. Supply/Value Chain
- 4.3. PESTEL analysis
- 4.4. Market Entropy
- 4.5. Patent/Trademark Analysis
- 5. Global Flavor Enhancer Industry Analysis, Insights and Forecast, 2019-2031
- 5.1. Market Analysis, Insights and Forecast - by Application
- 5.1.1. Soups and Noodles
- 5.1.2. Savory Snacks
- 5.1.3. Seasoning and Condiments
- 5.1.4. Other Applications
- 5.2. Market Analysis, Insights and Forecast - by Region
- 5.2.1. North America
- 5.2.2. Europe
- 5.2.3. Asia Pacific
- 5.2.4. South America
- 5.2.5. Middle East and Africa
- 5.1. Market Analysis, Insights and Forecast - by Application
- 6. North America Flavor Enhancer Industry Analysis, Insights and Forecast, 2019-2031
- 6.1. Market Analysis, Insights and Forecast - by Application
- 6.1.1. Soups and Noodles
- 6.1.2. Savory Snacks
- 6.1.3. Seasoning and Condiments
- 6.1.4. Other Applications
- 6.1. Market Analysis, Insights and Forecast - by Application
- 7. Europe Flavor Enhancer Industry Analysis, Insights and Forecast, 2019-2031
- 7.1. Market Analysis, Insights and Forecast - by Application
- 7.1.1. Soups and Noodles
- 7.1.2. Savory Snacks
- 7.1.3. Seasoning and Condiments
- 7.1.4. Other Applications
- 7.1. Market Analysis, Insights and Forecast - by Application
- 8. Asia Pacific Flavor Enhancer Industry Analysis, Insights and Forecast, 2019-2031
- 8.1. Market Analysis, Insights and Forecast - by Application
- 8.1.1. Soups and Noodles
- 8.1.2. Savory Snacks
- 8.1.3. Seasoning and Condiments
- 8.1.4. Other Applications
- 8.1. Market Analysis, Insights and Forecast - by Application
- 9. South America Flavor Enhancer Industry Analysis, Insights and Forecast, 2019-2031
- 9.1. Market Analysis, Insights and Forecast - by Application
- 9.1.1. Soups and Noodles
- 9.1.2. Savory Snacks
- 9.1.3. Seasoning and Condiments
- 9.1.4. Other Applications
- 9.1. Market Analysis, Insights and Forecast - by Application
- 10. Middle East and Africa Flavor Enhancer Industry Analysis, Insights and Forecast, 2019-2031
- 10.1. Market Analysis, Insights and Forecast - by Application
- 10.1.1. Soups and Noodles
- 10.1.2. Savory Snacks
- 10.1.3. Seasoning and Condiments
- 10.1.4. Other Applications
- 10.1. Market Analysis, Insights and Forecast - by Application
- 11. North America Flavor Enhancer Industry Analysis, Insights and Forecast, 2019-2031
- 11.1. Market Analysis, Insights and Forecast - By Country/Sub-region
- 11.1.1 United States
- 11.1.2 Canada
- 11.1.3 Mexico
- 11.1.4 Rest of North America
- 12. Europe Flavor Enhancer Industry Analysis, Insights and Forecast, 2019-2031
- 12.1. Market Analysis, Insights and Forecast - By Country/Sub-region
- 12.1.1 Spain
- 12.1.2 United Kingdom
- 12.1.3 Germany
- 12.1.4 France
- 12.1.5 Italy
- 12.1.6 Russia
- 12.1.7 Rest of Europe
- 13. Asia Pacific Flavor Enhancer Industry Analysis, Insights and Forecast, 2019-2031
- 13.1. Market Analysis, Insights and Forecast - By Country/Sub-region
- 13.1.1 China
- 13.1.2 Japan
- 13.1.3 India
- 13.1.4 Australia
- 13.1.5 Rest of Asia Pacific
- 14. South America Flavor Enhancer Industry Analysis, Insights and Forecast, 2019-2031
- 14.1. Market Analysis, Insights and Forecast - By Country/Sub-region
- 14.1.1 Brazil
- 14.1.2 Argentina
- 14.1.3 Rest of South America
- 15. Middle East and Africa Flavor Enhancer Industry Analysis, Insights and Forecast, 2019-2031
- 15.1. Market Analysis, Insights and Forecast - By Country/Sub-region
- 15.1.1 South Africa
- 15.1.2 Saudi Arabia
- 15.1.3 Rest of Middle East and Africa
- 16. Competitive Analysis
- 16.1. Global Market Share Analysis 2024
- 16.2. Company Profiles
- 16.2.1 Firmenich SA
- 16.2.1.1. Overview
- 16.2.1.2. Products
- 16.2.1.3. SWOT Analysis
- 16.2.1.4. Recent Developments
- 16.2.1.5. Financials (Based on Availability)
- 16.2.2 Givaudan
- 16.2.2.1. Overview
- 16.2.2.2. Products
- 16.2.2.3. SWOT Analysis
- 16.2.2.4. Recent Developments
- 16.2.2.5. Financials (Based on Availability)
- 16.2.3 International Flavors & Fragrances Inc *List Not Exhaustive
- 16.2.3.1. Overview
- 16.2.3.2. Products
- 16.2.3.3. SWOT Analysis
- 16.2.3.4. Recent Developments
- 16.2.3.5. Financials (Based on Availability)
- 16.2.4 Kerry Inc
- 16.2.4.1. Overview
- 16.2.4.2. Products
- 16.2.4.3. SWOT Analysis
- 16.2.4.4. Recent Developments
- 16.2.4.5. Financials (Based on Availability)
- 16.2.5 Archer Daniels Midland Company
- 16.2.5.1. Overview
- 16.2.5.2. Products
- 16.2.5.3. SWOT Analysis
- 16.2.5.4. Recent Developments
- 16.2.5.5. Financials (Based on Availability)
- 16.2.6 Koninklijke DSM N V
- 16.2.6.1. Overview
- 16.2.6.2. Products
- 16.2.6.3. SWOT Analysis
- 16.2.6.4. Recent Developments
- 16.2.6.5. Financials (Based on Availability)
- 16.2.7 Ajinomoto Group
- 16.2.7.1. Overview
- 16.2.7.2. Products
- 16.2.7.3. SWOT Analysis
- 16.2.7.4. Recent Developments
- 16.2.7.5. Financials (Based on Availability)
- 16.2.8 Bell Flavors & Fragrances
- 16.2.8.1. Overview
- 16.2.8.2. Products
- 16.2.8.3. SWOT Analysis
- 16.2.8.4. Recent Developments
- 16.2.8.5. Financials (Based on Availability)
- 16.2.9 Symrise AG
- 16.2.9.1. Overview
- 16.2.9.2. Products
- 16.2.9.3. SWOT Analysis
- 16.2.9.4. Recent Developments
- 16.2.9.5. Financials (Based on Availability)
- 16.2.10 Sensient Technologies Corporation
- 16.2.10.1. Overview
- 16.2.10.2. Products
- 16.2.10.3. SWOT Analysis
- 16.2.10.4. Recent Developments
- 16.2.10.5. Financials (Based on Availability)
- 16.2.11 Corbion NV
- 16.2.11.1. Overview
- 16.2.11.2. Products
- 16.2.11.3. SWOT Analysis
- 16.2.11.4. Recent Developments
- 16.2.11.5. Financials (Based on Availability)
- 16.2.1 Firmenich SA
List of Figures
- Figure 1: Global Flavor Enhancer Industry Revenue Breakdown (Million, %) by Region 2024 & 2032
- Figure 2: North America Flavor Enhancer Industry Revenue (Million), by Country 2024 & 2032
- Figure 3: North America Flavor Enhancer Industry Revenue Share (%), by Country 2024 & 2032
- Figure 4: Europe Flavor Enhancer Industry Revenue (Million), by Country 2024 & 2032
- Figure 5: Europe Flavor Enhancer Industry Revenue Share (%), by Country 2024 & 2032
- Figure 6: Asia Pacific Flavor Enhancer Industry Revenue (Million), by Country 2024 & 2032
- Figure 7: Asia Pacific Flavor Enhancer Industry Revenue Share (%), by Country 2024 & 2032
- Figure 8: South America Flavor Enhancer Industry Revenue (Million), by Country 2024 & 2032
- Figure 9: South America Flavor Enhancer Industry Revenue Share (%), by Country 2024 & 2032
- Figure 10: Middle East and Africa Flavor Enhancer Industry Revenue (Million), by Country 2024 & 2032
- Figure 11: Middle East and Africa Flavor Enhancer Industry Revenue Share (%), by Country 2024 & 2032
- Figure 12: North America Flavor Enhancer Industry Revenue (Million), by Application 2024 & 2032
- Figure 13: North America Flavor Enhancer Industry Revenue Share (%), by Application 2024 & 2032
- Figure 14: North America Flavor Enhancer Industry Revenue (Million), by Country 2024 & 2032
- Figure 15: North America Flavor Enhancer Industry Revenue Share (%), by Country 2024 & 2032
- Figure 16: Europe Flavor Enhancer Industry Revenue (Million), by Application 2024 & 2032
- Figure 17: Europe Flavor Enhancer Industry Revenue Share (%), by Application 2024 & 2032
- Figure 18: Europe Flavor Enhancer Industry Revenue (Million), by Country 2024 & 2032
- Figure 19: Europe Flavor Enhancer Industry Revenue Share (%), by Country 2024 & 2032
- Figure 20: Asia Pacific Flavor Enhancer Industry Revenue (Million), by Application 2024 & 2032
- Figure 21: Asia Pacific Flavor Enhancer Industry Revenue Share (%), by Application 2024 & 2032
- Figure 22: Asia Pacific Flavor Enhancer Industry Revenue (Million), by Country 2024 & 2032
- Figure 23: Asia Pacific Flavor Enhancer Industry Revenue Share (%), by Country 2024 & 2032
- Figure 24: South America Flavor Enhancer Industry Revenue (Million), by Application 2024 & 2032
- Figure 25: South America Flavor Enhancer Industry Revenue Share (%), by Application 2024 & 2032
- Figure 26: South America Flavor Enhancer Industry Revenue (Million), by Country 2024 & 2032
- Figure 27: South America Flavor Enhancer Industry Revenue Share (%), by Country 2024 & 2032
- Figure 28: Middle East and Africa Flavor Enhancer Industry Revenue (Million), by Application 2024 & 2032
- Figure 29: Middle East and Africa Flavor Enhancer Industry Revenue Share (%), by Application 2024 & 2032
- Figure 30: Middle East and Africa Flavor Enhancer Industry Revenue (Million), by Country 2024 & 2032
- Figure 31: Middle East and Africa Flavor Enhancer Industry Revenue Share (%), by Country 2024 & 2032
List of Tables
- Table 1: Global Flavor Enhancer Industry Revenue Million Forecast, by Region 2019 & 2032
- Table 2: Global Flavor Enhancer Industry Revenue Million Forecast, by Application 2019 & 2032
- Table 3: Global Flavor Enhancer Industry Revenue Million Forecast, by Region 2019 & 2032
- Table 4: Global Flavor Enhancer Industry Revenue Million Forecast, by Country 2019 & 2032
- Table 5: United States Flavor Enhancer Industry Revenue (Million) Forecast, by Application 2019 & 2032
- Table 6: Canada Flavor Enhancer Industry Revenue (Million) Forecast, by Application 2019 & 2032
- Table 7: Mexico Flavor Enhancer Industry Revenue (Million) Forecast, by Application 2019 & 2032
- Table 8: Rest of North America Flavor Enhancer Industry Revenue (Million) Forecast, by Application 2019 & 2032
- Table 9: Global Flavor Enhancer Industry Revenue Million Forecast, by Country 2019 & 2032
- Table 10: Spain Flavor Enhancer Industry Revenue (Million) Forecast, by Application 2019 & 2032
- Table 11: United Kingdom Flavor Enhancer Industry Revenue (Million) Forecast, by Application 2019 & 2032
- Table 12: Germany Flavor Enhancer Industry Revenue (Million) Forecast, by Application 2019 & 2032
- Table 13: France Flavor Enhancer Industry Revenue (Million) Forecast, by Application 2019 & 2032
- Table 14: Italy Flavor Enhancer Industry Revenue (Million) Forecast, by Application 2019 & 2032
- Table 15: Russia Flavor Enhancer Industry Revenue (Million) Forecast, by Application 2019 & 2032
- Table 16: Rest of Europe Flavor Enhancer Industry Revenue (Million) Forecast, by Application 2019 & 2032
- Table 17: Global Flavor Enhancer Industry Revenue Million Forecast, by Country 2019 & 2032
- Table 18: China Flavor Enhancer Industry Revenue (Million) Forecast, by Application 2019 & 2032
- Table 19: Japan Flavor Enhancer Industry Revenue (Million) Forecast, by Application 2019 & 2032
- Table 20: India Flavor Enhancer Industry Revenue (Million) Forecast, by Application 2019 & 2032
- Table 21: Australia Flavor Enhancer Industry Revenue (Million) Forecast, by Application 2019 & 2032
- Table 22: Rest of Asia Pacific Flavor Enhancer Industry Revenue (Million) Forecast, by Application 2019 & 2032
- Table 23: Global Flavor Enhancer Industry Revenue Million Forecast, by Country 2019 & 2032
- Table 24: Brazil Flavor Enhancer Industry Revenue (Million) Forecast, by Application 2019 & 2032
- Table 25: Argentina Flavor Enhancer Industry Revenue (Million) Forecast, by Application 2019 & 2032
- Table 26: Rest of South America Flavor Enhancer Industry Revenue (Million) Forecast, by Application 2019 & 2032
- Table 27: Global Flavor Enhancer Industry Revenue Million Forecast, by Country 2019 & 2032
- Table 28: South Africa Flavor Enhancer Industry Revenue (Million) Forecast, by Application 2019 & 2032
- Table 29: Saudi Arabia Flavor Enhancer Industry Revenue (Million) Forecast, by Application 2019 & 2032
- Table 30: Rest of Middle East and Africa Flavor Enhancer Industry Revenue (Million) Forecast, by Application 2019 & 2032
- Table 31: Global Flavor Enhancer Industry Revenue Million Forecast, by Application 2019 & 2032
- Table 32: Global Flavor Enhancer Industry Revenue Million Forecast, by Country 2019 & 2032
- Table 33: United States Flavor Enhancer Industry Revenue (Million) Forecast, by Application 2019 & 2032
- Table 34: Canada Flavor Enhancer Industry Revenue (Million) Forecast, by Application 2019 & 2032
- Table 35: Mexico Flavor Enhancer Industry Revenue (Million) Forecast, by Application 2019 & 2032
- Table 36: Rest of North America Flavor Enhancer Industry Revenue (Million) Forecast, by Application 2019 & 2032
- Table 37: Global Flavor Enhancer Industry Revenue Million Forecast, by Application 2019 & 2032
- Table 38: Global Flavor Enhancer Industry Revenue Million Forecast, by Country 2019 & 2032
- Table 39: Spain Flavor Enhancer Industry Revenue (Million) Forecast, by Application 2019 & 2032
- Table 40: United Kingdom Flavor Enhancer Industry Revenue (Million) Forecast, by Application 2019 & 2032
- Table 41: Germany Flavor Enhancer Industry Revenue (Million) Forecast, by Application 2019 & 2032
- Table 42: France Flavor Enhancer Industry Revenue (Million) Forecast, by Application 2019 & 2032
- Table 43: Italy Flavor Enhancer Industry Revenue (Million) Forecast, by Application 2019 & 2032
- Table 44: Russia Flavor Enhancer Industry Revenue (Million) Forecast, by Application 2019 & 2032
- Table 45: Rest of Europe Flavor Enhancer Industry Revenue (Million) Forecast, by Application 2019 & 2032
- Table 46: Global Flavor Enhancer Industry Revenue Million Forecast, by Application 2019 & 2032
- Table 47: Global Flavor Enhancer Industry Revenue Million Forecast, by Country 2019 & 2032
- Table 48: China Flavor Enhancer Industry Revenue (Million) Forecast, by Application 2019 & 2032
- Table 49: Japan Flavor Enhancer Industry Revenue (Million) Forecast, by Application 2019 & 2032
- Table 50: India Flavor Enhancer Industry Revenue (Million) Forecast, by Application 2019 & 2032
- Table 51: Australia Flavor Enhancer Industry Revenue (Million) Forecast, by Application 2019 & 2032
- Table 52: Rest of Asia Pacific Flavor Enhancer Industry Revenue (Million) Forecast, by Application 2019 & 2032
- Table 53: Global Flavor Enhancer Industry Revenue Million Forecast, by Application 2019 & 2032
- Table 54: Global Flavor Enhancer Industry Revenue Million Forecast, by Country 2019 & 2032
- Table 55: Brazil Flavor Enhancer Industry Revenue (Million) Forecast, by Application 2019 & 2032
- Table 56: Argentina Flavor Enhancer Industry Revenue (Million) Forecast, by Application 2019 & 2032
- Table 57: Rest of South America Flavor Enhancer Industry Revenue (Million) Forecast, by Application 2019 & 2032
- Table 58: Global Flavor Enhancer Industry Revenue Million Forecast, by Application 2019 & 2032
- Table 59: Global Flavor Enhancer Industry Revenue Million Forecast, by Country 2019 & 2032
- Table 60: South Africa Flavor Enhancer Industry Revenue (Million) Forecast, by Application 2019 & 2032
- Table 61: Saudi Arabia Flavor Enhancer Industry Revenue (Million) Forecast, by Application 2019 & 2032
- Table 62: Rest of Middle East and Africa Flavor Enhancer Industry Revenue (Million) Forecast, by Application 2019 & 2032
Frequently Asked Questions
1. What is the projected Compound Annual Growth Rate (CAGR) of the Flavor Enhancer Industry?
The projected CAGR is approximately 4.50%.
2. Which companies are prominent players in the Flavor Enhancer Industry?
Key companies in the market include Firmenich SA, Givaudan, International Flavors & Fragrances Inc *List Not Exhaustive, Kerry Inc, Archer Daniels Midland Company, Koninklijke DSM N V, Ajinomoto Group, Bell Flavors & Fragrances, Symrise AG, Sensient Technologies Corporation, Corbion NV.
3. What are the main segments of the Flavor Enhancer Industry?
The market segments include Application.
4. Can you provide details about the market size?
The market size is estimated to be USD 8,736 Million as of 2022.
5. What are some drivers contributing to market growth?
Demand for Convenient Ready-to-Eat Food Products; Growing Affinity Toward Ethnic and Organic Frozen Ready Meals.
6. What are the notable trends driving market growth?
Consumer Preferences Drive Flavors Enhancers Sectors.
7. Are there any restraints impacting market growth?
Rising Concerns Over Food Safety and Quality.
8. Can you provide examples of recent developments in the market?
Jan 2023: International Flavors & Fragrances Inc. launched ChoozIt Vintage in the United States and Canadian markets. ChoozIt Vintage might help cheddar cheese manufacturers in overcoming undesirable flavor development during aging, delivering highly consistent pH and texture results throughout the ripening process.
9. What pricing options are available for accessing the report?
Pricing options include single-user, multi-user, and enterprise licenses priced at USD 4750, USD 5250, and USD 8750 respectively.
10. Is the market size provided in terms of value or volume?
The market size is provided in terms of value, measured in Million.
11. Are there any specific market keywords associated with the report?
Yes, the market keyword associated with the report is "Flavor Enhancer Industry," which aids in identifying and referencing the specific market segment covered.
12. How do I determine which pricing option suits my needs best?
The pricing options vary based on user requirements and access needs. Individual users may opt for single-user licenses, while businesses requiring broader access may choose multi-user or enterprise licenses for cost-effective access to the report.
13. Are there any additional resources or data provided in the Flavor Enhancer Industry report?
While the report offers comprehensive insights, it's advisable to review the specific contents or supplementary materials provided to ascertain if additional resources or data are available.
14. How can I stay updated on further developments or reports in the Flavor Enhancer Industry?
To stay informed about further developments, trends, and reports in the Flavor Enhancer Industry, consider subscribing to industry newsletters, following relevant companies and organizations, or regularly checking reputable industry news sources and publications.
Methodology
Step 1 - Identification of Relevant Samples Size from Population Database


Step 2 - Approaches for Defining Global Market Size (Value, Volume* & Price*)

Note*: In applicable scenarios
Step 3 - Data Sources
Primary Research
- Web Analytics
- Survey Reports
- Research Institute
- Latest Research Reports
- Opinion Leaders
Secondary Research
- Annual Reports
- White Paper
- Latest Press Release
- Industry Association
- Paid Database
- Investor Presentations

Step 4 - Data Triangulation
Involves using different sources of information in order to increase the validity of a study
These sources are likely to be stakeholders in a program - participants, other researchers, program staff, other community members, and so on.
Then we put all data in single framework & apply various statistical tools to find out the dynamic on the market.
During the analysis stage, feedback from the stakeholder groups would be compared to determine areas of agreement as well as areas of divergence


