
Key Insights
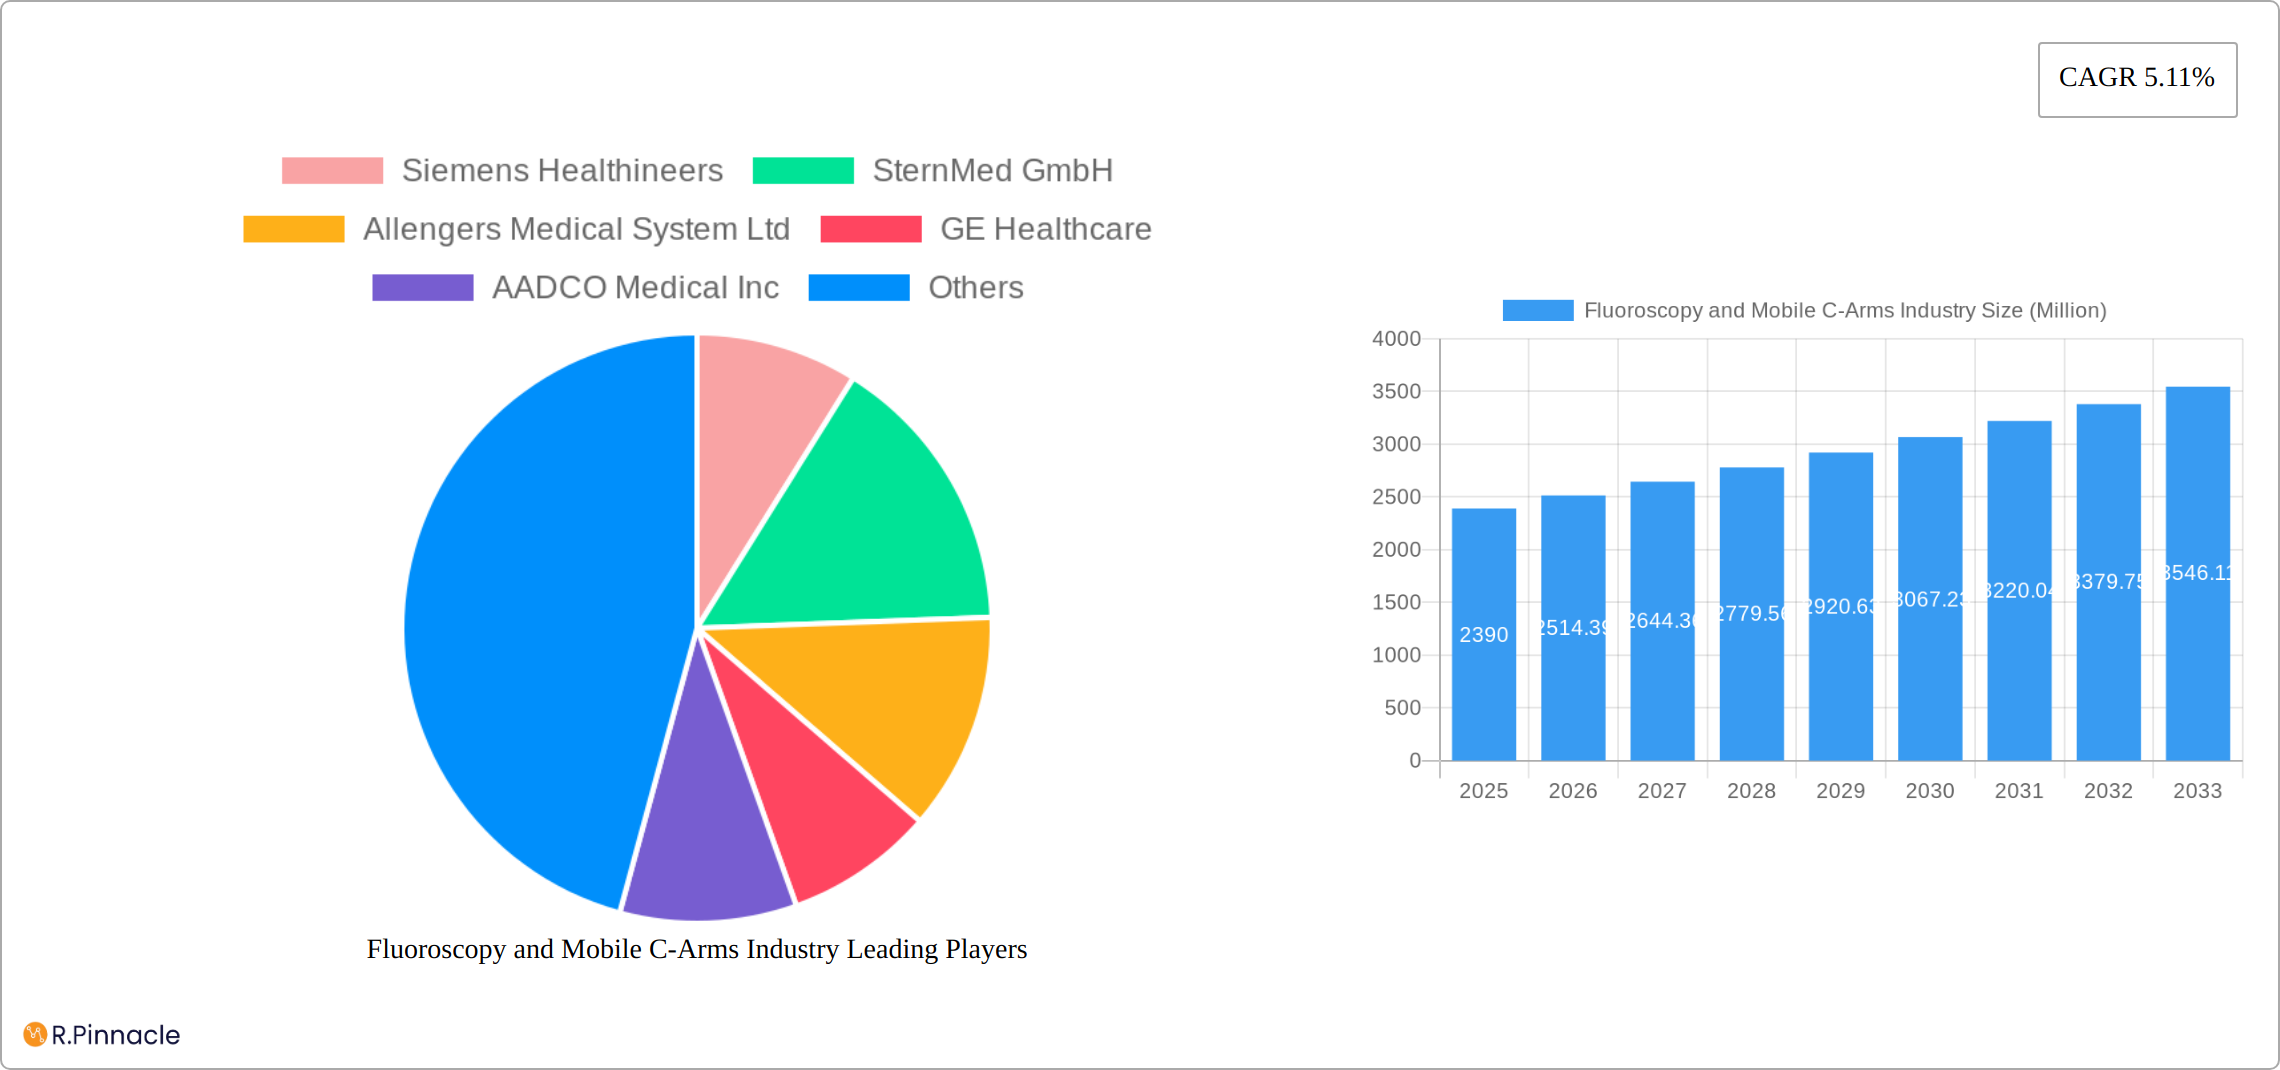
The Fluoroscopy and Mobile C-Arms market, valued at $2.39 billion in 2025, is projected to experience robust growth, driven by a rising global geriatric population requiring more orthopedic and cardiovascular procedures, technological advancements leading to enhanced image quality and reduced radiation exposure, and increasing minimally invasive surgical procedures. The market's Compound Annual Growth Rate (CAGR) of 5.11% from 2025 to 2033 indicates a steady expansion. Key application segments such as cardiology, gastroenterology, and orthopedics and trauma are major contributors to this growth, fueled by the increasing demand for real-time imaging during procedures. The preference for mobile C-arms over fixed systems is also contributing to market expansion, driven by their portability and flexibility in various settings, including operating rooms and emergency departments. Competitive landscape analysis reveals key players like Siemens Healthineers, GE Healthcare, and Philips actively investing in R&D to enhance product features and expand their market share.
Geographical analysis shows North America currently holds a significant market share, owing to advanced healthcare infrastructure and high adoption rates of advanced medical technologies. However, the Asia-Pacific region is poised for substantial growth due to increasing healthcare expenditure, rising disposable incomes, and a growing number of hospitals and clinics. Factors such as stringent regulatory approvals and high costs associated with advanced systems pose challenges to market growth, but these are likely to be mitigated by technological innovations and increasing affordability. The continued focus on improving image quality, reducing radiation exposure, and enhancing surgical precision will be key factors shaping the future trajectory of this market.
Fluoroscopy and Mobile C-Arms Industry Market Report: 2019-2033
This comprehensive report provides an in-depth analysis of the Fluoroscopy and Mobile C-Arms industry, offering invaluable insights for industry professionals, investors, and strategic decision-makers. Covering the period 2019-2033, with a base year of 2025, this report projects market trends, identifies key players, and highlights emerging opportunities in this dynamic sector. The report segments the market by application (Cardiology, Gastroenterology, Neurology, Orthopedics and Trauma, Oncology, Other Applications) and type (Fixed C-arms, Mobile C-arms), providing granular data for informed strategic planning. The global market size is projected to reach xx Million by 2033.
Fluoroscopy and Mobile C-Arms Industry Market Structure & Innovation Trends
The Fluoroscopy and Mobile C-Arms market exhibits a moderately consolidated structure, with key players like Siemens Healthineers, GE Healthcare, and Philips holding significant market share. However, smaller companies and innovative startups are also contributing significantly to market growth. Market share data for 2024 reveals that Siemens Healthineers holds approximately xx% of the market, followed by GE Healthcare with xx% and Philips with xx%. The remaining share is distributed among other players like FUJIFILM Holdings Corporation, Ziehm Imaging GmbH, and Allengers Medical Systems.
Innovation in this market is primarily driven by advancements in image processing, miniaturization, and improved ergonomics. Stringent regulatory frameworks like FDA approvals (as seen with Siemens Healthineers' Artis icono system) influence product development and market entry. The market is witnessing increased M&A activity with several strategic acquisitions aimed at expanding product portfolios and geographic reach. The total value of M&A deals in the last 5 years is estimated at xx Million.
- Key Market Structure Factors: High capital investment required, strong regulatory oversight, increasing demand for advanced imaging solutions.
- Innovation Drivers: Miniaturization of C-arms, improved image quality, AI-powered image analysis, and integration with other medical devices.
- M&A Activity: Focus on enhancing product portfolios, expanding geographical reach and strengthening competitive advantages.

Fluoroscopy and Mobile C-Arms Industry Market Dynamics & Trends
The Fluoroscopy and Mobile C-Arms market is projected to experience significant growth, with a Compound Annual Growth Rate (CAGR) of xx% during the forecast period (2025-2033). This growth is fueled by several factors: the increasing prevalence of chronic diseases requiring interventional procedures, technological advancements leading to improved image quality and reduced procedure times, and rising demand for minimally invasive surgical procedures. Market penetration of mobile C-arms is particularly high in settings requiring portability and flexibility, such as operating rooms and emergency departments.
Technological disruptions, such as the integration of artificial intelligence (AI) for enhanced image analysis and robotic-assisted procedures, are transforming the market landscape. Consumer preferences are increasingly shifting toward systems offering superior image quality, ease of use, and reduced radiation exposure. Competitive dynamics are characterized by intense rivalry among established players and emerging companies, leading to continuous product innovations and price competition.
Dominant Regions & Segments in Fluoroscopy and Mobile C-Arms Industry
North America currently holds the largest market share in the Fluoroscopy and Mobile C-Arms industry due to high healthcare expenditure, advanced medical infrastructure, and early adoption of new technologies. Europe follows as a significant market, while Asia-Pacific is expected to witness the fastest growth rate during the forecast period driven by increasing healthcare spending and a burgeoning medical device market.
- Key Drivers of North American Dominance: High healthcare expenditure, strong regulatory support, and early adoption of advanced technologies.
- Key Drivers of European Market Growth: Well-established healthcare infrastructure, growing demand for minimally invasive procedures, and increasing prevalence of chronic diseases.
- Key Drivers of Asia-Pacific Market Growth: Rising healthcare spending, increasing prevalence of chronic diseases, and growing adoption of advanced medical technologies.
Within the application segment, Cardiology and Orthopedics and Trauma dominate the market due to the high volume of procedures performed in these areas. Mobile C-arms are experiencing higher growth rates compared to fixed C-arms due to their portability and flexibility, making them suitable for various settings.
Fluoroscopy and Mobile C-Arms Industry Product Innovations
Recent years have witnessed significant advancements in Fluoroscopy and Mobile C-arms technology. Key innovations include the development of miniaturized C-arms with improved image quality and reduced radiation exposure. The integration of cone beam CT capabilities enhances diagnostic accuracy and facilitates advanced surgical procedures. Hybrid systems, like Fujifilm's FDR Cross, combining C-arm and portable X-ray functionality, are expanding market applications. These innovations cater to the growing demand for minimally invasive procedures and improved patient outcomes.
Report Scope & Segmentation Analysis
This report segments the Fluoroscopy and Mobile C-Arms market by application (Cardiology, Gastroenterology, Neurology, Orthopedics and Trauma, Oncology, Other Applications) and type (Fixed C-arms, Mobile C-arms). Each segment's market size, growth projections, and competitive dynamics are analyzed in detail. For example, the Cardiology segment is expected to witness significant growth driven by increasing prevalence of cardiovascular diseases. The Mobile C-arms segment is projected to experience higher growth due to its versatility and portability. Detailed analysis of market size and growth projections for each segment is provided within the complete report.
Key Drivers of Fluoroscopy and Mobile C-Arms Industry Growth
Several factors contribute to the growth of the Fluoroscopy and Mobile C-arms industry. Technological advancements, such as improved image quality and reduced radiation exposure, are key drivers. The increasing prevalence of chronic diseases requiring interventional procedures and a growing preference for minimally invasive surgeries also contribute. Furthermore, supportive government regulations and rising healthcare expenditure further fuel market expansion.
Challenges in the Fluoroscopy and Mobile C-Arms Industry Sector
The Fluoroscopy and Mobile C-arms industry faces certain challenges, including the high cost of equipment, stringent regulatory requirements for approval and usage, and intense competition among established players and emerging companies. Supply chain disruptions can also impact production and availability. These challenges impact overall market growth and profitability.
Emerging Opportunities in Fluoroscopy and Mobile C-Arms Industry
Emerging opportunities exist in the integration of AI and machine learning for image analysis, the development of more compact and portable systems for diverse settings, and the expansion into new and emerging markets with growing healthcare infrastructures. The development of advanced image processing techniques to further reduce radiation exposure presents a promising avenue for growth.
Leading Players in the Fluoroscopy and Mobile C-Arms Industry Market
- Siemens Healthineers
- SternMed GmbH
- Allengers Medical System Ltd
- GE Healthcare
- AADCO Medical Inc
- FUJIFILM Holdings Corporation
- Ziehm Imaging GmbH
- BPL Medical Technologies
- Koninklijke Philips NV
- Canon Medical Systems Corporation
- Hologic Corporation
- Shimadzu Corporation
Key Developments in Fluoroscopy and Mobile C-Arms Industry Industry
- July 2022: Siemens Healthineers receives FDA clearance for the Artis icono Ceiling Angiography system, enhancing market competitiveness through advanced features.
- July 2022: Fujifilm Healthcare Americas Corporation launches the FDR Cross, a hybrid C-arm and portable X-ray solution, expanding market reach and application possibilities.
Future Outlook for Fluoroscopy and Mobile C-Arms Industry Market
The Fluoroscopy and Mobile C-arms market is poised for continued growth driven by technological advancements, rising demand for minimally invasive procedures, and increasing healthcare expenditure globally. Strategic partnerships, product diversification, and expansion into new geographic markets will be critical for success. The market is expected to see continued innovation in areas such as AI-powered image analysis and the development of more compact, user-friendly systems.
Fluoroscopy and Mobile C-Arms Industry Segmentation
-
1. Type
- 1.1. Fixed C-arms
-
1.2. Mobile C-arms
- 1.2.1. Full-size C-arms
- 1.2.2. Mini C-arms
-
2. Application
- 2.1. Cardiology
- 2.2. Gastroenterology
- 2.3. Neurology
- 2.4. Orthopedics and Trauma
- 2.5. Oncology
- 2.6. Other Applications
Fluoroscopy and Mobile C-Arms Industry Segmentation By Geography
-
1. North America
- 1.1. United States
- 1.2. Canada
- 1.3. Mexico
-
2. Europe
- 2.1. Germany
- 2.2. United Kingdom
- 2.3. France
- 2.4. Italy
- 2.5. Spain
- 2.6. Rest of Europe
-
3. Asia Pacific
- 3.1. China
- 3.2. Japan
- 3.3. India
- 3.4. Australia
- 3.5. South Korea
- 3.6. Rest of Asia Pacific
-
4. Middle East and Africa
- 4.1. GCC
- 4.2. South Africa
- 4.3. Rest of Middle East and Africa
-
5. South America
- 5.1. Brazil
- 5.2. Argentina
- 5.3. Rest of South America

Fluoroscopy and Mobile C-Arms Industry REPORT HIGHLIGHTS
| Aspects | Details |
|---|---|
| Study Period | 2019-2033 |
| Base Year | 2024 |
| Estimated Year | 2025 |
| Forecast Period | 2025-2033 |
| Historical Period | 2019-2024 |
| Growth Rate | CAGR of 5.11% from 2019-2033 |
| Segmentation |
|
Table of Contents
- 1. Introduction
- 1.1. Research Scope
- 1.2. Market Segmentation
- 1.3. Research Methodology
- 1.4. Definitions and Assumptions
- 2. Executive Summary
- 2.1. Introduction
- 3. Market Dynamics
- 3.1. Introduction
- 3.2. Market Drivers
- 3.2.1. Rising Geriatric Population and Increasing Incidence of Chronic Diseases; Advancements in Maneuverability and Imaging Capabilities; Rising Demand in Emerging Economies for Imaging Technologies
- 3.3. Market Restrains
- 3.3.1. High Procedural and Equipment Costs; Growing Use of Refurbished Devices
- 3.4. Market Trends
- 3.4.1. Mini C-arm Segment is Expected to Show Better Growth During the Forecast Period
- 4. Market Factor Analysis
- 4.1. Porters Five Forces
- 4.2. Supply/Value Chain
- 4.3. PESTEL analysis
- 4.4. Market Entropy
- 4.5. Patent/Trademark Analysis
- 5. Global Fluoroscopy and Mobile C-Arms Industry Analysis, Insights and Forecast, 2019-2031
- 5.1. Market Analysis, Insights and Forecast - by Type
- 5.1.1. Fixed C-arms
- 5.1.2. Mobile C-arms
- 5.1.2.1. Full-size C-arms
- 5.1.2.2. Mini C-arms
- 5.2. Market Analysis, Insights and Forecast - by Application
- 5.2.1. Cardiology
- 5.2.2. Gastroenterology
- 5.2.3. Neurology
- 5.2.4. Orthopedics and Trauma
- 5.2.5. Oncology
- 5.2.6. Other Applications
- 5.3. Market Analysis, Insights and Forecast - by Region
- 5.3.1. North America
- 5.3.2. Europe
- 5.3.3. Asia Pacific
- 5.3.4. Middle East and Africa
- 5.3.5. South America
- 5.1. Market Analysis, Insights and Forecast - by Type
- 6. North America Fluoroscopy and Mobile C-Arms Industry Analysis, Insights and Forecast, 2019-2031
- 6.1. Market Analysis, Insights and Forecast - by Type
- 6.1.1. Fixed C-arms
- 6.1.2. Mobile C-arms
- 6.1.2.1. Full-size C-arms
- 6.1.2.2. Mini C-arms
- 6.2. Market Analysis, Insights and Forecast - by Application
- 6.2.1. Cardiology
- 6.2.2. Gastroenterology
- 6.2.3. Neurology
- 6.2.4. Orthopedics and Trauma
- 6.2.5. Oncology
- 6.2.6. Other Applications
- 6.1. Market Analysis, Insights and Forecast - by Type
- 7. Europe Fluoroscopy and Mobile C-Arms Industry Analysis, Insights and Forecast, 2019-2031
- 7.1. Market Analysis, Insights and Forecast - by Type
- 7.1.1. Fixed C-arms
- 7.1.2. Mobile C-arms
- 7.1.2.1. Full-size C-arms
- 7.1.2.2. Mini C-arms
- 7.2. Market Analysis, Insights and Forecast - by Application
- 7.2.1. Cardiology
- 7.2.2. Gastroenterology
- 7.2.3. Neurology
- 7.2.4. Orthopedics and Trauma
- 7.2.5. Oncology
- 7.2.6. Other Applications
- 7.1. Market Analysis, Insights and Forecast - by Type
- 8. Asia Pacific Fluoroscopy and Mobile C-Arms Industry Analysis, Insights and Forecast, 2019-2031
- 8.1. Market Analysis, Insights and Forecast - by Type
- 8.1.1. Fixed C-arms
- 8.1.2. Mobile C-arms
- 8.1.2.1. Full-size C-arms
- 8.1.2.2. Mini C-arms
- 8.2. Market Analysis, Insights and Forecast - by Application
- 8.2.1. Cardiology
- 8.2.2. Gastroenterology
- 8.2.3. Neurology
- 8.2.4. Orthopedics and Trauma
- 8.2.5. Oncology
- 8.2.6. Other Applications
- 8.1. Market Analysis, Insights and Forecast - by Type
- 9. Middle East and Africa Fluoroscopy and Mobile C-Arms Industry Analysis, Insights and Forecast, 2019-2031
- 9.1. Market Analysis, Insights and Forecast - by Type
- 9.1.1. Fixed C-arms
- 9.1.2. Mobile C-arms
- 9.1.2.1. Full-size C-arms
- 9.1.2.2. Mini C-arms
- 9.2. Market Analysis, Insights and Forecast - by Application
- 9.2.1. Cardiology
- 9.2.2. Gastroenterology
- 9.2.3. Neurology
- 9.2.4. Orthopedics and Trauma
- 9.2.5. Oncology
- 9.2.6. Other Applications
- 9.1. Market Analysis, Insights and Forecast - by Type
- 10. South America Fluoroscopy and Mobile C-Arms Industry Analysis, Insights and Forecast, 2019-2031
- 10.1. Market Analysis, Insights and Forecast - by Type
- 10.1.1. Fixed C-arms
- 10.1.2. Mobile C-arms
- 10.1.2.1. Full-size C-arms
- 10.1.2.2. Mini C-arms
- 10.2. Market Analysis, Insights and Forecast - by Application
- 10.2.1. Cardiology
- 10.2.2. Gastroenterology
- 10.2.3. Neurology
- 10.2.4. Orthopedics and Trauma
- 10.2.5. Oncology
- 10.2.6. Other Applications
- 10.1. Market Analysis, Insights and Forecast - by Type
- 11. North America Fluoroscopy and Mobile C-Arms Industry Analysis, Insights and Forecast, 2019-2031
- 11.1. Market Analysis, Insights and Forecast - By Country/Sub-region
- 11.1.1 United States
- 11.1.2 Canada
- 11.1.3 Mexico
- 12. Europe Fluoroscopy and Mobile C-Arms Industry Analysis, Insights and Forecast, 2019-2031
- 12.1. Market Analysis, Insights and Forecast - By Country/Sub-region
- 12.1.1 Germany
- 12.1.2 United Kingdom
- 12.1.3 France
- 12.1.4 Italy
- 12.1.5 Spain
- 12.1.6 Rest of Europe
- 13. Asia Pacific Fluoroscopy and Mobile C-Arms Industry Analysis, Insights and Forecast, 2019-2031
- 13.1. Market Analysis, Insights and Forecast - By Country/Sub-region
- 13.1.1 China
- 13.1.2 Japan
- 13.1.3 India
- 13.1.4 Australia
- 13.1.5 South Korea
- 13.1.6 Rest of Asia Pacific
- 14. Middle East and Africa Fluoroscopy and Mobile C-Arms Industry Analysis, Insights and Forecast, 2019-2031
- 14.1. Market Analysis, Insights and Forecast - By Country/Sub-region
- 14.1.1 GCC
- 14.1.2 South Africa
- 14.1.3 Rest of Middle East and Africa
- 15. South America Fluoroscopy and Mobile C-Arms Industry Analysis, Insights and Forecast, 2019-2031
- 15.1. Market Analysis, Insights and Forecast - By Country/Sub-region
- 15.1.1 Brazil
- 15.1.2 Argentina
- 15.1.3 Rest of South America
- 16. Competitive Analysis
- 16.1. Global Market Share Analysis 2024
- 16.2. Company Profiles
- 16.2.1 Siemens Healthineers
- 16.2.1.1. Overview
- 16.2.1.2. Products
- 16.2.1.3. SWOT Analysis
- 16.2.1.4. Recent Developments
- 16.2.1.5. Financials (Based on Availability)
- 16.2.2 SternMed GmbH
- 16.2.2.1. Overview
- 16.2.2.2. Products
- 16.2.2.3. SWOT Analysis
- 16.2.2.4. Recent Developments
- 16.2.2.5. Financials (Based on Availability)
- 16.2.3 Allengers Medical System Ltd
- 16.2.3.1. Overview
- 16.2.3.2. Products
- 16.2.3.3. SWOT Analysis
- 16.2.3.4. Recent Developments
- 16.2.3.5. Financials (Based on Availability)
- 16.2.4 GE Healthcare
- 16.2.4.1. Overview
- 16.2.4.2. Products
- 16.2.4.3. SWOT Analysis
- 16.2.4.4. Recent Developments
- 16.2.4.5. Financials (Based on Availability)
- 16.2.5 AADCO Medical Inc
- 16.2.5.1. Overview
- 16.2.5.2. Products
- 16.2.5.3. SWOT Analysis
- 16.2.5.4. Recent Developments
- 16.2.5.5. Financials (Based on Availability)
- 16.2.6 FUJIFILM Holdings Corporation
- 16.2.6.1. Overview
- 16.2.6.2. Products
- 16.2.6.3. SWOT Analysis
- 16.2.6.4. Recent Developments
- 16.2.6.5. Financials (Based on Availability)
- 16.2.7 Ziehm Imaging GmbH
- 16.2.7.1. Overview
- 16.2.7.2. Products
- 16.2.7.3. SWOT Analysis
- 16.2.7.4. Recent Developments
- 16.2.7.5. Financials (Based on Availability)
- 16.2.8 BPL Medical Technologies
- 16.2.8.1. Overview
- 16.2.8.2. Products
- 16.2.8.3. SWOT Analysis
- 16.2.8.4. Recent Developments
- 16.2.8.5. Financials (Based on Availability)
- 16.2.9 Koninklijke Philips NV
- 16.2.9.1. Overview
- 16.2.9.2. Products
- 16.2.9.3. SWOT Analysis
- 16.2.9.4. Recent Developments
- 16.2.9.5. Financials (Based on Availability)
- 16.2.10 Canon Medical Systems Corporation
- 16.2.10.1. Overview
- 16.2.10.2. Products
- 16.2.10.3. SWOT Analysis
- 16.2.10.4. Recent Developments
- 16.2.10.5. Financials (Based on Availability)
- 16.2.11 Hologic Corporation
- 16.2.11.1. Overview
- 16.2.11.2. Products
- 16.2.11.3. SWOT Analysis
- 16.2.11.4. Recent Developments
- 16.2.11.5. Financials (Based on Availability)
- 16.2.12 Shimadzu Corporation
- 16.2.12.1. Overview
- 16.2.12.2. Products
- 16.2.12.3. SWOT Analysis
- 16.2.12.4. Recent Developments
- 16.2.12.5. Financials (Based on Availability)
- 16.2.1 Siemens Healthineers
List of Figures
- Figure 1: Global Fluoroscopy and Mobile C-Arms Industry Revenue Breakdown (Million, %) by Region 2024 & 2032
- Figure 2: North America Fluoroscopy and Mobile C-Arms Industry Revenue (Million), by Country 2024 & 2032
- Figure 3: North America Fluoroscopy and Mobile C-Arms Industry Revenue Share (%), by Country 2024 & 2032
- Figure 4: Europe Fluoroscopy and Mobile C-Arms Industry Revenue (Million), by Country 2024 & 2032
- Figure 5: Europe Fluoroscopy and Mobile C-Arms Industry Revenue Share (%), by Country 2024 & 2032
- Figure 6: Asia Pacific Fluoroscopy and Mobile C-Arms Industry Revenue (Million), by Country 2024 & 2032
- Figure 7: Asia Pacific Fluoroscopy and Mobile C-Arms Industry Revenue Share (%), by Country 2024 & 2032
- Figure 8: Middle East and Africa Fluoroscopy and Mobile C-Arms Industry Revenue (Million), by Country 2024 & 2032
- Figure 9: Middle East and Africa Fluoroscopy and Mobile C-Arms Industry Revenue Share (%), by Country 2024 & 2032
- Figure 10: South America Fluoroscopy and Mobile C-Arms Industry Revenue (Million), by Country 2024 & 2032
- Figure 11: South America Fluoroscopy and Mobile C-Arms Industry Revenue Share (%), by Country 2024 & 2032
- Figure 12: North America Fluoroscopy and Mobile C-Arms Industry Revenue (Million), by Type 2024 & 2032
- Figure 13: North America Fluoroscopy and Mobile C-Arms Industry Revenue Share (%), by Type 2024 & 2032
- Figure 14: North America Fluoroscopy and Mobile C-Arms Industry Revenue (Million), by Application 2024 & 2032
- Figure 15: North America Fluoroscopy and Mobile C-Arms Industry Revenue Share (%), by Application 2024 & 2032
- Figure 16: North America Fluoroscopy and Mobile C-Arms Industry Revenue (Million), by Country 2024 & 2032
- Figure 17: North America Fluoroscopy and Mobile C-Arms Industry Revenue Share (%), by Country 2024 & 2032
- Figure 18: Europe Fluoroscopy and Mobile C-Arms Industry Revenue (Million), by Type 2024 & 2032
- Figure 19: Europe Fluoroscopy and Mobile C-Arms Industry Revenue Share (%), by Type 2024 & 2032
- Figure 20: Europe Fluoroscopy and Mobile C-Arms Industry Revenue (Million), by Application 2024 & 2032
- Figure 21: Europe Fluoroscopy and Mobile C-Arms Industry Revenue Share (%), by Application 2024 & 2032
- Figure 22: Europe Fluoroscopy and Mobile C-Arms Industry Revenue (Million), by Country 2024 & 2032
- Figure 23: Europe Fluoroscopy and Mobile C-Arms Industry Revenue Share (%), by Country 2024 & 2032
- Figure 24: Asia Pacific Fluoroscopy and Mobile C-Arms Industry Revenue (Million), by Type 2024 & 2032
- Figure 25: Asia Pacific Fluoroscopy and Mobile C-Arms Industry Revenue Share (%), by Type 2024 & 2032
- Figure 26: Asia Pacific Fluoroscopy and Mobile C-Arms Industry Revenue (Million), by Application 2024 & 2032
- Figure 27: Asia Pacific Fluoroscopy and Mobile C-Arms Industry Revenue Share (%), by Application 2024 & 2032
- Figure 28: Asia Pacific Fluoroscopy and Mobile C-Arms Industry Revenue (Million), by Country 2024 & 2032
- Figure 29: Asia Pacific Fluoroscopy and Mobile C-Arms Industry Revenue Share (%), by Country 2024 & 2032
- Figure 30: Middle East and Africa Fluoroscopy and Mobile C-Arms Industry Revenue (Million), by Type 2024 & 2032
- Figure 31: Middle East and Africa Fluoroscopy and Mobile C-Arms Industry Revenue Share (%), by Type 2024 & 2032
- Figure 32: Middle East and Africa Fluoroscopy and Mobile C-Arms Industry Revenue (Million), by Application 2024 & 2032
- Figure 33: Middle East and Africa Fluoroscopy and Mobile C-Arms Industry Revenue Share (%), by Application 2024 & 2032
- Figure 34: Middle East and Africa Fluoroscopy and Mobile C-Arms Industry Revenue (Million), by Country 2024 & 2032
- Figure 35: Middle East and Africa Fluoroscopy and Mobile C-Arms Industry Revenue Share (%), by Country 2024 & 2032
- Figure 36: South America Fluoroscopy and Mobile C-Arms Industry Revenue (Million), by Type 2024 & 2032
- Figure 37: South America Fluoroscopy and Mobile C-Arms Industry Revenue Share (%), by Type 2024 & 2032
- Figure 38: South America Fluoroscopy and Mobile C-Arms Industry Revenue (Million), by Application 2024 & 2032
- Figure 39: South America Fluoroscopy and Mobile C-Arms Industry Revenue Share (%), by Application 2024 & 2032
- Figure 40: South America Fluoroscopy and Mobile C-Arms Industry Revenue (Million), by Country 2024 & 2032
- Figure 41: South America Fluoroscopy and Mobile C-Arms Industry Revenue Share (%), by Country 2024 & 2032
List of Tables
- Table 1: Global Fluoroscopy and Mobile C-Arms Industry Revenue Million Forecast, by Region 2019 & 2032
- Table 2: Global Fluoroscopy and Mobile C-Arms Industry Revenue Million Forecast, by Type 2019 & 2032
- Table 3: Global Fluoroscopy and Mobile C-Arms Industry Revenue Million Forecast, by Application 2019 & 2032
- Table 4: Global Fluoroscopy and Mobile C-Arms Industry Revenue Million Forecast, by Region 2019 & 2032
- Table 5: Global Fluoroscopy and Mobile C-Arms Industry Revenue Million Forecast, by Country 2019 & 2032
- Table 6: United States Fluoroscopy and Mobile C-Arms Industry Revenue (Million) Forecast, by Application 2019 & 2032
- Table 7: Canada Fluoroscopy and Mobile C-Arms Industry Revenue (Million) Forecast, by Application 2019 & 2032
- Table 8: Mexico Fluoroscopy and Mobile C-Arms Industry Revenue (Million) Forecast, by Application 2019 & 2032
- Table 9: Global Fluoroscopy and Mobile C-Arms Industry Revenue Million Forecast, by Country 2019 & 2032
- Table 10: Germany Fluoroscopy and Mobile C-Arms Industry Revenue (Million) Forecast, by Application 2019 & 2032
- Table 11: United Kingdom Fluoroscopy and Mobile C-Arms Industry Revenue (Million) Forecast, by Application 2019 & 2032
- Table 12: France Fluoroscopy and Mobile C-Arms Industry Revenue (Million) Forecast, by Application 2019 & 2032
- Table 13: Italy Fluoroscopy and Mobile C-Arms Industry Revenue (Million) Forecast, by Application 2019 & 2032
- Table 14: Spain Fluoroscopy and Mobile C-Arms Industry Revenue (Million) Forecast, by Application 2019 & 2032
- Table 15: Rest of Europe Fluoroscopy and Mobile C-Arms Industry Revenue (Million) Forecast, by Application 2019 & 2032
- Table 16: Global Fluoroscopy and Mobile C-Arms Industry Revenue Million Forecast, by Country 2019 & 2032
- Table 17: China Fluoroscopy and Mobile C-Arms Industry Revenue (Million) Forecast, by Application 2019 & 2032
- Table 18: Japan Fluoroscopy and Mobile C-Arms Industry Revenue (Million) Forecast, by Application 2019 & 2032
- Table 19: India Fluoroscopy and Mobile C-Arms Industry Revenue (Million) Forecast, by Application 2019 & 2032
- Table 20: Australia Fluoroscopy and Mobile C-Arms Industry Revenue (Million) Forecast, by Application 2019 & 2032
- Table 21: South Korea Fluoroscopy and Mobile C-Arms Industry Revenue (Million) Forecast, by Application 2019 & 2032
- Table 22: Rest of Asia Pacific Fluoroscopy and Mobile C-Arms Industry Revenue (Million) Forecast, by Application 2019 & 2032
- Table 23: Global Fluoroscopy and Mobile C-Arms Industry Revenue Million Forecast, by Country 2019 & 2032
- Table 24: GCC Fluoroscopy and Mobile C-Arms Industry Revenue (Million) Forecast, by Application 2019 & 2032
- Table 25: South Africa Fluoroscopy and Mobile C-Arms Industry Revenue (Million) Forecast, by Application 2019 & 2032
- Table 26: Rest of Middle East and Africa Fluoroscopy and Mobile C-Arms Industry Revenue (Million) Forecast, by Application 2019 & 2032
- Table 27: Global Fluoroscopy and Mobile C-Arms Industry Revenue Million Forecast, by Country 2019 & 2032
- Table 28: Brazil Fluoroscopy and Mobile C-Arms Industry Revenue (Million) Forecast, by Application 2019 & 2032
- Table 29: Argentina Fluoroscopy and Mobile C-Arms Industry Revenue (Million) Forecast, by Application 2019 & 2032
- Table 30: Rest of South America Fluoroscopy and Mobile C-Arms Industry Revenue (Million) Forecast, by Application 2019 & 2032
- Table 31: Global Fluoroscopy and Mobile C-Arms Industry Revenue Million Forecast, by Type 2019 & 2032
- Table 32: Global Fluoroscopy and Mobile C-Arms Industry Revenue Million Forecast, by Application 2019 & 2032
- Table 33: Global Fluoroscopy and Mobile C-Arms Industry Revenue Million Forecast, by Country 2019 & 2032
- Table 34: United States Fluoroscopy and Mobile C-Arms Industry Revenue (Million) Forecast, by Application 2019 & 2032
- Table 35: Canada Fluoroscopy and Mobile C-Arms Industry Revenue (Million) Forecast, by Application 2019 & 2032
- Table 36: Mexico Fluoroscopy and Mobile C-Arms Industry Revenue (Million) Forecast, by Application 2019 & 2032
- Table 37: Global Fluoroscopy and Mobile C-Arms Industry Revenue Million Forecast, by Type 2019 & 2032
- Table 38: Global Fluoroscopy and Mobile C-Arms Industry Revenue Million Forecast, by Application 2019 & 2032
- Table 39: Global Fluoroscopy and Mobile C-Arms Industry Revenue Million Forecast, by Country 2019 & 2032
- Table 40: Germany Fluoroscopy and Mobile C-Arms Industry Revenue (Million) Forecast, by Application 2019 & 2032
- Table 41: United Kingdom Fluoroscopy and Mobile C-Arms Industry Revenue (Million) Forecast, by Application 2019 & 2032
- Table 42: France Fluoroscopy and Mobile C-Arms Industry Revenue (Million) Forecast, by Application 2019 & 2032
- Table 43: Italy Fluoroscopy and Mobile C-Arms Industry Revenue (Million) Forecast, by Application 2019 & 2032
- Table 44: Spain Fluoroscopy and Mobile C-Arms Industry Revenue (Million) Forecast, by Application 2019 & 2032
- Table 45: Rest of Europe Fluoroscopy and Mobile C-Arms Industry Revenue (Million) Forecast, by Application 2019 & 2032
- Table 46: Global Fluoroscopy and Mobile C-Arms Industry Revenue Million Forecast, by Type 2019 & 2032
- Table 47: Global Fluoroscopy and Mobile C-Arms Industry Revenue Million Forecast, by Application 2019 & 2032
- Table 48: Global Fluoroscopy and Mobile C-Arms Industry Revenue Million Forecast, by Country 2019 & 2032
- Table 49: China Fluoroscopy and Mobile C-Arms Industry Revenue (Million) Forecast, by Application 2019 & 2032
- Table 50: Japan Fluoroscopy and Mobile C-Arms Industry Revenue (Million) Forecast, by Application 2019 & 2032
- Table 51: India Fluoroscopy and Mobile C-Arms Industry Revenue (Million) Forecast, by Application 2019 & 2032
- Table 52: Australia Fluoroscopy and Mobile C-Arms Industry Revenue (Million) Forecast, by Application 2019 & 2032
- Table 53: South Korea Fluoroscopy and Mobile C-Arms Industry Revenue (Million) Forecast, by Application 2019 & 2032
- Table 54: Rest of Asia Pacific Fluoroscopy and Mobile C-Arms Industry Revenue (Million) Forecast, by Application 2019 & 2032
- Table 55: Global Fluoroscopy and Mobile C-Arms Industry Revenue Million Forecast, by Type 2019 & 2032
- Table 56: Global Fluoroscopy and Mobile C-Arms Industry Revenue Million Forecast, by Application 2019 & 2032
- Table 57: Global Fluoroscopy and Mobile C-Arms Industry Revenue Million Forecast, by Country 2019 & 2032
- Table 58: GCC Fluoroscopy and Mobile C-Arms Industry Revenue (Million) Forecast, by Application 2019 & 2032
- Table 59: South Africa Fluoroscopy and Mobile C-Arms Industry Revenue (Million) Forecast, by Application 2019 & 2032
- Table 60: Rest of Middle East and Africa Fluoroscopy and Mobile C-Arms Industry Revenue (Million) Forecast, by Application 2019 & 2032
- Table 61: Global Fluoroscopy and Mobile C-Arms Industry Revenue Million Forecast, by Type 2019 & 2032
- Table 62: Global Fluoroscopy and Mobile C-Arms Industry Revenue Million Forecast, by Application 2019 & 2032
- Table 63: Global Fluoroscopy and Mobile C-Arms Industry Revenue Million Forecast, by Country 2019 & 2032
- Table 64: Brazil Fluoroscopy and Mobile C-Arms Industry Revenue (Million) Forecast, by Application 2019 & 2032
- Table 65: Argentina Fluoroscopy and Mobile C-Arms Industry Revenue (Million) Forecast, by Application 2019 & 2032
- Table 66: Rest of South America Fluoroscopy and Mobile C-Arms Industry Revenue (Million) Forecast, by Application 2019 & 2032
Frequently Asked Questions
1. What is the projected Compound Annual Growth Rate (CAGR) of the Fluoroscopy and Mobile C-Arms Industry?
The projected CAGR is approximately 5.11%.
2. Which companies are prominent players in the Fluoroscopy and Mobile C-Arms Industry?
Key companies in the market include Siemens Healthineers, SternMed GmbH, Allengers Medical System Ltd, GE Healthcare, AADCO Medical Inc, FUJIFILM Holdings Corporation, Ziehm Imaging GmbH, BPL Medical Technologies, Koninklijke Philips NV, Canon Medical Systems Corporation, Hologic Corporation, Shimadzu Corporation.
3. What are the main segments of the Fluoroscopy and Mobile C-Arms Industry?
The market segments include Type, Application.
4. Can you provide details about the market size?
The market size is estimated to be USD 2.39 Million as of 2022.
5. What are some drivers contributing to market growth?
Rising Geriatric Population and Increasing Incidence of Chronic Diseases; Advancements in Maneuverability and Imaging Capabilities; Rising Demand in Emerging Economies for Imaging Technologies.
6. What are the notable trends driving market growth?
Mini C-arm Segment is Expected to Show Better Growth During the Forecast Period.
7. Are there any restraints impacting market growth?
High Procedural and Equipment Costs; Growing Use of Refurbished Devices.
8. Can you provide examples of recent developments in the market?
In July 2022, Siemens Healthineers stated that it has received FDA clearance for the Artis icono Ceiling Angiography system. The ARTIS icono ceiling combines design flexibility with advanced positioning accuracy and intelligent workflows. The new rotational capabilities and simplified cabling of its C-arm permit cone beam CT data acquisitions.
9. What pricing options are available for accessing the report?
Pricing options include single-user, multi-user, and enterprise licenses priced at USD 4750, USD 5250, and USD 8750 respectively.
10. Is the market size provided in terms of value or volume?
The market size is provided in terms of value, measured in Million.
11. Are there any specific market keywords associated with the report?
Yes, the market keyword associated with the report is "Fluoroscopy and Mobile C-Arms Industry," which aids in identifying and referencing the specific market segment covered.
12. How do I determine which pricing option suits my needs best?
The pricing options vary based on user requirements and access needs. Individual users may opt for single-user licenses, while businesses requiring broader access may choose multi-user or enterprise licenses for cost-effective access to the report.
13. Are there any additional resources or data provided in the Fluoroscopy and Mobile C-Arms Industry report?
While the report offers comprehensive insights, it's advisable to review the specific contents or supplementary materials provided to ascertain if additional resources or data are available.
14. How can I stay updated on further developments or reports in the Fluoroscopy and Mobile C-Arms Industry?
To stay informed about further developments, trends, and reports in the Fluoroscopy and Mobile C-Arms Industry, consider subscribing to industry newsletters, following relevant companies and organizations, or regularly checking reputable industry news sources and publications.
Methodology
Step 1 - Identification of Relevant Samples Size from Population Database


Step 2 - Approaches for Defining Global Market Size (Value, Volume* & Price*)

Note*: In applicable scenarios
Step 3 - Data Sources
Primary Research
- Web Analytics
- Survey Reports
- Research Institute
- Latest Research Reports
- Opinion Leaders
Secondary Research
- Annual Reports
- White Paper
- Latest Press Release
- Industry Association
- Paid Database
- Investor Presentations

Step 4 - Data Triangulation
Involves using different sources of information in order to increase the validity of a study
These sources are likely to be stakeholders in a program - participants, other researchers, program staff, other community members, and so on.
Then we put all data in single framework & apply various statistical tools to find out the dynamic on the market.
During the analysis stage, feedback from the stakeholder groups would be compared to determine areas of agreement as well as areas of divergence


