
Key Insights
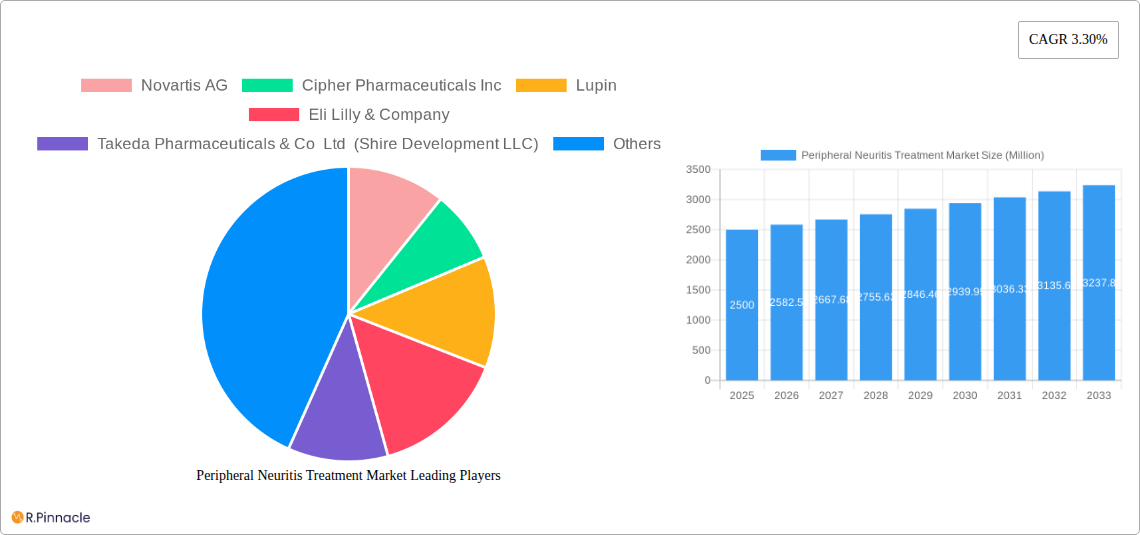
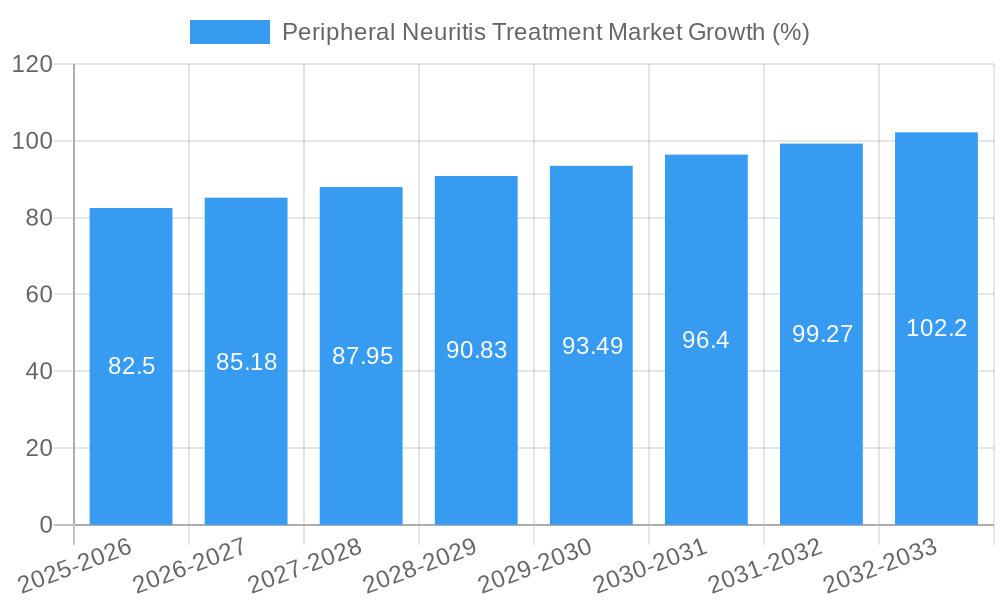
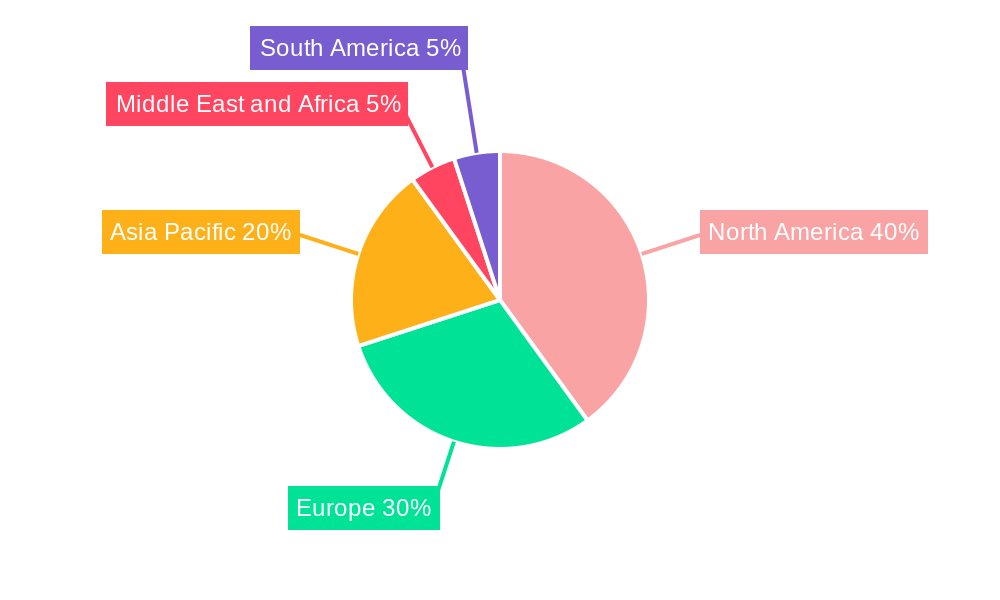
The Peripheral Neuritis Treatment Market is experiencing steady growth, projected at a CAGR of 3.30% from 2025 to 2033. This expansion is driven by the rising prevalence of diabetes, a major contributing factor to peripheral neuropathy, and an aging global population increasingly susceptible to age-related neurological conditions. Increased awareness of peripheral neuropathy symptoms and improved diagnostic capabilities also contribute to market growth. Pharmacological therapies, including pain management medications and anticonvulsants, currently dominate the market, but the demand for non-pharmacological therapies like physiotherapy and lifestyle modifications is growing, reflecting a shift towards holistic treatment approaches. Geographic variations exist, with North America and Europe holding significant market shares due to advanced healthcare infrastructure and higher per capita healthcare expenditure. However, the Asia-Pacific region is poised for substantial growth, fueled by expanding healthcare access and a large diabetic population. Market restraints include the high cost of treatments, potential side effects of pharmacological interventions, and the lack of awareness about peripheral neuropathy in certain regions. The competitive landscape is robust, featuring major pharmaceutical companies like Novartis, Pfizer, and Eli Lilly, alongside several smaller players focused on specialized treatments or innovative therapies.
The market segmentation highlights the importance of tailoring treatments based on underlying causes and patient profiles. Diabetes-related peripheral neuropathy represents a significant portion of the market, underscoring the close link between metabolic disorders and neurological complications. Autoimmune diseases and other conditions also contribute substantially to the demand for effective therapies. Ongoing research and development efforts are focusing on novel treatment modalities, such as targeted therapies and regenerative medicine, aiming to improve patient outcomes and address unmet clinical needs. This research will likely influence future market growth trajectories, with potential for disruptive innovations to shape the competitive landscape. The market’s growth is expected to be further influenced by factors like government healthcare initiatives, advancements in diagnostic techniques, and the increasing focus on patient education and support programs.
This comprehensive report provides a detailed analysis of the Peripheral Neuritis Treatment Market, offering invaluable insights for industry professionals, investors, and researchers. The report covers market size, segmentation, growth drivers, challenges, key players, and future outlook, leveraging data from the historical period (2019-2024), base year (2025), and forecast period (2025-2033). The study period spans 2019-2033, with a focus on the estimated year 2025.
Peripheral Neuritis Treatment Market Market Structure & Innovation Trends
The Peripheral Neuritis Treatment Market exhibits a moderately concentrated structure, with key players like Novartis AG, Eli Lilly & Company, and Pfizer Inc. holding significant market share. However, the market is also characterized by the presence of numerous smaller companies, driving innovation and competition. Market share data for 2025 estimates Novartis at xx%, Eli Lilly at xx%, and Pfizer at xx%, with the remaining share distributed amongst other players. The market is driven by increasing prevalence of peripheral neuritis, fueled by rising diabetes and autoimmune disease rates. Innovation is primarily focused on developing more effective and targeted pharmacological therapies, as well as exploring non-pharmacological approaches like neurostimulation.
- Innovation Drivers: Growing R&D investments, increasing demand for improved treatment outcomes, and the emergence of novel therapeutic modalities.
- Regulatory Framework: Stringent regulatory approvals and clinical trial requirements impact market entry and product development.
- Product Substitutes: Limited effective substitutes exist, making the market relatively less susceptible to substitution effects. However, alternative therapies such as physiotherapy and lifestyle modifications compete for a segment of the market.
- End-User Demographics: The market is largely driven by the aging population, and increasing prevalence of chronic diseases.
- M&A Activities: The past five years have witnessed a moderate level of M&A activity, with deal values estimated to be in the range of xx Million. Examples include [Insert specific M&A examples if available, otherwise remove this bullet point.].
Peripheral Neuritis Treatment Market Market Dynamics & Trends
The Peripheral Neuritis Treatment Market is projected to experience significant growth during the forecast period (2025-2033), with a Compound Annual Growth Rate (CAGR) estimated at xx%. This growth is primarily fueled by several factors. The rising prevalence of diabetes, autoimmune diseases, and other conditions associated with peripheral neuritis is a major driver. Advances in treatment modalities, including the development of novel pharmacological therapies and non-pharmacological approaches such as PENS, are contributing to market expansion. Increasing awareness and better diagnosis of the condition are also facilitating market growth. However, high treatment costs, side effects associated with certain medications, and challenges in achieving complete pain relief pose some restraints. Market penetration of advanced therapies is still relatively low, but is expected to improve gradually as these therapies gain wider acceptance and availability. Consumer preferences increasingly favour non-invasive and minimally invasive treatments, driving adoption of newer technologies like neurostimulation. Competitive dynamics are intense, with companies focused on developing innovative products and expanding their market reach.
Dominant Regions & Segments in Peripheral Neuritis Treatment Market
The North American region currently dominates the Peripheral Neuritis Treatment Market, driven by factors such as high prevalence of target diseases, advanced healthcare infrastructure, and higher healthcare expenditure. However, rapidly growing economies in Asia-Pacific, particularly in India and China, are projected to exhibit significant growth in the coming years.
Key Drivers by Segment:
- Application:
- Diabetes: High prevalence of diabetes worldwide is a major driver.
- Autoimmune Disease: Increasing incidence of autoimmune disorders is boosting demand.
- Thyroid: Thyroid-related peripheral neuritis represents a notable, though smaller segment.
- Others: This segment encompasses various other conditions, contributing to overall market growth.
- Treatment Type:
- Pharmacological Therapies: This segment currently holds the largest market share.
- Non-pharmacological Therapies: Growth in this segment is expected to be driven by technological advancements.
Dominance Analysis: North America’s dominance stems from high per capita healthcare expenditure and well-established healthcare infrastructure. However, developing economies are catching up rapidly, presenting significant opportunities in the years to come.
Peripheral Neuritis Treatment Market Product Innovations
Recent product innovations in the Peripheral Neuritis Treatment Market focus on improving efficacy and reducing side effects of pharmacological therapies. There is also a significant push towards developing more advanced non-pharmacological approaches, such as neurostimulation devices. For example, the FDA approval of DyAnsys' First Relief PENS device and Medtronic's Intellis and Vanta neurostimulators represents significant progress in treating diabetic neuropathic pain. These devices offer less invasive options with improved patient comfort and efficacy. The market is witnessing a shift towards personalized medicine, with a focus on tailoring treatments based on individual patient needs and genetic profiles.
Report Scope & Segmentation Analysis
This report segments the Peripheral Neuritis Treatment Market based on application (Diabetes, Thyroid, Autoimmune Disease, Others) and treatment type (Pharmacological Therapies, Non-pharmacological Therapies). Each segment is analyzed in terms of market size, growth projections, and competitive dynamics. The market for pharmacological therapies is currently largest, with growth projected at xx% CAGR, driven by the continued development of novel drugs. The non-pharmacological therapies segment presents a high-growth opportunity, fueled by technological innovation.
Key Drivers of Peripheral Neuritis Treatment Market Growth
The Peripheral Neuritis Treatment Market growth is driven by factors such as increasing prevalence of chronic diseases like diabetes and autoimmune disorders, rising healthcare expenditure, technological advancements in treatment modalities, and growing awareness among patients. The FDA approvals of novel neurostimulation devices also significantly contributed to market expansion.
Challenges in the Peripheral Neuritis Treatment Market Sector
Significant challenges facing the Peripheral Neuritis Treatment Market include high drug costs, potential side effects of medications, stringent regulatory requirements for new drug approvals, and the complexity of developing effective treatments for diverse forms of peripheral neuritis. These challenges can lead to limited treatment access for some patients, and slow the rate of market growth.
Emerging Opportunities in Peripheral Neuritis Treatment Market
Emerging opportunities include the development of targeted therapies and personalized medicine approaches, expansion into under-served markets, and exploration of novel therapeutic modalities such as gene therapy. The increasing focus on home-based care and telehealth also presents promising opportunities for the market's expansion.
Leading Players in the Peripheral Neuritis Treatment Market Market
- Novartis AG
- Cipher Pharmaceuticals Inc
- Lupin
- Eli Lilly & Company
- Takeda Pharmaceuticals & Co Ltd (Shire Development LLC)
- Viatris
- GSK plc
- Amneal Pharmaceuticals LLC
- Johnson & Johnson (Janssen Pharmaceutical Inc)
- Apotex Inc
- Averitas Pharma Inc
- Pfizer Inc
Key Developments in Peripheral Neuritis Treatment Market Industry
- July 2022: DyAnsys received FDA approval for its First Relief PENS device for diabetic neuropathic pain. This approval marks a significant advancement in non-pharmacological treatment options.
- January 2022: Medtronic PLC received FDA approval for its Intellis and Vanta neurostimulators for chronic pain associated with diabetic peripheral neuropathy (DPN). This further expands the availability of neurostimulation therapies.
Future Outlook for Peripheral Neuritis Treatment Market Market
The Peripheral Neuritis Treatment Market is poised for substantial growth over the forecast period. Continued innovation in both pharmacological and non-pharmacological therapies, coupled with increasing prevalence of associated diseases, will drive market expansion. The focus on personalized medicine and the development of targeted therapies are expected to significantly enhance treatment outcomes and propel market growth. Expanding access to advanced therapies in developing markets also represents a key opportunity.
Peripheral Neuritis Treatment Market Segmentation
-
1. Treatment Type
-
1.1. Pharmacological Therapies
- 1.1.1. Pain Relievers
- 1.1.2. Anti-convulsants
- 1.1.3. Antidepressants
- 1.1.4. Others
-
1.2. Non-pharmacological Therapies
- 1.2.1. Transcutaneous Electrical Nerve Stimulation
- 1.2.2. Plasma Exchange
-
1.1. Pharmacological Therapies
-
2. Application
- 2.1. Diabetes
- 2.2. Thyroid
- 2.3. Autoimmune Disease
- 2.4. Others
Peripheral Neuritis Treatment Market Segmentation By Geography
-
1. North America
- 1.1. United States
- 1.2. Canada
- 1.3. Mexico
-
2. Europe
- 2.1. Germany
- 2.2. United Kingdom
- 2.3. France
- 2.4. Italy
- 2.5. Spain
- 2.6. Rest of Europe
-
3. Asia Pacific
- 3.1. China
- 3.2. Japan
- 3.3. India
- 3.4. Australia
- 3.5. South Korea
- 3.6. Rest of Asia Pacific
-
4. Middle East and Africa
- 4.1. GCC
- 4.2. South Africa
- 4.3. Rest of Middle East and Africa
-
5. South America
- 5.1. Brazil
- 5.2. Argentina
- 5.3. Rest of South America
Peripheral Neuritis Treatment Market REPORT HIGHLIGHTS
| Aspects | Details |
|---|---|
| Study Period | 2019-2033 |
| Base Year | 2024 |
| Estimated Year | 2025 |
| Forecast Period | 2025-2033 |
| Historical Period | 2019-2024 |
| Growth Rate | CAGR of 3.30% from 2019-2033 |
| Segmentation |
|
Table of Contents
- 1. Introduction
- 1.1. Research Scope
- 1.2. Market Segmentation
- 1.3. Research Methodology
- 1.4. Definitions and Assumptions
- 2. Executive Summary
- 2.1. Introduction
- 3. Market Dynamics
- 3.1. Introduction
- 3.2. Market Drivers
- 3.2.1. Growing Burden of Chronic Diseases and Increase in Geriatric Population; Rise in Research and Developments in Peripheral Neuritis Treatment
- 3.3. Market Restrains
- 3.3.1. Stringent Regulatory Framework
- 3.4. Market Trends
- 3.4.1. Diabetes Segment is Expected to Hold a Significant Share in the Peripheral Neuritis Treatment Market
- 4. Market Factor Analysis
- 4.1. Porters Five Forces
- 4.2. Supply/Value Chain
- 4.3. PESTEL analysis
- 4.4. Market Entropy
- 4.5. Patent/Trademark Analysis
- 5. Global Peripheral Neuritis Treatment Market Analysis, Insights and Forecast, 2019-2031
- 5.1. Market Analysis, Insights and Forecast - by Treatment Type
- 5.1.1. Pharmacological Therapies
- 5.1.1.1. Pain Relievers
- 5.1.1.2. Anti-convulsants
- 5.1.1.3. Antidepressants
- 5.1.1.4. Others
- 5.1.2. Non-pharmacological Therapies
- 5.1.2.1. Transcutaneous Electrical Nerve Stimulation
- 5.1.2.2. Plasma Exchange
- 5.1.1. Pharmacological Therapies
- 5.2. Market Analysis, Insights and Forecast - by Application
- 5.2.1. Diabetes
- 5.2.2. Thyroid
- 5.2.3. Autoimmune Disease
- 5.2.4. Others
- 5.3. Market Analysis, Insights and Forecast - by Region
- 5.3.1. North America
- 5.3.2. Europe
- 5.3.3. Asia Pacific
- 5.3.4. Middle East and Africa
- 5.3.5. South America
- 5.1. Market Analysis, Insights and Forecast - by Treatment Type
- 6. North America Peripheral Neuritis Treatment Market Analysis, Insights and Forecast, 2019-2031
- 6.1. Market Analysis, Insights and Forecast - by Treatment Type
- 6.1.1. Pharmacological Therapies
- 6.1.1.1. Pain Relievers
- 6.1.1.2. Anti-convulsants
- 6.1.1.3. Antidepressants
- 6.1.1.4. Others
- 6.1.2. Non-pharmacological Therapies
- 6.1.2.1. Transcutaneous Electrical Nerve Stimulation
- 6.1.2.2. Plasma Exchange
- 6.1.1. Pharmacological Therapies
- 6.2. Market Analysis, Insights and Forecast - by Application
- 6.2.1. Diabetes
- 6.2.2. Thyroid
- 6.2.3. Autoimmune Disease
- 6.2.4. Others
- 6.1. Market Analysis, Insights and Forecast - by Treatment Type
- 7. Europe Peripheral Neuritis Treatment Market Analysis, Insights and Forecast, 2019-2031
- 7.1. Market Analysis, Insights and Forecast - by Treatment Type
- 7.1.1. Pharmacological Therapies
- 7.1.1.1. Pain Relievers
- 7.1.1.2. Anti-convulsants
- 7.1.1.3. Antidepressants
- 7.1.1.4. Others
- 7.1.2. Non-pharmacological Therapies
- 7.1.2.1. Transcutaneous Electrical Nerve Stimulation
- 7.1.2.2. Plasma Exchange
- 7.1.1. Pharmacological Therapies
- 7.2. Market Analysis, Insights and Forecast - by Application
- 7.2.1. Diabetes
- 7.2.2. Thyroid
- 7.2.3. Autoimmune Disease
- 7.2.4. Others
- 7.1. Market Analysis, Insights and Forecast - by Treatment Type
- 8. Asia Pacific Peripheral Neuritis Treatment Market Analysis, Insights and Forecast, 2019-2031
- 8.1. Market Analysis, Insights and Forecast - by Treatment Type
- 8.1.1. Pharmacological Therapies
- 8.1.1.1. Pain Relievers
- 8.1.1.2. Anti-convulsants
- 8.1.1.3. Antidepressants
- 8.1.1.4. Others
- 8.1.2. Non-pharmacological Therapies
- 8.1.2.1. Transcutaneous Electrical Nerve Stimulation
- 8.1.2.2. Plasma Exchange
- 8.1.1. Pharmacological Therapies
- 8.2. Market Analysis, Insights and Forecast - by Application
- 8.2.1. Diabetes
- 8.2.2. Thyroid
- 8.2.3. Autoimmune Disease
- 8.2.4. Others
- 8.1. Market Analysis, Insights and Forecast - by Treatment Type
- 9. Middle East and Africa Peripheral Neuritis Treatment Market Analysis, Insights and Forecast, 2019-2031
- 9.1. Market Analysis, Insights and Forecast - by Treatment Type
- 9.1.1. Pharmacological Therapies
- 9.1.1.1. Pain Relievers
- 9.1.1.2. Anti-convulsants
- 9.1.1.3. Antidepressants
- 9.1.1.4. Others
- 9.1.2. Non-pharmacological Therapies
- 9.1.2.1. Transcutaneous Electrical Nerve Stimulation
- 9.1.2.2. Plasma Exchange
- 9.1.1. Pharmacological Therapies
- 9.2. Market Analysis, Insights and Forecast - by Application
- 9.2.1. Diabetes
- 9.2.2. Thyroid
- 9.2.3. Autoimmune Disease
- 9.2.4. Others
- 9.1. Market Analysis, Insights and Forecast - by Treatment Type
- 10. South America Peripheral Neuritis Treatment Market Analysis, Insights and Forecast, 2019-2031
- 10.1. Market Analysis, Insights and Forecast - by Treatment Type
- 10.1.1. Pharmacological Therapies
- 10.1.1.1. Pain Relievers
- 10.1.1.2. Anti-convulsants
- 10.1.1.3. Antidepressants
- 10.1.1.4. Others
- 10.1.2. Non-pharmacological Therapies
- 10.1.2.1. Transcutaneous Electrical Nerve Stimulation
- 10.1.2.2. Plasma Exchange
- 10.1.1. Pharmacological Therapies
- 10.2. Market Analysis, Insights and Forecast - by Application
- 10.2.1. Diabetes
- 10.2.2. Thyroid
- 10.2.3. Autoimmune Disease
- 10.2.4. Others
- 10.1. Market Analysis, Insights and Forecast - by Treatment Type
- 11. North America Peripheral Neuritis Treatment Market Analysis, Insights and Forecast, 2019-2031
- 11.1. Market Analysis, Insights and Forecast - By Country/Sub-region
- 11.1.1 United States
- 11.1.2 Canada
- 11.1.3 Mexico
- 12. Europe Peripheral Neuritis Treatment Market Analysis, Insights and Forecast, 2019-2031
- 12.1. Market Analysis, Insights and Forecast - By Country/Sub-region
- 12.1.1 Germany
- 12.1.2 United Kingdom
- 12.1.3 France
- 12.1.4 Italy
- 12.1.5 Spain
- 12.1.6 Rest of Europe
- 13. Asia Pacific Peripheral Neuritis Treatment Market Analysis, Insights and Forecast, 2019-2031
- 13.1. Market Analysis, Insights and Forecast - By Country/Sub-region
- 13.1.1 China
- 13.1.2 Japan
- 13.1.3 India
- 13.1.4 Australia
- 13.1.5 South Korea
- 13.1.6 Rest of Asia Pacific
- 14. Middle East and Africa Peripheral Neuritis Treatment Market Analysis, Insights and Forecast, 2019-2031
- 14.1. Market Analysis, Insights and Forecast - By Country/Sub-region
- 14.1.1 GCC
- 14.1.2 South Africa
- 14.1.3 Rest of Middle East and Africa
- 15. South America Peripheral Neuritis Treatment Market Analysis, Insights and Forecast, 2019-2031
- 15.1. Market Analysis, Insights and Forecast - By Country/Sub-region
- 15.1.1 Brazil
- 15.1.2 Argentina
- 15.1.3 Rest of South America
- 16. Competitive Analysis
- 16.1. Global Market Share Analysis 2024
- 16.2. Company Profiles
- 16.2.1 Novartis AG
- 16.2.1.1. Overview
- 16.2.1.2. Products
- 16.2.1.3. SWOT Analysis
- 16.2.1.4. Recent Developments
- 16.2.1.5. Financials (Based on Availability)
- 16.2.2 Cipher Pharmaceuticals Inc
- 16.2.2.1. Overview
- 16.2.2.2. Products
- 16.2.2.3. SWOT Analysis
- 16.2.2.4. Recent Developments
- 16.2.2.5. Financials (Based on Availability)
- 16.2.3 Lupin
- 16.2.3.1. Overview
- 16.2.3.2. Products
- 16.2.3.3. SWOT Analysis
- 16.2.3.4. Recent Developments
- 16.2.3.5. Financials (Based on Availability)
- 16.2.4 Eli Lilly & Company
- 16.2.4.1. Overview
- 16.2.4.2. Products
- 16.2.4.3. SWOT Analysis
- 16.2.4.4. Recent Developments
- 16.2.4.5. Financials (Based on Availability)
- 16.2.5 Takeda Pharmaceuticals & Co Ltd (Shire Development LLC)
- 16.2.5.1. Overview
- 16.2.5.2. Products
- 16.2.5.3. SWOT Analysis
- 16.2.5.4. Recent Developments
- 16.2.5.5. Financials (Based on Availability)
- 16.2.6 Viatris
- 16.2.6.1. Overview
- 16.2.6.2. Products
- 16.2.6.3. SWOT Analysis
- 16.2.6.4. Recent Developments
- 16.2.6.5. Financials (Based on Availability)
- 16.2.7 GSK plc
- 16.2.7.1. Overview
- 16.2.7.2. Products
- 16.2.7.3. SWOT Analysis
- 16.2.7.4. Recent Developments
- 16.2.7.5. Financials (Based on Availability)
- 16.2.8 Amneal Pharmaceuticals LLC
- 16.2.8.1. Overview
- 16.2.8.2. Products
- 16.2.8.3. SWOT Analysis
- 16.2.8.4. Recent Developments
- 16.2.8.5. Financials (Based on Availability)
- 16.2.9 Johnson & Johnson (Janssen Pharmaceutical Inc )
- 16.2.9.1. Overview
- 16.2.9.2. Products
- 16.2.9.3. SWOT Analysis
- 16.2.9.4. Recent Developments
- 16.2.9.5. Financials (Based on Availability)
- 16.2.10 Apotex Inc
- 16.2.10.1. Overview
- 16.2.10.2. Products
- 16.2.10.3. SWOT Analysis
- 16.2.10.4. Recent Developments
- 16.2.10.5. Financials (Based on Availability)
- 16.2.11 Averitas Pharma Inc
- 16.2.11.1. Overview
- 16.2.11.2. Products
- 16.2.11.3. SWOT Analysis
- 16.2.11.4. Recent Developments
- 16.2.11.5. Financials (Based on Availability)
- 16.2.12 Pfizer Inc
- 16.2.12.1. Overview
- 16.2.12.2. Products
- 16.2.12.3. SWOT Analysis
- 16.2.12.4. Recent Developments
- 16.2.12.5. Financials (Based on Availability)
- 16.2.1 Novartis AG
List of Figures
- Figure 1: Global Peripheral Neuritis Treatment Market Revenue Breakdown (Million, %) by Region 2024 & 2032
- Figure 2: Global Peripheral Neuritis Treatment Market Volume Breakdown (K Unit, %) by Region 2024 & 2032
- Figure 3: North America Peripheral Neuritis Treatment Market Revenue (Million), by Country 2024 & 2032
- Figure 4: North America Peripheral Neuritis Treatment Market Volume (K Unit), by Country 2024 & 2032
- Figure 5: North America Peripheral Neuritis Treatment Market Revenue Share (%), by Country 2024 & 2032
- Figure 6: North America Peripheral Neuritis Treatment Market Volume Share (%), by Country 2024 & 2032
- Figure 7: Europe Peripheral Neuritis Treatment Market Revenue (Million), by Country 2024 & 2032
- Figure 8: Europe Peripheral Neuritis Treatment Market Volume (K Unit), by Country 2024 & 2032
- Figure 9: Europe Peripheral Neuritis Treatment Market Revenue Share (%), by Country 2024 & 2032
- Figure 10: Europe Peripheral Neuritis Treatment Market Volume Share (%), by Country 2024 & 2032
- Figure 11: Asia Pacific Peripheral Neuritis Treatment Market Revenue (Million), by Country 2024 & 2032
- Figure 12: Asia Pacific Peripheral Neuritis Treatment Market Volume (K Unit), by Country 2024 & 2032
- Figure 13: Asia Pacific Peripheral Neuritis Treatment Market Revenue Share (%), by Country 2024 & 2032
- Figure 14: Asia Pacific Peripheral Neuritis Treatment Market Volume Share (%), by Country 2024 & 2032
- Figure 15: Middle East and Africa Peripheral Neuritis Treatment Market Revenue (Million), by Country 2024 & 2032
- Figure 16: Middle East and Africa Peripheral Neuritis Treatment Market Volume (K Unit), by Country 2024 & 2032
- Figure 17: Middle East and Africa Peripheral Neuritis Treatment Market Revenue Share (%), by Country 2024 & 2032
- Figure 18: Middle East and Africa Peripheral Neuritis Treatment Market Volume Share (%), by Country 2024 & 2032
- Figure 19: South America Peripheral Neuritis Treatment Market Revenue (Million), by Country 2024 & 2032
- Figure 20: South America Peripheral Neuritis Treatment Market Volume (K Unit), by Country 2024 & 2032
- Figure 21: South America Peripheral Neuritis Treatment Market Revenue Share (%), by Country 2024 & 2032
- Figure 22: South America Peripheral Neuritis Treatment Market Volume Share (%), by Country 2024 & 2032
- Figure 23: North America Peripheral Neuritis Treatment Market Revenue (Million), by Treatment Type 2024 & 2032
- Figure 24: North America Peripheral Neuritis Treatment Market Volume (K Unit), by Treatment Type 2024 & 2032
- Figure 25: North America Peripheral Neuritis Treatment Market Revenue Share (%), by Treatment Type 2024 & 2032
- Figure 26: North America Peripheral Neuritis Treatment Market Volume Share (%), by Treatment Type 2024 & 2032
- Figure 27: North America Peripheral Neuritis Treatment Market Revenue (Million), by Application 2024 & 2032
- Figure 28: North America Peripheral Neuritis Treatment Market Volume (K Unit), by Application 2024 & 2032
- Figure 29: North America Peripheral Neuritis Treatment Market Revenue Share (%), by Application 2024 & 2032
- Figure 30: North America Peripheral Neuritis Treatment Market Volume Share (%), by Application 2024 & 2032
- Figure 31: North America Peripheral Neuritis Treatment Market Revenue (Million), by Country 2024 & 2032
- Figure 32: North America Peripheral Neuritis Treatment Market Volume (K Unit), by Country 2024 & 2032
- Figure 33: North America Peripheral Neuritis Treatment Market Revenue Share (%), by Country 2024 & 2032
- Figure 34: North America Peripheral Neuritis Treatment Market Volume Share (%), by Country 2024 & 2032
- Figure 35: Europe Peripheral Neuritis Treatment Market Revenue (Million), by Treatment Type 2024 & 2032
- Figure 36: Europe Peripheral Neuritis Treatment Market Volume (K Unit), by Treatment Type 2024 & 2032
- Figure 37: Europe Peripheral Neuritis Treatment Market Revenue Share (%), by Treatment Type 2024 & 2032
- Figure 38: Europe Peripheral Neuritis Treatment Market Volume Share (%), by Treatment Type 2024 & 2032
- Figure 39: Europe Peripheral Neuritis Treatment Market Revenue (Million), by Application 2024 & 2032
- Figure 40: Europe Peripheral Neuritis Treatment Market Volume (K Unit), by Application 2024 & 2032
- Figure 41: Europe Peripheral Neuritis Treatment Market Revenue Share (%), by Application 2024 & 2032
- Figure 42: Europe Peripheral Neuritis Treatment Market Volume Share (%), by Application 2024 & 2032
- Figure 43: Europe Peripheral Neuritis Treatment Market Revenue (Million), by Country 2024 & 2032
- Figure 44: Europe Peripheral Neuritis Treatment Market Volume (K Unit), by Country 2024 & 2032
- Figure 45: Europe Peripheral Neuritis Treatment Market Revenue Share (%), by Country 2024 & 2032
- Figure 46: Europe Peripheral Neuritis Treatment Market Volume Share (%), by Country 2024 & 2032
- Figure 47: Asia Pacific Peripheral Neuritis Treatment Market Revenue (Million), by Treatment Type 2024 & 2032
- Figure 48: Asia Pacific Peripheral Neuritis Treatment Market Volume (K Unit), by Treatment Type 2024 & 2032
- Figure 49: Asia Pacific Peripheral Neuritis Treatment Market Revenue Share (%), by Treatment Type 2024 & 2032
- Figure 50: Asia Pacific Peripheral Neuritis Treatment Market Volume Share (%), by Treatment Type 2024 & 2032
- Figure 51: Asia Pacific Peripheral Neuritis Treatment Market Revenue (Million), by Application 2024 & 2032
- Figure 52: Asia Pacific Peripheral Neuritis Treatment Market Volume (K Unit), by Application 2024 & 2032
- Figure 53: Asia Pacific Peripheral Neuritis Treatment Market Revenue Share (%), by Application 2024 & 2032
- Figure 54: Asia Pacific Peripheral Neuritis Treatment Market Volume Share (%), by Application 2024 & 2032
- Figure 55: Asia Pacific Peripheral Neuritis Treatment Market Revenue (Million), by Country 2024 & 2032
- Figure 56: Asia Pacific Peripheral Neuritis Treatment Market Volume (K Unit), by Country 2024 & 2032
- Figure 57: Asia Pacific Peripheral Neuritis Treatment Market Revenue Share (%), by Country 2024 & 2032
- Figure 58: Asia Pacific Peripheral Neuritis Treatment Market Volume Share (%), by Country 2024 & 2032
- Figure 59: Middle East and Africa Peripheral Neuritis Treatment Market Revenue (Million), by Treatment Type 2024 & 2032
- Figure 60: Middle East and Africa Peripheral Neuritis Treatment Market Volume (K Unit), by Treatment Type 2024 & 2032
- Figure 61: Middle East and Africa Peripheral Neuritis Treatment Market Revenue Share (%), by Treatment Type 2024 & 2032
- Figure 62: Middle East and Africa Peripheral Neuritis Treatment Market Volume Share (%), by Treatment Type 2024 & 2032
- Figure 63: Middle East and Africa Peripheral Neuritis Treatment Market Revenue (Million), by Application 2024 & 2032
- Figure 64: Middle East and Africa Peripheral Neuritis Treatment Market Volume (K Unit), by Application 2024 & 2032
- Figure 65: Middle East and Africa Peripheral Neuritis Treatment Market Revenue Share (%), by Application 2024 & 2032
- Figure 66: Middle East and Africa Peripheral Neuritis Treatment Market Volume Share (%), by Application 2024 & 2032
- Figure 67: Middle East and Africa Peripheral Neuritis Treatment Market Revenue (Million), by Country 2024 & 2032
- Figure 68: Middle East and Africa Peripheral Neuritis Treatment Market Volume (K Unit), by Country 2024 & 2032
- Figure 69: Middle East and Africa Peripheral Neuritis Treatment Market Revenue Share (%), by Country 2024 & 2032
- Figure 70: Middle East and Africa Peripheral Neuritis Treatment Market Volume Share (%), by Country 2024 & 2032
- Figure 71: South America Peripheral Neuritis Treatment Market Revenue (Million), by Treatment Type 2024 & 2032
- Figure 72: South America Peripheral Neuritis Treatment Market Volume (K Unit), by Treatment Type 2024 & 2032
- Figure 73: South America Peripheral Neuritis Treatment Market Revenue Share (%), by Treatment Type 2024 & 2032
- Figure 74: South America Peripheral Neuritis Treatment Market Volume Share (%), by Treatment Type 2024 & 2032
- Figure 75: South America Peripheral Neuritis Treatment Market Revenue (Million), by Application 2024 & 2032
- Figure 76: South America Peripheral Neuritis Treatment Market Volume (K Unit), by Application 2024 & 2032
- Figure 77: South America Peripheral Neuritis Treatment Market Revenue Share (%), by Application 2024 & 2032
- Figure 78: South America Peripheral Neuritis Treatment Market Volume Share (%), by Application 2024 & 2032
- Figure 79: South America Peripheral Neuritis Treatment Market Revenue (Million), by Country 2024 & 2032
- Figure 80: South America Peripheral Neuritis Treatment Market Volume (K Unit), by Country 2024 & 2032
- Figure 81: South America Peripheral Neuritis Treatment Market Revenue Share (%), by Country 2024 & 2032
- Figure 82: South America Peripheral Neuritis Treatment Market Volume Share (%), by Country 2024 & 2032
List of Tables
- Table 1: Global Peripheral Neuritis Treatment Market Revenue Million Forecast, by Region 2019 & 2032
- Table 2: Global Peripheral Neuritis Treatment Market Volume K Unit Forecast, by Region 2019 & 2032
- Table 3: Global Peripheral Neuritis Treatment Market Revenue Million Forecast, by Treatment Type 2019 & 2032
- Table 4: Global Peripheral Neuritis Treatment Market Volume K Unit Forecast, by Treatment Type 2019 & 2032
- Table 5: Global Peripheral Neuritis Treatment Market Revenue Million Forecast, by Application 2019 & 2032
- Table 6: Global Peripheral Neuritis Treatment Market Volume K Unit Forecast, by Application 2019 & 2032
- Table 7: Global Peripheral Neuritis Treatment Market Revenue Million Forecast, by Region 2019 & 2032
- Table 8: Global Peripheral Neuritis Treatment Market Volume K Unit Forecast, by Region 2019 & 2032
- Table 9: Global Peripheral Neuritis Treatment Market Revenue Million Forecast, by Country 2019 & 2032
- Table 10: Global Peripheral Neuritis Treatment Market Volume K Unit Forecast, by Country 2019 & 2032
- Table 11: United States Peripheral Neuritis Treatment Market Revenue (Million) Forecast, by Application 2019 & 2032
- Table 12: United States Peripheral Neuritis Treatment Market Volume (K Unit) Forecast, by Application 2019 & 2032
- Table 13: Canada Peripheral Neuritis Treatment Market Revenue (Million) Forecast, by Application 2019 & 2032
- Table 14: Canada Peripheral Neuritis Treatment Market Volume (K Unit) Forecast, by Application 2019 & 2032
- Table 15: Mexico Peripheral Neuritis Treatment Market Revenue (Million) Forecast, by Application 2019 & 2032
- Table 16: Mexico Peripheral Neuritis Treatment Market Volume (K Unit) Forecast, by Application 2019 & 2032
- Table 17: Global Peripheral Neuritis Treatment Market Revenue Million Forecast, by Country 2019 & 2032
- Table 18: Global Peripheral Neuritis Treatment Market Volume K Unit Forecast, by Country 2019 & 2032
- Table 19: Germany Peripheral Neuritis Treatment Market Revenue (Million) Forecast, by Application 2019 & 2032
- Table 20: Germany Peripheral Neuritis Treatment Market Volume (K Unit) Forecast, by Application 2019 & 2032
- Table 21: United Kingdom Peripheral Neuritis Treatment Market Revenue (Million) Forecast, by Application 2019 & 2032
- Table 22: United Kingdom Peripheral Neuritis Treatment Market Volume (K Unit) Forecast, by Application 2019 & 2032
- Table 23: France Peripheral Neuritis Treatment Market Revenue (Million) Forecast, by Application 2019 & 2032
- Table 24: France Peripheral Neuritis Treatment Market Volume (K Unit) Forecast, by Application 2019 & 2032
- Table 25: Italy Peripheral Neuritis Treatment Market Revenue (Million) Forecast, by Application 2019 & 2032
- Table 26: Italy Peripheral Neuritis Treatment Market Volume (K Unit) Forecast, by Application 2019 & 2032
- Table 27: Spain Peripheral Neuritis Treatment Market Revenue (Million) Forecast, by Application 2019 & 2032
- Table 28: Spain Peripheral Neuritis Treatment Market Volume (K Unit) Forecast, by Application 2019 & 2032
- Table 29: Rest of Europe Peripheral Neuritis Treatment Market Revenue (Million) Forecast, by Application 2019 & 2032
- Table 30: Rest of Europe Peripheral Neuritis Treatment Market Volume (K Unit) Forecast, by Application 2019 & 2032
- Table 31: Global Peripheral Neuritis Treatment Market Revenue Million Forecast, by Country 2019 & 2032
- Table 32: Global Peripheral Neuritis Treatment Market Volume K Unit Forecast, by Country 2019 & 2032
- Table 33: China Peripheral Neuritis Treatment Market Revenue (Million) Forecast, by Application 2019 & 2032
- Table 34: China Peripheral Neuritis Treatment Market Volume (K Unit) Forecast, by Application 2019 & 2032
- Table 35: Japan Peripheral Neuritis Treatment Market Revenue (Million) Forecast, by Application 2019 & 2032
- Table 36: Japan Peripheral Neuritis Treatment Market Volume (K Unit) Forecast, by Application 2019 & 2032
- Table 37: India Peripheral Neuritis Treatment Market Revenue (Million) Forecast, by Application 2019 & 2032
- Table 38: India Peripheral Neuritis Treatment Market Volume (K Unit) Forecast, by Application 2019 & 2032
- Table 39: Australia Peripheral Neuritis Treatment Market Revenue (Million) Forecast, by Application 2019 & 2032
- Table 40: Australia Peripheral Neuritis Treatment Market Volume (K Unit) Forecast, by Application 2019 & 2032
- Table 41: South Korea Peripheral Neuritis Treatment Market Revenue (Million) Forecast, by Application 2019 & 2032
- Table 42: South Korea Peripheral Neuritis Treatment Market Volume (K Unit) Forecast, by Application 2019 & 2032
- Table 43: Rest of Asia Pacific Peripheral Neuritis Treatment Market Revenue (Million) Forecast, by Application 2019 & 2032
- Table 44: Rest of Asia Pacific Peripheral Neuritis Treatment Market Volume (K Unit) Forecast, by Application 2019 & 2032
- Table 45: Global Peripheral Neuritis Treatment Market Revenue Million Forecast, by Country 2019 & 2032
- Table 46: Global Peripheral Neuritis Treatment Market Volume K Unit Forecast, by Country 2019 & 2032
- Table 47: GCC Peripheral Neuritis Treatment Market Revenue (Million) Forecast, by Application 2019 & 2032
- Table 48: GCC Peripheral Neuritis Treatment Market Volume (K Unit) Forecast, by Application 2019 & 2032
- Table 49: South Africa Peripheral Neuritis Treatment Market Revenue (Million) Forecast, by Application 2019 & 2032
- Table 50: South Africa Peripheral Neuritis Treatment Market Volume (K Unit) Forecast, by Application 2019 & 2032
- Table 51: Rest of Middle East and Africa Peripheral Neuritis Treatment Market Revenue (Million) Forecast, by Application 2019 & 2032
- Table 52: Rest of Middle East and Africa Peripheral Neuritis Treatment Market Volume (K Unit) Forecast, by Application 2019 & 2032
- Table 53: Global Peripheral Neuritis Treatment Market Revenue Million Forecast, by Country 2019 & 2032
- Table 54: Global Peripheral Neuritis Treatment Market Volume K Unit Forecast, by Country 2019 & 2032
- Table 55: Brazil Peripheral Neuritis Treatment Market Revenue (Million) Forecast, by Application 2019 & 2032
- Table 56: Brazil Peripheral Neuritis Treatment Market Volume (K Unit) Forecast, by Application 2019 & 2032
- Table 57: Argentina Peripheral Neuritis Treatment Market Revenue (Million) Forecast, by Application 2019 & 2032
- Table 58: Argentina Peripheral Neuritis Treatment Market Volume (K Unit) Forecast, by Application 2019 & 2032
- Table 59: Rest of South America Peripheral Neuritis Treatment Market Revenue (Million) Forecast, by Application 2019 & 2032
- Table 60: Rest of South America Peripheral Neuritis Treatment Market Volume (K Unit) Forecast, by Application 2019 & 2032
- Table 61: Global Peripheral Neuritis Treatment Market Revenue Million Forecast, by Treatment Type 2019 & 2032
- Table 62: Global Peripheral Neuritis Treatment Market Volume K Unit Forecast, by Treatment Type 2019 & 2032
- Table 63: Global Peripheral Neuritis Treatment Market Revenue Million Forecast, by Application 2019 & 2032
- Table 64: Global Peripheral Neuritis Treatment Market Volume K Unit Forecast, by Application 2019 & 2032
- Table 65: Global Peripheral Neuritis Treatment Market Revenue Million Forecast, by Country 2019 & 2032
- Table 66: Global Peripheral Neuritis Treatment Market Volume K Unit Forecast, by Country 2019 & 2032
- Table 67: United States Peripheral Neuritis Treatment Market Revenue (Million) Forecast, by Application 2019 & 2032
- Table 68: United States Peripheral Neuritis Treatment Market Volume (K Unit) Forecast, by Application 2019 & 2032
- Table 69: Canada Peripheral Neuritis Treatment Market Revenue (Million) Forecast, by Application 2019 & 2032
- Table 70: Canada Peripheral Neuritis Treatment Market Volume (K Unit) Forecast, by Application 2019 & 2032
- Table 71: Mexico Peripheral Neuritis Treatment Market Revenue (Million) Forecast, by Application 2019 & 2032
- Table 72: Mexico Peripheral Neuritis Treatment Market Volume (K Unit) Forecast, by Application 2019 & 2032
- Table 73: Global Peripheral Neuritis Treatment Market Revenue Million Forecast, by Treatment Type 2019 & 2032
- Table 74: Global Peripheral Neuritis Treatment Market Volume K Unit Forecast, by Treatment Type 2019 & 2032
- Table 75: Global Peripheral Neuritis Treatment Market Revenue Million Forecast, by Application 2019 & 2032
- Table 76: Global Peripheral Neuritis Treatment Market Volume K Unit Forecast, by Application 2019 & 2032
- Table 77: Global Peripheral Neuritis Treatment Market Revenue Million Forecast, by Country 2019 & 2032
- Table 78: Global Peripheral Neuritis Treatment Market Volume K Unit Forecast, by Country 2019 & 2032
- Table 79: Germany Peripheral Neuritis Treatment Market Revenue (Million) Forecast, by Application 2019 & 2032
- Table 80: Germany Peripheral Neuritis Treatment Market Volume (K Unit) Forecast, by Application 2019 & 2032
- Table 81: United Kingdom Peripheral Neuritis Treatment Market Revenue (Million) Forecast, by Application 2019 & 2032
- Table 82: United Kingdom Peripheral Neuritis Treatment Market Volume (K Unit) Forecast, by Application 2019 & 2032
- Table 83: France Peripheral Neuritis Treatment Market Revenue (Million) Forecast, by Application 2019 & 2032
- Table 84: France Peripheral Neuritis Treatment Market Volume (K Unit) Forecast, by Application 2019 & 2032
- Table 85: Italy Peripheral Neuritis Treatment Market Revenue (Million) Forecast, by Application 2019 & 2032
- Table 86: Italy Peripheral Neuritis Treatment Market Volume (K Unit) Forecast, by Application 2019 & 2032
- Table 87: Spain Peripheral Neuritis Treatment Market Revenue (Million) Forecast, by Application 2019 & 2032
- Table 88: Spain Peripheral Neuritis Treatment Market Volume (K Unit) Forecast, by Application 2019 & 2032
- Table 89: Rest of Europe Peripheral Neuritis Treatment Market Revenue (Million) Forecast, by Application 2019 & 2032
- Table 90: Rest of Europe Peripheral Neuritis Treatment Market Volume (K Unit) Forecast, by Application 2019 & 2032
- Table 91: Global Peripheral Neuritis Treatment Market Revenue Million Forecast, by Treatment Type 2019 & 2032
- Table 92: Global Peripheral Neuritis Treatment Market Volume K Unit Forecast, by Treatment Type 2019 & 2032
- Table 93: Global Peripheral Neuritis Treatment Market Revenue Million Forecast, by Application 2019 & 2032
- Table 94: Global Peripheral Neuritis Treatment Market Volume K Unit Forecast, by Application 2019 & 2032
- Table 95: Global Peripheral Neuritis Treatment Market Revenue Million Forecast, by Country 2019 & 2032
- Table 96: Global Peripheral Neuritis Treatment Market Volume K Unit Forecast, by Country 2019 & 2032
- Table 97: China Peripheral Neuritis Treatment Market Revenue (Million) Forecast, by Application 2019 & 2032
- Table 98: China Peripheral Neuritis Treatment Market Volume (K Unit) Forecast, by Application 2019 & 2032
- Table 99: Japan Peripheral Neuritis Treatment Market Revenue (Million) Forecast, by Application 2019 & 2032
- Table 100: Japan Peripheral Neuritis Treatment Market Volume (K Unit) Forecast, by Application 2019 & 2032
- Table 101: India Peripheral Neuritis Treatment Market Revenue (Million) Forecast, by Application 2019 & 2032
- Table 102: India Peripheral Neuritis Treatment Market Volume (K Unit) Forecast, by Application 2019 & 2032
- Table 103: Australia Peripheral Neuritis Treatment Market Revenue (Million) Forecast, by Application 2019 & 2032
- Table 104: Australia Peripheral Neuritis Treatment Market Volume (K Unit) Forecast, by Application 2019 & 2032
- Table 105: South Korea Peripheral Neuritis Treatment Market Revenue (Million) Forecast, by Application 2019 & 2032
- Table 106: South Korea Peripheral Neuritis Treatment Market Volume (K Unit) Forecast, by Application 2019 & 2032
- Table 107: Rest of Asia Pacific Peripheral Neuritis Treatment Market Revenue (Million) Forecast, by Application 2019 & 2032
- Table 108: Rest of Asia Pacific Peripheral Neuritis Treatment Market Volume (K Unit) Forecast, by Application 2019 & 2032
- Table 109: Global Peripheral Neuritis Treatment Market Revenue Million Forecast, by Treatment Type 2019 & 2032
- Table 110: Global Peripheral Neuritis Treatment Market Volume K Unit Forecast, by Treatment Type 2019 & 2032
- Table 111: Global Peripheral Neuritis Treatment Market Revenue Million Forecast, by Application 2019 & 2032
- Table 112: Global Peripheral Neuritis Treatment Market Volume K Unit Forecast, by Application 2019 & 2032
- Table 113: Global Peripheral Neuritis Treatment Market Revenue Million Forecast, by Country 2019 & 2032
- Table 114: Global Peripheral Neuritis Treatment Market Volume K Unit Forecast, by Country 2019 & 2032
- Table 115: GCC Peripheral Neuritis Treatment Market Revenue (Million) Forecast, by Application 2019 & 2032
- Table 116: GCC Peripheral Neuritis Treatment Market Volume (K Unit) Forecast, by Application 2019 & 2032
- Table 117: South Africa Peripheral Neuritis Treatment Market Revenue (Million) Forecast, by Application 2019 & 2032
- Table 118: South Africa Peripheral Neuritis Treatment Market Volume (K Unit) Forecast, by Application 2019 & 2032
- Table 119: Rest of Middle East and Africa Peripheral Neuritis Treatment Market Revenue (Million) Forecast, by Application 2019 & 2032
- Table 120: Rest of Middle East and Africa Peripheral Neuritis Treatment Market Volume (K Unit) Forecast, by Application 2019 & 2032
- Table 121: Global Peripheral Neuritis Treatment Market Revenue Million Forecast, by Treatment Type 2019 & 2032
- Table 122: Global Peripheral Neuritis Treatment Market Volume K Unit Forecast, by Treatment Type 2019 & 2032
- Table 123: Global Peripheral Neuritis Treatment Market Revenue Million Forecast, by Application 2019 & 2032
- Table 124: Global Peripheral Neuritis Treatment Market Volume K Unit Forecast, by Application 2019 & 2032
- Table 125: Global Peripheral Neuritis Treatment Market Revenue Million Forecast, by Country 2019 & 2032
- Table 126: Global Peripheral Neuritis Treatment Market Volume K Unit Forecast, by Country 2019 & 2032
- Table 127: Brazil Peripheral Neuritis Treatment Market Revenue (Million) Forecast, by Application 2019 & 2032
- Table 128: Brazil Peripheral Neuritis Treatment Market Volume (K Unit) Forecast, by Application 2019 & 2032
- Table 129: Argentina Peripheral Neuritis Treatment Market Revenue (Million) Forecast, by Application 2019 & 2032
- Table 130: Argentina Peripheral Neuritis Treatment Market Volume (K Unit) Forecast, by Application 2019 & 2032
- Table 131: Rest of South America Peripheral Neuritis Treatment Market Revenue (Million) Forecast, by Application 2019 & 2032
- Table 132: Rest of South America Peripheral Neuritis Treatment Market Volume (K Unit) Forecast, by Application 2019 & 2032
Frequently Asked Questions
1. What is the projected Compound Annual Growth Rate (CAGR) of the Peripheral Neuritis Treatment Market?
The projected CAGR is approximately 3.30%.
2. Which companies are prominent players in the Peripheral Neuritis Treatment Market?
Key companies in the market include Novartis AG, Cipher Pharmaceuticals Inc, Lupin, Eli Lilly & Company, Takeda Pharmaceuticals & Co Ltd (Shire Development LLC), Viatris, GSK plc, Amneal Pharmaceuticals LLC, Johnson & Johnson (Janssen Pharmaceutical Inc ), Apotex Inc, Averitas Pharma Inc , Pfizer Inc.
3. What are the main segments of the Peripheral Neuritis Treatment Market?
The market segments include Treatment Type, Application.
4. Can you provide details about the market size?
The market size is estimated to be USD XX Million as of 2022.
5. What are some drivers contributing to market growth?
Growing Burden of Chronic Diseases and Increase in Geriatric Population; Rise in Research and Developments in Peripheral Neuritis Treatment.
6. What are the notable trends driving market growth?
Diabetes Segment is Expected to Hold a Significant Share in the Peripheral Neuritis Treatment Market.
7. Are there any restraints impacting market growth?
Stringent Regulatory Framework.
8. Can you provide examples of recent developments in the market?
Jul 2022: DyAnsys received FDA approval for its percutaneous electrical neurostimulation (PENS) device, called First Relief, to treat diabetic neuropathic pain. First Relief is intended for symptomatic relief of chronic, intractable pain related to diabetic peripheral neuropathy through multiple treatments for up to 56 days.
9. What pricing options are available for accessing the report?
Pricing options include single-user, multi-user, and enterprise licenses priced at USD 4750, USD 5250, and USD 8750 respectively.
10. Is the market size provided in terms of value or volume?
The market size is provided in terms of value, measured in Million and volume, measured in K Unit.
11. Are there any specific market keywords associated with the report?
Yes, the market keyword associated with the report is "Peripheral Neuritis Treatment Market," which aids in identifying and referencing the specific market segment covered.
12. How do I determine which pricing option suits my needs best?
The pricing options vary based on user requirements and access needs. Individual users may opt for single-user licenses, while businesses requiring broader access may choose multi-user or enterprise licenses for cost-effective access to the report.
13. Are there any additional resources or data provided in the Peripheral Neuritis Treatment Market report?
While the report offers comprehensive insights, it's advisable to review the specific contents or supplementary materials provided to ascertain if additional resources or data are available.
14. How can I stay updated on further developments or reports in the Peripheral Neuritis Treatment Market?
To stay informed about further developments, trends, and reports in the Peripheral Neuritis Treatment Market, consider subscribing to industry newsletters, following relevant companies and organizations, or regularly checking reputable industry news sources and publications.
Methodology
Step 1 - Identification of Relevant Samples Size from Population Database


Step 2 - Approaches for Defining Global Market Size (Value, Volume* & Price*)

Note*: In applicable scenarios
Step 3 - Data Sources
Primary Research
- Web Analytics
- Survey Reports
- Research Institute
- Latest Research Reports
- Opinion Leaders
Secondary Research
- Annual Reports
- White Paper
- Latest Press Release
- Industry Association
- Paid Database
- Investor Presentations

Step 4 - Data Triangulation
Involves using different sources of information in order to increase the validity of a study
These sources are likely to be stakeholders in a program - participants, other researchers, program staff, other community members, and so on.
Then we put all data in single framework & apply various statistical tools to find out the dynamic on the market.
During the analysis stage, feedback from the stakeholder groups would be compared to determine areas of agreement as well as areas of divergence


