
Key Insights
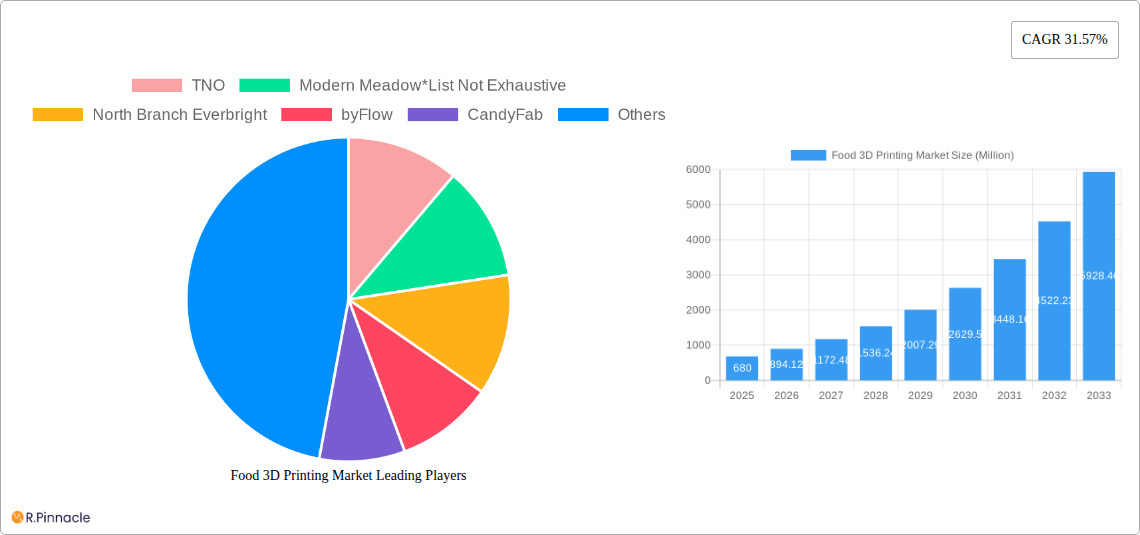
The global food 3D printing market, valued at $0.68 billion in 2025, is poised for significant growth, exhibiting a robust Compound Annual Growth Rate (CAGR) of 31.57% from 2025 to 2033. This expansion is driven by several key factors. Increasing demand for personalized nutrition and customized food products fuels the adoption of 3D printing technology across diverse sectors, including confectionery, bakery, and meat and seafood. The ability to create intricate designs, reduce food waste through precise ingredient usage, and cater to specific dietary needs or allergies significantly enhances consumer appeal. Furthermore, advancements in printing materials and software are continuously expanding the possibilities of food 3D printing, from creating complex textures and flavors to streamlining production processes for both commercial and residential applications. The rise of innovative food startups and the growing interest from established food manufacturers are further boosting market growth. Government initiatives promoting technological advancements in the food industry also contribute to this upward trajectory.
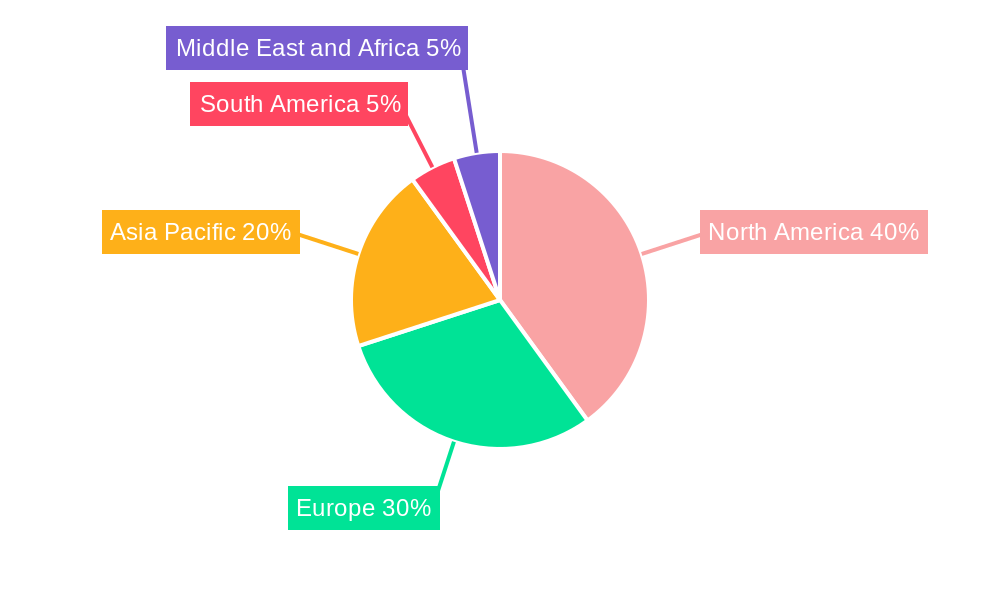
However, certain challenges restrain market expansion. High initial investment costs associated with 3D food printers and a lack of widespread consumer awareness represent significant hurdles. Addressing these challenges requires collaborative efforts between technology providers, food companies, and regulatory bodies to improve affordability and accessibility. Overcoming these barriers will unlock further market potential, particularly in emerging economies where the demand for efficient and innovative food production methods is substantial. The segmentation of the market by product type (chocolates and confectionery, bakery, meat and seafood, and others) and end-user (government, commercial, and residential) reveals diverse growth opportunities across various sectors. North America and Europe currently hold significant market shares, driven by early adoption and technological advancements, but the Asia-Pacific region is expected to witness rapid growth fueled by expanding economies and increasing consumer demand for innovative food solutions.
Food 3D Printing Market Report: 2019-2033
This comprehensive report provides a detailed analysis of the Food 3D Printing Market, offering valuable insights for industry professionals, investors, and stakeholders. The study period covers 2019-2033, with a base year of 2025 and a forecast period of 2025-2033. The report uses 2025 as its estimated year and leverages historical data from 2019-2024 to provide accurate and reliable market projections. The market is segmented by product type (Chocolates and Confectionery, Bakery, Meat and Seafood, Other Product Types) and end-user (Government, Commercial, Residential). Expected market value projections in Millions are provided throughout.
Food 3D Printing Market Structure & Innovation Trends
This section analyzes the market's competitive landscape, innovation drivers, and regulatory environment. Market concentration is moderate, with several key players vying for market share. Innovation is driven by advancements in printing technologies, material science, and food formulation. Regulatory frameworks vary across regions, influencing market growth. Product substitutes, primarily traditional food production methods, pose a competitive challenge. End-user demographics reveal a growing interest in personalized and customized food products, driving market expansion.
- Market Share (2025 Estimate): TNO: xx%, Modern Meadow: xx%, byFlow: xx%, Others: xx% (Note: These are estimated values).
- M&A Activity: The acquisition of Peace of Meat PV by Meat-Tech 3D Ltd in 2020 for EUR 15 Million illustrates the consolidation trend within the market. Further M&A activity is anticipated to reshape the competitive dynamics.

Food 3D Printing Market Dynamics & Trends
The Food 3D Printing market is experiencing significant growth, driven by increasing demand for personalized and customized food products. Technological advancements, such as improved printing precision and material versatility, are fueling market expansion. Consumer preferences for healthier, more sustainable, and convenient food options also contribute to market growth. Competitive dynamics are characterized by innovation, partnerships, and strategic acquisitions. The market is expected to exhibit a Compound Annual Growth Rate (CAGR) of xx% during the forecast period (2025-2033). Market penetration is currently at xx% and expected to rise to xx% by 2033.
Dominant Regions & Segments in Food 3D Printing Market
The North American market currently holds a dominant position, driven by strong technological advancements and consumer demand for innovative food solutions. Europe also exhibits substantial growth potential due to increasing adoption of 3D printing technologies across various sectors. Within product segments, Chocolates and Confectionery currently holds the largest market share, followed by Bakery products. In the end-user segment, the Commercial sector displays the highest market share due to the applicability in restaurants and food manufacturers.
- Key Drivers for North America: Strong R&D investments, early adoption of new technologies, and well-established food processing industry.
- Key Drivers for Europe: Growing investments in food tech innovation and supportive regulatory environment.
- Chocolates & Confectionery Dominance: High consumer interest in unique product designs and personalized gifting.
- Commercial Sector Dominance: Adoption by restaurants and food manufacturers for efficiency and customization advantages.
Food 3D Printing Market Product Innovations
Recent innovations include plant-based meat alternatives (SavorEat), space food printing systems (SMRC for NASA), and whole-cut plant-based meat (Redefine Meat). These developments showcase the versatility of 3D printing technology in creating customized, sustainable, and nutritious food products. Future innovations will likely focus on material science, enhancing printing speed and efficiency, and expanding the range of printable food items.
Report Scope & Segmentation Analysis
By Product Type:
- Chocolates and Confectionery: This segment is expected to witness significant growth due to increasing demand for customized chocolates and confectionery items.
- Bakery: This segment is growing due to the ability to create complex shapes and personalized designs.
- Meat and Seafood: This is a rapidly expanding sector driven by the development of plant-based and cultured meat products.
- Other Product Types: This category includes a wide range of products like pasta, snacks, and other food items, expected to witness moderate growth.
By End User:
- Government: This segment's growth is driven by the application in space exploration and military applications.
- Commercial: The commercial sector presents significant growth opportunities due to wide application across restaurants, food manufacturers, and retailers.
- Residential: The residential segment is growing as the technology becomes more accessible and affordable.
Key Drivers of Food 3D Printing Market Growth
The market is propelled by several factors: technological advancements leading to faster, more precise printing; increasing demand for personalized and customized food; the growing need for sustainable and efficient food production methods; supportive government initiatives and investments; and the rising popularity of plant-based and cultured meat alternatives.
Challenges in the Food 3D Printing Market Sector
The market faces challenges including high initial investment costs for equipment; limited availability of suitable food-grade printing materials; regulatory hurdles concerning food safety and labeling; supply chain complexities; and intense competition from established food manufacturers. These challenges limit wider adoption and necessitate further developments.
Emerging Opportunities in Food 3D Printing Market
Emerging opportunities include expansion into new geographical markets; development of novel food materials and printing techniques; increased collaboration between food manufacturers and technology providers; and creation of personalized nutrition solutions and customized dietary products.
Leading Players in the Food 3D Printing Market Market
- TNO
- Modern Meadow
- North Branch Everbright
- byFlow
- CandyFab
- Natural Machines
- Systems And Materials Research Corporation (SMRC)
- BeeHex
- Nufood
- Choc Edge
Key Developments in Food 3D Printing Market Industry
- August 2022: SavorEat launches plant-based burgers in the US.
- August 2021: NASA partners with SMRC to develop 3D-printed space food.
- July 2021: Redefine Meat commercially launches plant-based whole cuts of meat.
- December 2020: Meat-Tech 3D acquires Peace of Meat PV.
Future Outlook for Food 3D Printing Market Market
The Food 3D Printing market is poised for significant growth, driven by technological advancements and increasing consumer demand. Strategic partnerships, innovative product development, and expansion into new markets will be crucial for success. The market's future is promising, with opportunities for companies to capitalize on the rising demand for customized, sustainable, and efficient food production.
Food 3D Printing Market Segmentation
-
1. Product Type
- 1.1. Chocolates and Confectionery
- 1.2. Bakery
- 1.3. Meat and Seafood
- 1.4. Other Product Types
-
2. End User
- 2.1. Government
- 2.2. Commercial
- 2.3. Residential
Food 3D Printing Market Segmentation By Geography
-
1. North America
- 1.1. United States
- 1.2. Canada
- 1.3. Mexico
- 1.4. Rest of North America
-
2. Europe
- 2.1. Spain
- 2.2. United Kingdom
- 2.3. Germany
- 2.4. France
- 2.5. Italy
- 2.6. Russia
- 2.7. Rest of Europe
-
3. Asia Pacific
- 3.1. China
- 3.2. Japan
- 3.3. India
- 3.4. Australia
- 3.5. Rest of Asia Pacific
-
4. South America
- 4.1. Brazil
- 4.2. Argentina
- 4.3. Rest of South America
-
5. Middle East and Africa
- 5.1. South Africa
- 5.2. Saudi Arabia
- 5.3. Rest of Middle East and Africa
Food 3D Printing Market REPORT HIGHLIGHTS
| Aspects | Details |
|---|---|
| Study Period | 2019-2033 |
| Base Year | 2024 |
| Estimated Year | 2025 |
| Forecast Period | 2025-2033 |
| Historical Period | 2019-2024 |
| Growth Rate | CAGR of 31.57% from 2019-2033 |
| Segmentation |
|
Table of Contents
- 1. Introduction
- 1.1. Research Scope
- 1.2. Market Segmentation
- 1.3. Research Methodology
- 1.4. Definitions and Assumptions
- 2. Executive Summary
- 2.1. Introduction
- 3. Market Dynamics
- 3.1. Introduction
- 3.2. Market Drivers
- 3.2.1. Growing Emphasis on Gut Health; Innovation In Flavor and Supplement Delivery Format
- 3.3. Market Restrains
- 3.3.1. Escalating Functional Food Consumption and Other Substitutes; Side-effects Of Supplement Consumption
- 3.4. Market Trends
- 3.4.1. Rising Consumer Demand for Customized Food Products
- 4. Market Factor Analysis
- 4.1. Porters Five Forces
- 4.2. Supply/Value Chain
- 4.3. PESTEL analysis
- 4.4. Market Entropy
- 4.5. Patent/Trademark Analysis
- 5. Global Food 3D Printing Market Analysis, Insights and Forecast, 2019-2031
- 5.1. Market Analysis, Insights and Forecast - by Product Type
- 5.1.1. Chocolates and Confectionery
- 5.1.2. Bakery
- 5.1.3. Meat and Seafood
- 5.1.4. Other Product Types
- 5.2. Market Analysis, Insights and Forecast - by End User
- 5.2.1. Government
- 5.2.2. Commercial
- 5.2.3. Residential
- 5.3. Market Analysis, Insights and Forecast - by Region
- 5.3.1. North America
- 5.3.2. Europe
- 5.3.3. Asia Pacific
- 5.3.4. South America
- 5.3.5. Middle East and Africa
- 5.1. Market Analysis, Insights and Forecast - by Product Type
- 6. North America Food 3D Printing Market Analysis, Insights and Forecast, 2019-2031
- 6.1. Market Analysis, Insights and Forecast - by Product Type
- 6.1.1. Chocolates and Confectionery
- 6.1.2. Bakery
- 6.1.3. Meat and Seafood
- 6.1.4. Other Product Types
- 6.2. Market Analysis, Insights and Forecast - by End User
- 6.2.1. Government
- 6.2.2. Commercial
- 6.2.3. Residential
- 6.1. Market Analysis, Insights and Forecast - by Product Type
- 7. Europe Food 3D Printing Market Analysis, Insights and Forecast, 2019-2031
- 7.1. Market Analysis, Insights and Forecast - by Product Type
- 7.1.1. Chocolates and Confectionery
- 7.1.2. Bakery
- 7.1.3. Meat and Seafood
- 7.1.4. Other Product Types
- 7.2. Market Analysis, Insights and Forecast - by End User
- 7.2.1. Government
- 7.2.2. Commercial
- 7.2.3. Residential
- 7.1. Market Analysis, Insights and Forecast - by Product Type
- 8. Asia Pacific Food 3D Printing Market Analysis, Insights and Forecast, 2019-2031
- 8.1. Market Analysis, Insights and Forecast - by Product Type
- 8.1.1. Chocolates and Confectionery
- 8.1.2. Bakery
- 8.1.3. Meat and Seafood
- 8.1.4. Other Product Types
- 8.2. Market Analysis, Insights and Forecast - by End User
- 8.2.1. Government
- 8.2.2. Commercial
- 8.2.3. Residential
- 8.1. Market Analysis, Insights and Forecast - by Product Type
- 9. South America Food 3D Printing Market Analysis, Insights and Forecast, 2019-2031
- 9.1. Market Analysis, Insights and Forecast - by Product Type
- 9.1.1. Chocolates and Confectionery
- 9.1.2. Bakery
- 9.1.3. Meat and Seafood
- 9.1.4. Other Product Types
- 9.2. Market Analysis, Insights and Forecast - by End User
- 9.2.1. Government
- 9.2.2. Commercial
- 9.2.3. Residential
- 9.1. Market Analysis, Insights and Forecast - by Product Type
- 10. Middle East and Africa Food 3D Printing Market Analysis, Insights and Forecast, 2019-2031
- 10.1. Market Analysis, Insights and Forecast - by Product Type
- 10.1.1. Chocolates and Confectionery
- 10.1.2. Bakery
- 10.1.3. Meat and Seafood
- 10.1.4. Other Product Types
- 10.2. Market Analysis, Insights and Forecast - by End User
- 10.2.1. Government
- 10.2.2. Commercial
- 10.2.3. Residential
- 10.1. Market Analysis, Insights and Forecast - by Product Type
- 11. North America Food 3D Printing Market Analysis, Insights and Forecast, 2019-2031
- 11.1. Market Analysis, Insights and Forecast - By Country/Sub-region
- 11.1.1 United States
- 11.1.2 Canada
- 11.1.3 Mexico
- 11.1.4 Rest of North America
- 12. Europe Food 3D Printing Market Analysis, Insights and Forecast, 2019-2031
- 12.1. Market Analysis, Insights and Forecast - By Country/Sub-region
- 12.1.1 Spain
- 12.1.2 United Kingdom
- 12.1.3 Germany
- 12.1.4 France
- 12.1.5 Italy
- 12.1.6 Russia
- 12.1.7 Rest of Europe
- 13. Asia Pacific Food 3D Printing Market Analysis, Insights and Forecast, 2019-2031
- 13.1. Market Analysis, Insights and Forecast - By Country/Sub-region
- 13.1.1 China
- 13.1.2 Japan
- 13.1.3 India
- 13.1.4 Australia
- 13.1.5 Rest of Asia Pacific
- 14. South America Food 3D Printing Market Analysis, Insights and Forecast, 2019-2031
- 14.1. Market Analysis, Insights and Forecast - By Country/Sub-region
- 14.1.1 Brazil
- 14.1.2 Argentina
- 14.1.3 Rest of South America
- 15. Middle East and Africa Food 3D Printing Market Analysis, Insights and Forecast, 2019-2031
- 15.1. Market Analysis, Insights and Forecast - By Country/Sub-region
- 15.1.1 South Africa
- 15.1.2 Saudi Arabia
- 15.1.3 Rest of Middle East and Africa
- 16. Competitive Analysis
- 16.1. Global Market Share Analysis 2024
- 16.2. Company Profiles
- 16.2.1 TNO
- 16.2.1.1. Overview
- 16.2.1.2. Products
- 16.2.1.3. SWOT Analysis
- 16.2.1.4. Recent Developments
- 16.2.1.5. Financials (Based on Availability)
- 16.2.2 Modern Meadow*List Not Exhaustive
- 16.2.2.1. Overview
- 16.2.2.2. Products
- 16.2.2.3. SWOT Analysis
- 16.2.2.4. Recent Developments
- 16.2.2.5. Financials (Based on Availability)
- 16.2.3 North Branch Everbright
- 16.2.3.1. Overview
- 16.2.3.2. Products
- 16.2.3.3. SWOT Analysis
- 16.2.3.4. Recent Developments
- 16.2.3.5. Financials (Based on Availability)
- 16.2.4 byFlow
- 16.2.4.1. Overview
- 16.2.4.2. Products
- 16.2.4.3. SWOT Analysis
- 16.2.4.4. Recent Developments
- 16.2.4.5. Financials (Based on Availability)
- 16.2.5 CandyFab
- 16.2.5.1. Overview
- 16.2.5.2. Products
- 16.2.5.3. SWOT Analysis
- 16.2.5.4. Recent Developments
- 16.2.5.5. Financials (Based on Availability)
- 16.2.6 Natural Machines
- 16.2.6.1. Overview
- 16.2.6.2. Products
- 16.2.6.3. SWOT Analysis
- 16.2.6.4. Recent Developments
- 16.2.6.5. Financials (Based on Availability)
- 16.2.7 Systems And Materials Research Corporation (SMRC)
- 16.2.7.1. Overview
- 16.2.7.2. Products
- 16.2.7.3. SWOT Analysis
- 16.2.7.4. Recent Developments
- 16.2.7.5. Financials (Based on Availability)
- 16.2.8 BeeHex
- 16.2.8.1. Overview
- 16.2.8.2. Products
- 16.2.8.3. SWOT Analysis
- 16.2.8.4. Recent Developments
- 16.2.8.5. Financials (Based on Availability)
- 16.2.9 Nufood
- 16.2.9.1. Overview
- 16.2.9.2. Products
- 16.2.9.3. SWOT Analysis
- 16.2.9.4. Recent Developments
- 16.2.9.5. Financials (Based on Availability)
- 16.2.10 Choc Edge
- 16.2.10.1. Overview
- 16.2.10.2. Products
- 16.2.10.3. SWOT Analysis
- 16.2.10.4. Recent Developments
- 16.2.10.5. Financials (Based on Availability)
- 16.2.1 TNO
List of Figures
- Figure 1: Global Food 3D Printing Market Revenue Breakdown (Million, %) by Region 2024 & 2032
- Figure 2: North America Food 3D Printing Market Revenue (Million), by Country 2024 & 2032
- Figure 3: North America Food 3D Printing Market Revenue Share (%), by Country 2024 & 2032
- Figure 4: Europe Food 3D Printing Market Revenue (Million), by Country 2024 & 2032
- Figure 5: Europe Food 3D Printing Market Revenue Share (%), by Country 2024 & 2032
- Figure 6: Asia Pacific Food 3D Printing Market Revenue (Million), by Country 2024 & 2032
- Figure 7: Asia Pacific Food 3D Printing Market Revenue Share (%), by Country 2024 & 2032
- Figure 8: South America Food 3D Printing Market Revenue (Million), by Country 2024 & 2032
- Figure 9: South America Food 3D Printing Market Revenue Share (%), by Country 2024 & 2032
- Figure 10: Middle East and Africa Food 3D Printing Market Revenue (Million), by Country 2024 & 2032
- Figure 11: Middle East and Africa Food 3D Printing Market Revenue Share (%), by Country 2024 & 2032
- Figure 12: North America Food 3D Printing Market Revenue (Million), by Product Type 2024 & 2032
- Figure 13: North America Food 3D Printing Market Revenue Share (%), by Product Type 2024 & 2032
- Figure 14: North America Food 3D Printing Market Revenue (Million), by End User 2024 & 2032
- Figure 15: North America Food 3D Printing Market Revenue Share (%), by End User 2024 & 2032
- Figure 16: North America Food 3D Printing Market Revenue (Million), by Country 2024 & 2032
- Figure 17: North America Food 3D Printing Market Revenue Share (%), by Country 2024 & 2032
- Figure 18: Europe Food 3D Printing Market Revenue (Million), by Product Type 2024 & 2032
- Figure 19: Europe Food 3D Printing Market Revenue Share (%), by Product Type 2024 & 2032
- Figure 20: Europe Food 3D Printing Market Revenue (Million), by End User 2024 & 2032
- Figure 21: Europe Food 3D Printing Market Revenue Share (%), by End User 2024 & 2032
- Figure 22: Europe Food 3D Printing Market Revenue (Million), by Country 2024 & 2032
- Figure 23: Europe Food 3D Printing Market Revenue Share (%), by Country 2024 & 2032
- Figure 24: Asia Pacific Food 3D Printing Market Revenue (Million), by Product Type 2024 & 2032
- Figure 25: Asia Pacific Food 3D Printing Market Revenue Share (%), by Product Type 2024 & 2032
- Figure 26: Asia Pacific Food 3D Printing Market Revenue (Million), by End User 2024 & 2032
- Figure 27: Asia Pacific Food 3D Printing Market Revenue Share (%), by End User 2024 & 2032
- Figure 28: Asia Pacific Food 3D Printing Market Revenue (Million), by Country 2024 & 2032
- Figure 29: Asia Pacific Food 3D Printing Market Revenue Share (%), by Country 2024 & 2032
- Figure 30: South America Food 3D Printing Market Revenue (Million), by Product Type 2024 & 2032
- Figure 31: South America Food 3D Printing Market Revenue Share (%), by Product Type 2024 & 2032
- Figure 32: South America Food 3D Printing Market Revenue (Million), by End User 2024 & 2032
- Figure 33: South America Food 3D Printing Market Revenue Share (%), by End User 2024 & 2032
- Figure 34: South America Food 3D Printing Market Revenue (Million), by Country 2024 & 2032
- Figure 35: South America Food 3D Printing Market Revenue Share (%), by Country 2024 & 2032
- Figure 36: Middle East and Africa Food 3D Printing Market Revenue (Million), by Product Type 2024 & 2032
- Figure 37: Middle East and Africa Food 3D Printing Market Revenue Share (%), by Product Type 2024 & 2032
- Figure 38: Middle East and Africa Food 3D Printing Market Revenue (Million), by End User 2024 & 2032
- Figure 39: Middle East and Africa Food 3D Printing Market Revenue Share (%), by End User 2024 & 2032
- Figure 40: Middle East and Africa Food 3D Printing Market Revenue (Million), by Country 2024 & 2032
- Figure 41: Middle East and Africa Food 3D Printing Market Revenue Share (%), by Country 2024 & 2032
List of Tables
- Table 1: Global Food 3D Printing Market Revenue Million Forecast, by Region 2019 & 2032
- Table 2: Global Food 3D Printing Market Revenue Million Forecast, by Product Type 2019 & 2032
- Table 3: Global Food 3D Printing Market Revenue Million Forecast, by End User 2019 & 2032
- Table 4: Global Food 3D Printing Market Revenue Million Forecast, by Region 2019 & 2032
- Table 5: Global Food 3D Printing Market Revenue Million Forecast, by Country 2019 & 2032
- Table 6: United States Food 3D Printing Market Revenue (Million) Forecast, by Application 2019 & 2032
- Table 7: Canada Food 3D Printing Market Revenue (Million) Forecast, by Application 2019 & 2032
- Table 8: Mexico Food 3D Printing Market Revenue (Million) Forecast, by Application 2019 & 2032
- Table 9: Rest of North America Food 3D Printing Market Revenue (Million) Forecast, by Application 2019 & 2032
- Table 10: Global Food 3D Printing Market Revenue Million Forecast, by Country 2019 & 2032
- Table 11: Spain Food 3D Printing Market Revenue (Million) Forecast, by Application 2019 & 2032
- Table 12: United Kingdom Food 3D Printing Market Revenue (Million) Forecast, by Application 2019 & 2032
- Table 13: Germany Food 3D Printing Market Revenue (Million) Forecast, by Application 2019 & 2032
- Table 14: France Food 3D Printing Market Revenue (Million) Forecast, by Application 2019 & 2032
- Table 15: Italy Food 3D Printing Market Revenue (Million) Forecast, by Application 2019 & 2032
- Table 16: Russia Food 3D Printing Market Revenue (Million) Forecast, by Application 2019 & 2032
- Table 17: Rest of Europe Food 3D Printing Market Revenue (Million) Forecast, by Application 2019 & 2032
- Table 18: Global Food 3D Printing Market Revenue Million Forecast, by Country 2019 & 2032
- Table 19: China Food 3D Printing Market Revenue (Million) Forecast, by Application 2019 & 2032
- Table 20: Japan Food 3D Printing Market Revenue (Million) Forecast, by Application 2019 & 2032
- Table 21: India Food 3D Printing Market Revenue (Million) Forecast, by Application 2019 & 2032
- Table 22: Australia Food 3D Printing Market Revenue (Million) Forecast, by Application 2019 & 2032
- Table 23: Rest of Asia Pacific Food 3D Printing Market Revenue (Million) Forecast, by Application 2019 & 2032
- Table 24: Global Food 3D Printing Market Revenue Million Forecast, by Country 2019 & 2032
- Table 25: Brazil Food 3D Printing Market Revenue (Million) Forecast, by Application 2019 & 2032
- Table 26: Argentina Food 3D Printing Market Revenue (Million) Forecast, by Application 2019 & 2032
- Table 27: Rest of South America Food 3D Printing Market Revenue (Million) Forecast, by Application 2019 & 2032
- Table 28: Global Food 3D Printing Market Revenue Million Forecast, by Country 2019 & 2032
- Table 29: South Africa Food 3D Printing Market Revenue (Million) Forecast, by Application 2019 & 2032
- Table 30: Saudi Arabia Food 3D Printing Market Revenue (Million) Forecast, by Application 2019 & 2032
- Table 31: Rest of Middle East and Africa Food 3D Printing Market Revenue (Million) Forecast, by Application 2019 & 2032
- Table 32: Global Food 3D Printing Market Revenue Million Forecast, by Product Type 2019 & 2032
- Table 33: Global Food 3D Printing Market Revenue Million Forecast, by End User 2019 & 2032
- Table 34: Global Food 3D Printing Market Revenue Million Forecast, by Country 2019 & 2032
- Table 35: United States Food 3D Printing Market Revenue (Million) Forecast, by Application 2019 & 2032
- Table 36: Canada Food 3D Printing Market Revenue (Million) Forecast, by Application 2019 & 2032
- Table 37: Mexico Food 3D Printing Market Revenue (Million) Forecast, by Application 2019 & 2032
- Table 38: Rest of North America Food 3D Printing Market Revenue (Million) Forecast, by Application 2019 & 2032
- Table 39: Global Food 3D Printing Market Revenue Million Forecast, by Product Type 2019 & 2032
- Table 40: Global Food 3D Printing Market Revenue Million Forecast, by End User 2019 & 2032
- Table 41: Global Food 3D Printing Market Revenue Million Forecast, by Country 2019 & 2032
- Table 42: Spain Food 3D Printing Market Revenue (Million) Forecast, by Application 2019 & 2032
- Table 43: United Kingdom Food 3D Printing Market Revenue (Million) Forecast, by Application 2019 & 2032
- Table 44: Germany Food 3D Printing Market Revenue (Million) Forecast, by Application 2019 & 2032
- Table 45: France Food 3D Printing Market Revenue (Million) Forecast, by Application 2019 & 2032
- Table 46: Italy Food 3D Printing Market Revenue (Million) Forecast, by Application 2019 & 2032
- Table 47: Russia Food 3D Printing Market Revenue (Million) Forecast, by Application 2019 & 2032
- Table 48: Rest of Europe Food 3D Printing Market Revenue (Million) Forecast, by Application 2019 & 2032
- Table 49: Global Food 3D Printing Market Revenue Million Forecast, by Product Type 2019 & 2032
- Table 50: Global Food 3D Printing Market Revenue Million Forecast, by End User 2019 & 2032
- Table 51: Global Food 3D Printing Market Revenue Million Forecast, by Country 2019 & 2032
- Table 52: China Food 3D Printing Market Revenue (Million) Forecast, by Application 2019 & 2032
- Table 53: Japan Food 3D Printing Market Revenue (Million) Forecast, by Application 2019 & 2032
- Table 54: India Food 3D Printing Market Revenue (Million) Forecast, by Application 2019 & 2032
- Table 55: Australia Food 3D Printing Market Revenue (Million) Forecast, by Application 2019 & 2032
- Table 56: Rest of Asia Pacific Food 3D Printing Market Revenue (Million) Forecast, by Application 2019 & 2032
- Table 57: Global Food 3D Printing Market Revenue Million Forecast, by Product Type 2019 & 2032
- Table 58: Global Food 3D Printing Market Revenue Million Forecast, by End User 2019 & 2032
- Table 59: Global Food 3D Printing Market Revenue Million Forecast, by Country 2019 & 2032
- Table 60: Brazil Food 3D Printing Market Revenue (Million) Forecast, by Application 2019 & 2032
- Table 61: Argentina Food 3D Printing Market Revenue (Million) Forecast, by Application 2019 & 2032
- Table 62: Rest of South America Food 3D Printing Market Revenue (Million) Forecast, by Application 2019 & 2032
- Table 63: Global Food 3D Printing Market Revenue Million Forecast, by Product Type 2019 & 2032
- Table 64: Global Food 3D Printing Market Revenue Million Forecast, by End User 2019 & 2032
- Table 65: Global Food 3D Printing Market Revenue Million Forecast, by Country 2019 & 2032
- Table 66: South Africa Food 3D Printing Market Revenue (Million) Forecast, by Application 2019 & 2032
- Table 67: Saudi Arabia Food 3D Printing Market Revenue (Million) Forecast, by Application 2019 & 2032
- Table 68: Rest of Middle East and Africa Food 3D Printing Market Revenue (Million) Forecast, by Application 2019 & 2032
Frequently Asked Questions
1. What is the projected Compound Annual Growth Rate (CAGR) of the Food 3D Printing Market?
The projected CAGR is approximately 31.57%.
2. Which companies are prominent players in the Food 3D Printing Market?
Key companies in the market include TNO, Modern Meadow*List Not Exhaustive, North Branch Everbright, byFlow, CandyFab, Natural Machines, Systems And Materials Research Corporation (SMRC), BeeHex, Nufood, Choc Edge.
3. What are the main segments of the Food 3D Printing Market?
The market segments include Product Type, End User.
4. Can you provide details about the market size?
The market size is estimated to be USD 0.68 Million as of 2022.
5. What are some drivers contributing to market growth?
Growing Emphasis on Gut Health; Innovation In Flavor and Supplement Delivery Format.
6. What are the notable trends driving market growth?
Rising Consumer Demand for Customized Food Products.
7. Are there any restraints impacting market growth?
Escalating Functional Food Consumption and Other Substitutes; Side-effects Of Supplement Consumption.
8. Can you provide examples of recent developments in the market?
In August 2022, the SavorEat, a startup operating across Israel, launched its plant-based burgers made from 3D printing techniques across the United States. The products offered in the portfolio are claimed to be kosher, vegan, and gluten-free in nature.
9. What pricing options are available for accessing the report?
Pricing options include single-user, multi-user, and enterprise licenses priced at USD 4750, USD 5250, and USD 8750 respectively.
10. Is the market size provided in terms of value or volume?
The market size is provided in terms of value, measured in Million.
11. Are there any specific market keywords associated with the report?
Yes, the market keyword associated with the report is "Food 3D Printing Market," which aids in identifying and referencing the specific market segment covered.
12. How do I determine which pricing option suits my needs best?
The pricing options vary based on user requirements and access needs. Individual users may opt for single-user licenses, while businesses requiring broader access may choose multi-user or enterprise licenses for cost-effective access to the report.
13. Are there any additional resources or data provided in the Food 3D Printing Market report?
While the report offers comprehensive insights, it's advisable to review the specific contents or supplementary materials provided to ascertain if additional resources or data are available.
14. How can I stay updated on further developments or reports in the Food 3D Printing Market?
To stay informed about further developments, trends, and reports in the Food 3D Printing Market, consider subscribing to industry newsletters, following relevant companies and organizations, or regularly checking reputable industry news sources and publications.
Methodology
Step 1 - Identification of Relevant Samples Size from Population Database


Step 2 - Approaches for Defining Global Market Size (Value, Volume* & Price*)

Note*: In applicable scenarios
Step 3 - Data Sources
Primary Research
- Web Analytics
- Survey Reports
- Research Institute
- Latest Research Reports
- Opinion Leaders
Secondary Research
- Annual Reports
- White Paper
- Latest Press Release
- Industry Association
- Paid Database
- Investor Presentations

Step 4 - Data Triangulation
Involves using different sources of information in order to increase the validity of a study
These sources are likely to be stakeholders in a program - participants, other researchers, program staff, other community members, and so on.
Then we put all data in single framework & apply various statistical tools to find out the dynamic on the market.
During the analysis stage, feedback from the stakeholder groups would be compared to determine areas of agreement as well as areas of divergence


