
Key Insights
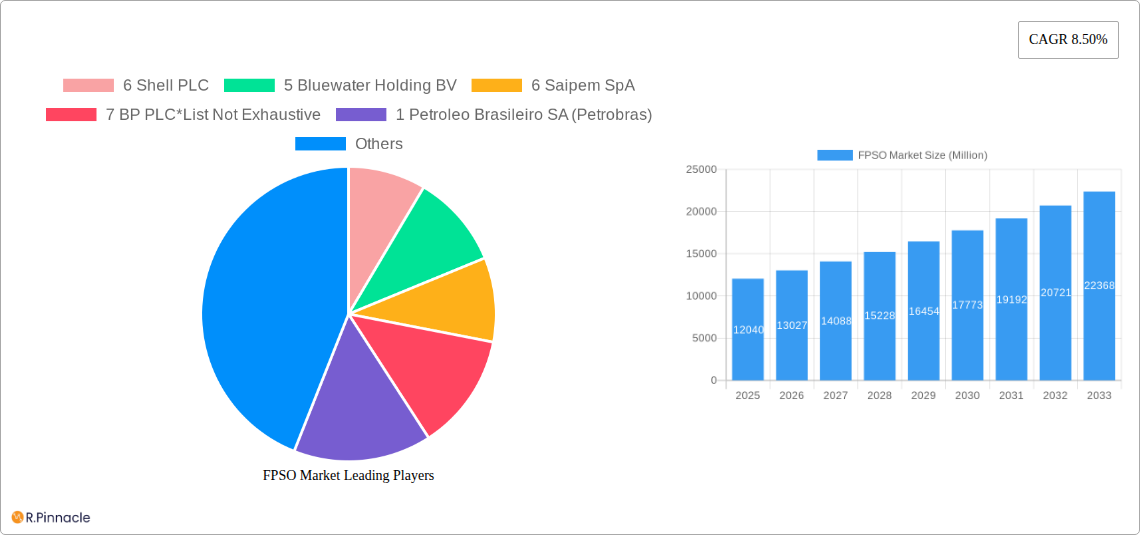
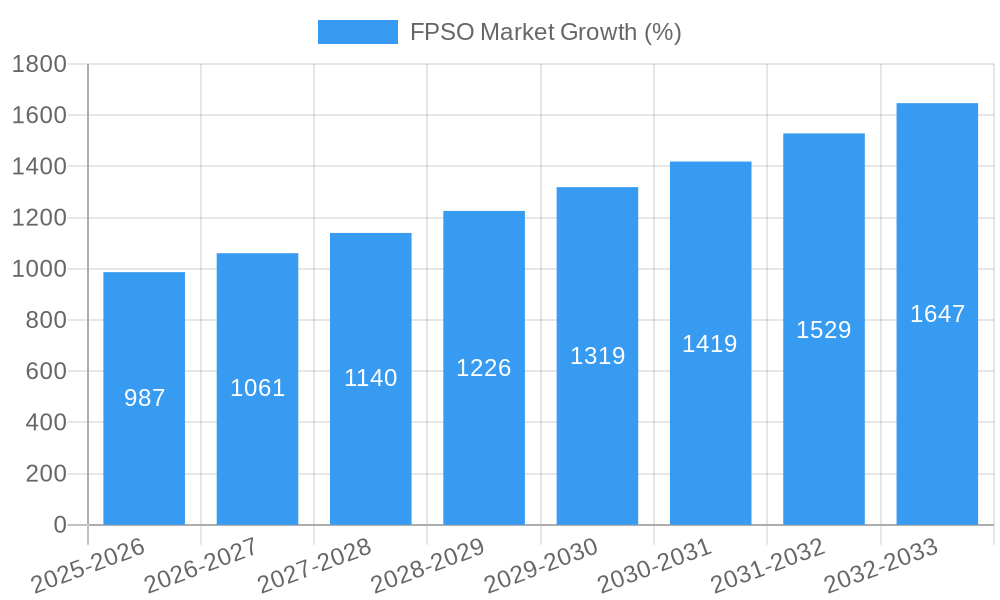
The Floating Production Storage and Offloading (FPSO) market is experiencing robust growth, projected to reach a market size of $12.04 billion in 2025 and maintain a Compound Annual Growth Rate (CAGR) of 8.50% from 2025 to 2033. This expansion is fueled by several key drivers. The increasing demand for offshore oil and gas exploration and production in deep and ultra-deep water environments necessitates the use of FPSOs, which offer a cost-effective and flexible solution compared to fixed platforms. Furthermore, the global energy transition, while presenting challenges, also presents opportunities for FPSOs to be adapted for carbon capture, utilization, and storage (CCUS) projects. Technological advancements in FPSO design and construction, such as improved subsea processing capabilities and enhanced automation, are contributing to increased efficiency and reduced operational costs. Growth is particularly strong in regions with significant offshore reserves, including Asia-Pacific (driven by projects in China, India, and Southeast Asia), and South America (primarily Brazil). However, regulatory hurdles, fluctuating oil prices, and environmental concerns related to offshore operations pose significant restraints on market expansion. The market is segmented by water depth (shallow, deep, ultra-deep) and ownership (operator-owned, contractor-owned), with deep and ultra-deep water segments showing the most promising growth potential due to technological advancements enabling efficient operations in these challenging environments.
The competitive landscape is characterized by a mix of large international oil companies (IOCs) such as Shell, BP, and TotalEnergies, alongside specialized FPSO contractors like SBM Offshore and Modec. These companies are engaged in a fierce competition to secure contracts, leading to innovation and cost optimization strategies. The market is also seeing increasing participation from smaller players, particularly in niche segments such as CCUS projects. Future growth will depend heavily on successful project execution, technological breakthroughs, and favorable regulatory frameworks. The continued exploration and exploitation of offshore oil and gas reserves, coupled with the potential for FPSO applications in renewable energy and carbon capture, indicate a positive outlook for the market's long-term growth. However, maintaining a sustainable balance between profitability, environmental responsibility, and regulatory compliance will be crucial for sustained success in the years to come.
FPSO Market Report: A Comprehensive Analysis (2019-2033)
This in-depth report provides a comprehensive analysis of the FPSO (Floating Production, Storage, and Offloading) market, offering valuable insights for industry professionals, investors, and strategic decision-makers. The report covers market structure, dynamics, leading players, and future trends, leveraging data from the historical period (2019-2024), base year (2025), and forecast period (2025-2033). This analysis incorporates a detailed study of key market segments, including water depth (shallow, deep, ultra-deep), ownership (operator-owned, contractor-owned), and leading regional markets.
FPSO Market Market Structure & Innovation Trends
The FPSO market exhibits a moderately concentrated structure, with key players holding significant market share. While precise market share figures for each company are proprietary information, we estimate the following based on available data and industry reports: Shell PLC (6%), Bluewater Holding BV (5%), Saipem SpA (6%), BP PLC (7%), Petroleo Brasileiro SA (Petrobras) (1%), Teekay Offshore Partners LP (4%), Chevron Corporation (5%), TotalEnergies SE (3%), Petrofac Limited (7%), ExxonMobil Corp (4%), Modec Inc (1%), BW Offshore Limited (3%), SBM Offshore NV (2%), and CNOOC Ltd (2%). Note that this list is not exhaustive. Innovation is driven by the need for cost-effective solutions in deeper waters and harsher environments, leading to advancements in hull design, subsea processing, and automation. Regulatory frameworks, including environmental regulations and safety standards, significantly influence market dynamics. M&A activity, with deal values exceeding xx Million in recent years, reflects industry consolidation and strategic expansion.
FPSO Market Market Dynamics & Trends
The FPSO market is experiencing robust growth, driven primarily by the increasing demand for offshore oil and gas production in deep and ultra-deep waters. Technological advancements, such as improved subsea technologies and enhanced oil recovery techniques, are further fueling market expansion. The global FPSO market is predicted to exhibit a Compound Annual Growth Rate (CAGR) of xx% during the forecast period (2025-2033), with significant market penetration in regions with substantial offshore oil and gas reserves. Consumer preferences, reflected in demand for sustainable and environmentally responsible solutions, are influencing the adoption of innovative technologies and practices. Competitive dynamics are characterized by intense rivalry among major players and the emergence of new entrants, driven by technological innovation and strategic acquisitions.
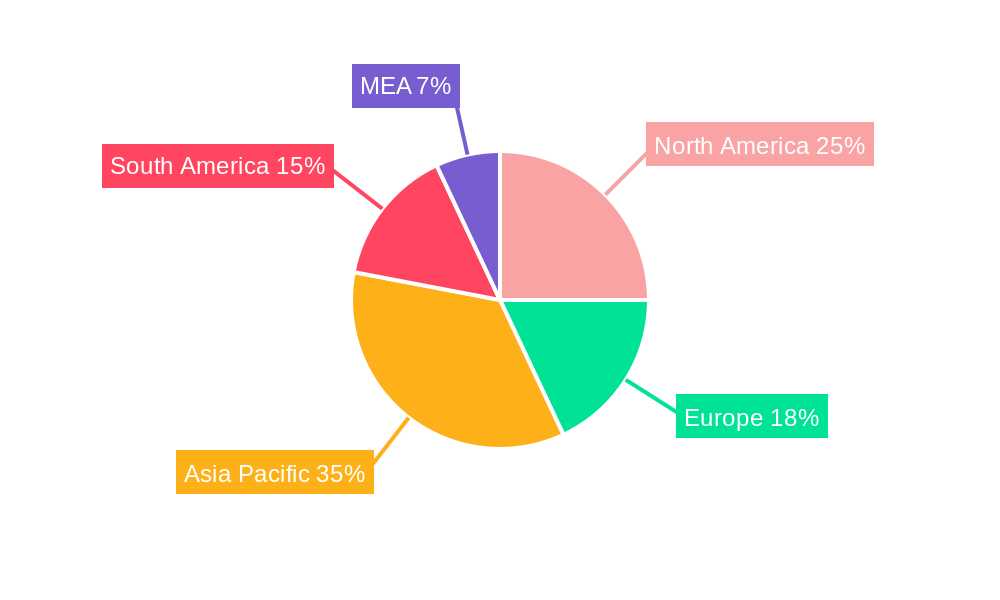
Dominant Regions & Segments in FPSO Market
The report identifies [Region Name, e.g., Southeast Asia] as the dominant region in the FPSO market. This dominance is attributable to several key factors:
- Abundant offshore reserves: The region possesses significant untapped oil and gas reserves in deep and ultra-deep waters.
- Favorable government policies: Supportive government regulations and investment incentives foster exploration and production activities.
- Robust infrastructure: Existing infrastructure, including ports and specialized services, provides strong support for FPSO deployment and operations.
The deep and ultra-deep water segments are expected to be the fastest-growing segments, driven by the exploration and development of resources in these challenging environments. Contractor-owned FPSOs represent a significant market share, driven by the cost-effectiveness and flexibility offered by this ownership model.
FPSO Market Product Innovations
Recent product innovations include advanced subsea processing systems, improved hull designs for extreme environments, and automation technologies to enhance efficiency and safety. These advancements enable cost-effective exploration and production in deeper waters, expanding the market for FPSOs and addressing the growing demand for sustainable solutions. The market is characterized by a strong emphasis on integrating digital technologies to enhance monitoring, control, and decision-making.
Report Scope & Segmentation Analysis
The report segments the FPSO market based on water depth (shallow, deep, ultra-deep) and ownership (operator-owned, contractor-owned). Each segment’s analysis incorporates projections for market size, growth rates, and competitive dynamics. The ultra-deep water segment is anticipated to witness the highest growth rate due to the increasing exploration and production activities in these challenging environments. The contractor-owned segment is expected to dominate the market due to its cost-effective structure and increased flexibility.
Key Drivers of FPSO Market Growth
Several factors are driving the growth of the FPSO market. These include:
- Growing demand for offshore oil and gas: The global need for energy is propelling the exploration and production of offshore resources.
- Technological advancements: Innovations in subsea technologies and automation are enabling access to previously inaccessible resources.
- Favorable government policies: Government incentives and regulations in key regions support offshore exploration.
Challenges in the FPSO Market Sector
The FPSO market faces several challenges, including:
- High capital expenditures: The initial investment costs for FPSO projects remain substantial.
- Environmental regulations: Stricter environmental rules impact project development and operational costs.
- Geopolitical risks: Political instability and regulatory changes can affect the feasibility of projects.
Emerging Opportunities in FPSO Market
Significant opportunities exist for the FPSO market, including:
- Growth in new markets: Exploration and production activities are expanding to new regions with substantial offshore reserves.
- Technological advancements: The adoption of digital technologies will further enhance efficiency and reduce operating costs.
- Demand for sustainable solutions: The increasing focus on environmental sustainability will drive the adoption of greener technologies.
Leading Players in the FPSO Market Market
- Shell PLC
- Bluewater Holding BV
- Saipem SpA
- BP PLC
- Petroleo Brasileiro SA (Petrobras)
- Teekay Offshore Partners LP
- Chevron Corporation
- TotalEnergies SE
- Petrofac Limited
- ExxonMobil Corp
- Modec Inc
- BW Offshore Limited
- SBM Offshore NV
- CNOOC Ltd
- FPSO Operators
- FPSO Contractors
Key Developments in FPSO Market Industry
- May 2023: SBM Offshore and Esso Exploration & Production Guyana entered a 10-year Operations and Maintenance Enabling Agreement for four FPSOs: Liza Destiny, Liza Unity, Prosperity, and ONE GUYANA. This signifies long-term contracts and operational stability.
- April 2023: Shell resumed gas production at the Pierce field in the UK North Sea after upgrading the Haewene Brim FPSO. This highlights adaptability and expansion of existing facilities.
- April 2023: KBR secured a USD 9.4 Billion engineering contract for Equinor's Bay du Nord project in Canada. This points to significant investment in new FPSO projects.
Future Outlook for FPSO Market Market
The FPSO market is poised for continued growth, driven by increasing global energy demand and the exploration of new offshore reserves in deep and ultra-deep waters. The adoption of advanced technologies, such as AI and automation, will enhance operational efficiency and reduce costs. Strategic partnerships and M&A activities will shape the competitive landscape, while a focus on sustainable practices will become increasingly crucial. The market presents significant opportunities for companies with innovative solutions and a strong commitment to environmental responsibility.
FPSO Market Segmentation
-
1. Ownership
- 1.1. Operator-owned
- 1.2. Contractor-owned
-
2. Water Depth
- 2.1. Shallow Water
- 2.2. Deep Water
- 2.3. Ultra-deep Water
FPSO Market Segmentation By Geography
-
1. North America
- 1.1. United States
- 1.2. Canada
- 1.3. Mexico
- 1.4. Rest of North America
-
2. Europe
- 2.1. Norway
- 2.2. United Kingdom
- 2.3. Russia
- 2.4. Netherland
- 2.5. France
- 2.6. Italy
- 2.7. NORDIC
- 2.8. Germany
- 2.9. Spain
- 2.10. Rest of Europe
-
3. Asia Pacific
- 3.1. China
- 3.2. India
- 3.3. Australia
- 3.4. Indonesia
- 3.5. Malaysia
- 3.6. Thailand
- 3.7. Japan
- 3.8. Vietnam
- 3.9. Rest of Asia Pacific
-
4. South America
- 4.1. Brazil
- 4.2. Argentina
- 4.3. Venezuela
- 4.4. Colombia
- 4.5. Rest of South America
-
5. Middle East and Africa
- 5.1. Saudi Arabia
- 5.2. United Arab Emirates
- 5.3. Nigeria
- 5.4. Algeria
- 5.5. Qatar
- 5.6. South Africa
- 5.7. Egypt
- 5.8. Rest of Middle East and Africa
FPSO Market REPORT HIGHLIGHTS
| Aspects | Details |
|---|---|
| Study Period | 2019-2033 |
| Base Year | 2024 |
| Estimated Year | 2025 |
| Forecast Period | 2025-2033 |
| Historical Period | 2019-2024 |
| Growth Rate | CAGR of 8.50% from 2019-2033 |
| Segmentation |
|
Table of Contents
- 1. Introduction
- 1.1. Research Scope
- 1.2. Market Segmentation
- 1.3. Research Methodology
- 1.4. Definitions and Assumptions
- 2. Executive Summary
- 2.1. Introduction
- 3. Market Dynamics
- 3.1. Introduction
- 3.2. Market Drivers
- 3.2.1. 4.; Increasing Offshore Oil and Gas Exploration and Production Activities4.; Growing Demand for Energy
- 3.3. Market Restrains
- 3.3.1. 4.; High Upfront Costs
- 3.4. Market Trends
- 3.4.1. Contractor-owned FPSO Expected to Dominate the Market
- 4. Market Factor Analysis
- 4.1. Porters Five Forces
- 4.2. Supply/Value Chain
- 4.3. PESTEL analysis
- 4.4. Market Entropy
- 4.5. Patent/Trademark Analysis
- 5. Global FPSO Market Analysis, Insights and Forecast, 2019-2031
- 5.1. Market Analysis, Insights and Forecast - by Ownership
- 5.1.1. Operator-owned
- 5.1.2. Contractor-owned
- 5.2. Market Analysis, Insights and Forecast - by Water Depth
- 5.2.1. Shallow Water
- 5.2.2. Deep Water
- 5.2.3. Ultra-deep Water
- 5.3. Market Analysis, Insights and Forecast - by Region
- 5.3.1. North America
- 5.3.2. Europe
- 5.3.3. Asia Pacific
- 5.3.4. South America
- 5.3.5. Middle East and Africa
- 5.1. Market Analysis, Insights and Forecast - by Ownership
- 6. North America FPSO Market Analysis, Insights and Forecast, 2019-2031
- 6.1. Market Analysis, Insights and Forecast - by Ownership
- 6.1.1. Operator-owned
- 6.1.2. Contractor-owned
- 6.2. Market Analysis, Insights and Forecast - by Water Depth
- 6.2.1. Shallow Water
- 6.2.2. Deep Water
- 6.2.3. Ultra-deep Water
- 6.1. Market Analysis, Insights and Forecast - by Ownership
- 7. Europe FPSO Market Analysis, Insights and Forecast, 2019-2031
- 7.1. Market Analysis, Insights and Forecast - by Ownership
- 7.1.1. Operator-owned
- 7.1.2. Contractor-owned
- 7.2. Market Analysis, Insights and Forecast - by Water Depth
- 7.2.1. Shallow Water
- 7.2.2. Deep Water
- 7.2.3. Ultra-deep Water
- 7.1. Market Analysis, Insights and Forecast - by Ownership
- 8. Asia Pacific FPSO Market Analysis, Insights and Forecast, 2019-2031
- 8.1. Market Analysis, Insights and Forecast - by Ownership
- 8.1.1. Operator-owned
- 8.1.2. Contractor-owned
- 8.2. Market Analysis, Insights and Forecast - by Water Depth
- 8.2.1. Shallow Water
- 8.2.2. Deep Water
- 8.2.3. Ultra-deep Water
- 8.1. Market Analysis, Insights and Forecast - by Ownership
- 9. South America FPSO Market Analysis, Insights and Forecast, 2019-2031
- 9.1. Market Analysis, Insights and Forecast - by Ownership
- 9.1.1. Operator-owned
- 9.1.2. Contractor-owned
- 9.2. Market Analysis, Insights and Forecast - by Water Depth
- 9.2.1. Shallow Water
- 9.2.2. Deep Water
- 9.2.3. Ultra-deep Water
- 9.1. Market Analysis, Insights and Forecast - by Ownership
- 10. Middle East and Africa FPSO Market Analysis, Insights and Forecast, 2019-2031
- 10.1. Market Analysis, Insights and Forecast - by Ownership
- 10.1.1. Operator-owned
- 10.1.2. Contractor-owned
- 10.2. Market Analysis, Insights and Forecast - by Water Depth
- 10.2.1. Shallow Water
- 10.2.2. Deep Water
- 10.2.3. Ultra-deep Water
- 10.1. Market Analysis, Insights and Forecast - by Ownership
- 11. North America FPSO Market Analysis, Insights and Forecast, 2019-2031
- 11.1. Market Analysis, Insights and Forecast - By Country/Sub-region
- 11.1.1 United States
- 11.1.2 Canada
- 11.1.3 Mexico
- 12. Europe FPSO Market Analysis, Insights and Forecast, 2019-2031
- 12.1. Market Analysis, Insights and Forecast - By Country/Sub-region
- 12.1.1 Germany
- 12.1.2 United Kingdom
- 12.1.3 France
- 12.1.4 Spain
- 12.1.5 Italy
- 12.1.6 Spain
- 12.1.7 Belgium
- 12.1.8 Netherland
- 12.1.9 Nordics
- 12.1.10 Rest of Europe
- 13. Asia Pacific FPSO Market Analysis, Insights and Forecast, 2019-2031
- 13.1. Market Analysis, Insights and Forecast - By Country/Sub-region
- 13.1.1 China
- 13.1.2 Japan
- 13.1.3 India
- 13.1.4 South Korea
- 13.1.5 Southeast Asia
- 13.1.6 Australia
- 13.1.7 Indonesia
- 13.1.8 Phillipes
- 13.1.9 Singapore
- 13.1.10 Thailandc
- 13.1.11 Rest of Asia Pacific
- 14. South America FPSO Market Analysis, Insights and Forecast, 2019-2031
- 14.1. Market Analysis, Insights and Forecast - By Country/Sub-region
- 14.1.1 Brazil
- 14.1.2 Argentina
- 14.1.3 Peru
- 14.1.4 Chile
- 14.1.5 Colombia
- 14.1.6 Ecuador
- 14.1.7 Venezuela
- 14.1.8 Rest of South America
- 15. North America FPSO Market Analysis, Insights and Forecast, 2019-2031
- 15.1. Market Analysis, Insights and Forecast - By Country/Sub-region
- 15.1.1 United States
- 15.1.2 Canada
- 15.1.3 Mexico
- 16. MEA FPSO Market Analysis, Insights and Forecast, 2019-2031
- 16.1. Market Analysis, Insights and Forecast - By Country/Sub-region
- 16.1.1 United Arab Emirates
- 16.1.2 Saudi Arabia
- 16.1.3 South Africa
- 16.1.4 Rest of Middle East and Africa
- 17. Competitive Analysis
- 17.1. Global Market Share Analysis 2024
- 17.2. Company Profiles
- 17.2.1 6 Shell PLC
- 17.2.1.1. Overview
- 17.2.1.2. Products
- 17.2.1.3. SWOT Analysis
- 17.2.1.4. Recent Developments
- 17.2.1.5. Financials (Based on Availability)
- 17.2.2 5 Bluewater Holding BV
- 17.2.2.1. Overview
- 17.2.2.2. Products
- 17.2.2.3. SWOT Analysis
- 17.2.2.4. Recent Developments
- 17.2.2.5. Financials (Based on Availability)
- 17.2.3 6 Saipem SpA
- 17.2.3.1. Overview
- 17.2.3.2. Products
- 17.2.3.3. SWOT Analysis
- 17.2.3.4. Recent Developments
- 17.2.3.5. Financials (Based on Availability)
- 17.2.4 7 BP PLC*List Not Exhaustive
- 17.2.4.1. Overview
- 17.2.4.2. Products
- 17.2.4.3. SWOT Analysis
- 17.2.4.4. Recent Developments
- 17.2.4.5. Financials (Based on Availability)
- 17.2.5 1 Petroleo Brasileiro SA (Petrobras)
- 17.2.5.1. Overview
- 17.2.5.2. Products
- 17.2.5.3. SWOT Analysis
- 17.2.5.4. Recent Developments
- 17.2.5.5. Financials (Based on Availability)
- 17.2.6 4 Teekay Offshore Partners LP
- 17.2.6.1. Overview
- 17.2.6.2. Products
- 17.2.6.3. SWOT Analysis
- 17.2.6.4. Recent Developments
- 17.2.6.5. Financials (Based on Availability)
- 17.2.7 5 Chevron Corporation
- 17.2.7.1. Overview
- 17.2.7.2. Products
- 17.2.7.3. SWOT Analysis
- 17.2.7.4. Recent Developments
- 17.2.7.5. Financials (Based on Availability)
- 17.2.8 3 TotalEnergies SE
- 17.2.8.1. Overview
- 17.2.8.2. Products
- 17.2.8.3. SWOT Analysis
- 17.2.8.4. Recent Developments
- 17.2.8.5. Financials (Based on Availability)
- 17.2.9 7 Petrofac Limited
- 17.2.9.1. Overview
- 17.2.9.2. Products
- 17.2.9.3. SWOT Analysis
- 17.2.9.4. Recent Developments
- 17.2.9.5. Financials (Based on Availability)
- 17.2.10 4 ExxonMobil Corp
- 17.2.10.1. Overview
- 17.2.10.2. Products
- 17.2.10.3. SWOT Analysis
- 17.2.10.4. Recent Developments
- 17.2.10.5. Financials (Based on Availability)
- 17.2.11 1 Modec Inc
- 17.2.11.1. Overview
- 17.2.11.2. Products
- 17.2.11.3. SWOT Analysis
- 17.2.11.4. Recent Developments
- 17.2.11.5. Financials (Based on Availability)
- 17.2.12 3 BW Offshore Limited
- 17.2.12.1. Overview
- 17.2.12.2. Products
- 17.2.12.3. SWOT Analysis
- 17.2.12.4. Recent Developments
- 17.2.12.5. Financials (Based on Availability)
- 17.2.13 FPSO Operators
- 17.2.13.1. Overview
- 17.2.13.2. Products
- 17.2.13.3. SWOT Analysis
- 17.2.13.4. Recent Developments
- 17.2.13.5. Financials (Based on Availability)
- 17.2.14 2 SBM Offshore NV
- 17.2.14.1. Overview
- 17.2.14.2. Products
- 17.2.14.3. SWOT Analysis
- 17.2.14.4. Recent Developments
- 17.2.14.5. Financials (Based on Availability)
- 17.2.15 2 CNOOC Ltd
- 17.2.15.1. Overview
- 17.2.15.2. Products
- 17.2.15.3. SWOT Analysis
- 17.2.15.4. Recent Developments
- 17.2.15.5. Financials (Based on Availability)
- 17.2.16 FPSO Contractors
- 17.2.16.1. Overview
- 17.2.16.2. Products
- 17.2.16.3. SWOT Analysis
- 17.2.16.4. Recent Developments
- 17.2.16.5. Financials (Based on Availability)
- 17.2.1 6 Shell PLC
List of Figures
- Figure 1: Global FPSO Market Revenue Breakdown (Million, %) by Region 2024 & 2032
- Figure 2: North America FPSO Market Revenue (Million), by Country 2024 & 2032
- Figure 3: North America FPSO Market Revenue Share (%), by Country 2024 & 2032
- Figure 4: Europe FPSO Market Revenue (Million), by Country 2024 & 2032
- Figure 5: Europe FPSO Market Revenue Share (%), by Country 2024 & 2032
- Figure 6: Asia Pacific FPSO Market Revenue (Million), by Country 2024 & 2032
- Figure 7: Asia Pacific FPSO Market Revenue Share (%), by Country 2024 & 2032
- Figure 8: South America FPSO Market Revenue (Million), by Country 2024 & 2032
- Figure 9: South America FPSO Market Revenue Share (%), by Country 2024 & 2032
- Figure 10: North America FPSO Market Revenue (Million), by Country 2024 & 2032
- Figure 11: North America FPSO Market Revenue Share (%), by Country 2024 & 2032
- Figure 12: MEA FPSO Market Revenue (Million), by Country 2024 & 2032
- Figure 13: MEA FPSO Market Revenue Share (%), by Country 2024 & 2032
- Figure 14: North America FPSO Market Revenue (Million), by Ownership 2024 & 2032
- Figure 15: North America FPSO Market Revenue Share (%), by Ownership 2024 & 2032
- Figure 16: North America FPSO Market Revenue (Million), by Water Depth 2024 & 2032
- Figure 17: North America FPSO Market Revenue Share (%), by Water Depth 2024 & 2032
- Figure 18: North America FPSO Market Revenue (Million), by Country 2024 & 2032
- Figure 19: North America FPSO Market Revenue Share (%), by Country 2024 & 2032
- Figure 20: Europe FPSO Market Revenue (Million), by Ownership 2024 & 2032
- Figure 21: Europe FPSO Market Revenue Share (%), by Ownership 2024 & 2032
- Figure 22: Europe FPSO Market Revenue (Million), by Water Depth 2024 & 2032
- Figure 23: Europe FPSO Market Revenue Share (%), by Water Depth 2024 & 2032
- Figure 24: Europe FPSO Market Revenue (Million), by Country 2024 & 2032
- Figure 25: Europe FPSO Market Revenue Share (%), by Country 2024 & 2032
- Figure 26: Asia Pacific FPSO Market Revenue (Million), by Ownership 2024 & 2032
- Figure 27: Asia Pacific FPSO Market Revenue Share (%), by Ownership 2024 & 2032
- Figure 28: Asia Pacific FPSO Market Revenue (Million), by Water Depth 2024 & 2032
- Figure 29: Asia Pacific FPSO Market Revenue Share (%), by Water Depth 2024 & 2032
- Figure 30: Asia Pacific FPSO Market Revenue (Million), by Country 2024 & 2032
- Figure 31: Asia Pacific FPSO Market Revenue Share (%), by Country 2024 & 2032
- Figure 32: South America FPSO Market Revenue (Million), by Ownership 2024 & 2032
- Figure 33: South America FPSO Market Revenue Share (%), by Ownership 2024 & 2032
- Figure 34: South America FPSO Market Revenue (Million), by Water Depth 2024 & 2032
- Figure 35: South America FPSO Market Revenue Share (%), by Water Depth 2024 & 2032
- Figure 36: South America FPSO Market Revenue (Million), by Country 2024 & 2032
- Figure 37: South America FPSO Market Revenue Share (%), by Country 2024 & 2032
- Figure 38: Middle East and Africa FPSO Market Revenue (Million), by Ownership 2024 & 2032
- Figure 39: Middle East and Africa FPSO Market Revenue Share (%), by Ownership 2024 & 2032
- Figure 40: Middle East and Africa FPSO Market Revenue (Million), by Water Depth 2024 & 2032
- Figure 41: Middle East and Africa FPSO Market Revenue Share (%), by Water Depth 2024 & 2032
- Figure 42: Middle East and Africa FPSO Market Revenue (Million), by Country 2024 & 2032
- Figure 43: Middle East and Africa FPSO Market Revenue Share (%), by Country 2024 & 2032
List of Tables
- Table 1: Global FPSO Market Revenue Million Forecast, by Region 2019 & 2032
- Table 2: Global FPSO Market Revenue Million Forecast, by Ownership 2019 & 2032
- Table 3: Global FPSO Market Revenue Million Forecast, by Water Depth 2019 & 2032
- Table 4: Global FPSO Market Revenue Million Forecast, by Region 2019 & 2032
- Table 5: Global FPSO Market Revenue Million Forecast, by Country 2019 & 2032
- Table 6: United States FPSO Market Revenue (Million) Forecast, by Application 2019 & 2032
- Table 7: Canada FPSO Market Revenue (Million) Forecast, by Application 2019 & 2032
- Table 8: Mexico FPSO Market Revenue (Million) Forecast, by Application 2019 & 2032
- Table 9: Global FPSO Market Revenue Million Forecast, by Country 2019 & 2032
- Table 10: Germany FPSO Market Revenue (Million) Forecast, by Application 2019 & 2032
- Table 11: United Kingdom FPSO Market Revenue (Million) Forecast, by Application 2019 & 2032
- Table 12: France FPSO Market Revenue (Million) Forecast, by Application 2019 & 2032
- Table 13: Spain FPSO Market Revenue (Million) Forecast, by Application 2019 & 2032
- Table 14: Italy FPSO Market Revenue (Million) Forecast, by Application 2019 & 2032
- Table 15: Spain FPSO Market Revenue (Million) Forecast, by Application 2019 & 2032
- Table 16: Belgium FPSO Market Revenue (Million) Forecast, by Application 2019 & 2032
- Table 17: Netherland FPSO Market Revenue (Million) Forecast, by Application 2019 & 2032
- Table 18: Nordics FPSO Market Revenue (Million) Forecast, by Application 2019 & 2032
- Table 19: Rest of Europe FPSO Market Revenue (Million) Forecast, by Application 2019 & 2032
- Table 20: Global FPSO Market Revenue Million Forecast, by Country 2019 & 2032
- Table 21: China FPSO Market Revenue (Million) Forecast, by Application 2019 & 2032
- Table 22: Japan FPSO Market Revenue (Million) Forecast, by Application 2019 & 2032
- Table 23: India FPSO Market Revenue (Million) Forecast, by Application 2019 & 2032
- Table 24: South Korea FPSO Market Revenue (Million) Forecast, by Application 2019 & 2032
- Table 25: Southeast Asia FPSO Market Revenue (Million) Forecast, by Application 2019 & 2032
- Table 26: Australia FPSO Market Revenue (Million) Forecast, by Application 2019 & 2032
- Table 27: Indonesia FPSO Market Revenue (Million) Forecast, by Application 2019 & 2032
- Table 28: Phillipes FPSO Market Revenue (Million) Forecast, by Application 2019 & 2032
- Table 29: Singapore FPSO Market Revenue (Million) Forecast, by Application 2019 & 2032
- Table 30: Thailandc FPSO Market Revenue (Million) Forecast, by Application 2019 & 2032
- Table 31: Rest of Asia Pacific FPSO Market Revenue (Million) Forecast, by Application 2019 & 2032
- Table 32: Global FPSO Market Revenue Million Forecast, by Country 2019 & 2032
- Table 33: Brazil FPSO Market Revenue (Million) Forecast, by Application 2019 & 2032
- Table 34: Argentina FPSO Market Revenue (Million) Forecast, by Application 2019 & 2032
- Table 35: Peru FPSO Market Revenue (Million) Forecast, by Application 2019 & 2032
- Table 36: Chile FPSO Market Revenue (Million) Forecast, by Application 2019 & 2032
- Table 37: Colombia FPSO Market Revenue (Million) Forecast, by Application 2019 & 2032
- Table 38: Ecuador FPSO Market Revenue (Million) Forecast, by Application 2019 & 2032
- Table 39: Venezuela FPSO Market Revenue (Million) Forecast, by Application 2019 & 2032
- Table 40: Rest of South America FPSO Market Revenue (Million) Forecast, by Application 2019 & 2032
- Table 41: Global FPSO Market Revenue Million Forecast, by Country 2019 & 2032
- Table 42: United States FPSO Market Revenue (Million) Forecast, by Application 2019 & 2032
- Table 43: Canada FPSO Market Revenue (Million) Forecast, by Application 2019 & 2032
- Table 44: Mexico FPSO Market Revenue (Million) Forecast, by Application 2019 & 2032
- Table 45: Global FPSO Market Revenue Million Forecast, by Country 2019 & 2032
- Table 46: United Arab Emirates FPSO Market Revenue (Million) Forecast, by Application 2019 & 2032
- Table 47: Saudi Arabia FPSO Market Revenue (Million) Forecast, by Application 2019 & 2032
- Table 48: South Africa FPSO Market Revenue (Million) Forecast, by Application 2019 & 2032
- Table 49: Rest of Middle East and Africa FPSO Market Revenue (Million) Forecast, by Application 2019 & 2032
- Table 50: Global FPSO Market Revenue Million Forecast, by Ownership 2019 & 2032
- Table 51: Global FPSO Market Revenue Million Forecast, by Water Depth 2019 & 2032
- Table 52: Global FPSO Market Revenue Million Forecast, by Country 2019 & 2032
- Table 53: United States FPSO Market Revenue (Million) Forecast, by Application 2019 & 2032
- Table 54: Canada FPSO Market Revenue (Million) Forecast, by Application 2019 & 2032
- Table 55: Mexico FPSO Market Revenue (Million) Forecast, by Application 2019 & 2032
- Table 56: Rest of North America FPSO Market Revenue (Million) Forecast, by Application 2019 & 2032
- Table 57: Global FPSO Market Revenue Million Forecast, by Ownership 2019 & 2032
- Table 58: Global FPSO Market Revenue Million Forecast, by Water Depth 2019 & 2032
- Table 59: Global FPSO Market Revenue Million Forecast, by Country 2019 & 2032
- Table 60: Norway FPSO Market Revenue (Million) Forecast, by Application 2019 & 2032
- Table 61: United Kingdom FPSO Market Revenue (Million) Forecast, by Application 2019 & 2032
- Table 62: Russia FPSO Market Revenue (Million) Forecast, by Application 2019 & 2032
- Table 63: Netherland FPSO Market Revenue (Million) Forecast, by Application 2019 & 2032
- Table 64: France FPSO Market Revenue (Million) Forecast, by Application 2019 & 2032
- Table 65: Italy FPSO Market Revenue (Million) Forecast, by Application 2019 & 2032
- Table 66: NORDIC FPSO Market Revenue (Million) Forecast, by Application 2019 & 2032
- Table 67: Germany FPSO Market Revenue (Million) Forecast, by Application 2019 & 2032
- Table 68: Spain FPSO Market Revenue (Million) Forecast, by Application 2019 & 2032
- Table 69: Rest of Europe FPSO Market Revenue (Million) Forecast, by Application 2019 & 2032
- Table 70: Global FPSO Market Revenue Million Forecast, by Ownership 2019 & 2032
- Table 71: Global FPSO Market Revenue Million Forecast, by Water Depth 2019 & 2032
- Table 72: Global FPSO Market Revenue Million Forecast, by Country 2019 & 2032
- Table 73: China FPSO Market Revenue (Million) Forecast, by Application 2019 & 2032
- Table 74: India FPSO Market Revenue (Million) Forecast, by Application 2019 & 2032
- Table 75: Australia FPSO Market Revenue (Million) Forecast, by Application 2019 & 2032
- Table 76: Indonesia FPSO Market Revenue (Million) Forecast, by Application 2019 & 2032
- Table 77: Malaysia FPSO Market Revenue (Million) Forecast, by Application 2019 & 2032
- Table 78: Thailand FPSO Market Revenue (Million) Forecast, by Application 2019 & 2032
- Table 79: Japan FPSO Market Revenue (Million) Forecast, by Application 2019 & 2032
- Table 80: Vietnam FPSO Market Revenue (Million) Forecast, by Application 2019 & 2032
- Table 81: Rest of Asia Pacific FPSO Market Revenue (Million) Forecast, by Application 2019 & 2032
- Table 82: Global FPSO Market Revenue Million Forecast, by Ownership 2019 & 2032
- Table 83: Global FPSO Market Revenue Million Forecast, by Water Depth 2019 & 2032
- Table 84: Global FPSO Market Revenue Million Forecast, by Country 2019 & 2032
- Table 85: Brazil FPSO Market Revenue (Million) Forecast, by Application 2019 & 2032
- Table 86: Argentina FPSO Market Revenue (Million) Forecast, by Application 2019 & 2032
- Table 87: Venezuela FPSO Market Revenue (Million) Forecast, by Application 2019 & 2032
- Table 88: Colombia FPSO Market Revenue (Million) Forecast, by Application 2019 & 2032
- Table 89: Rest of South America FPSO Market Revenue (Million) Forecast, by Application 2019 & 2032
- Table 90: Global FPSO Market Revenue Million Forecast, by Ownership 2019 & 2032
- Table 91: Global FPSO Market Revenue Million Forecast, by Water Depth 2019 & 2032
- Table 92: Global FPSO Market Revenue Million Forecast, by Country 2019 & 2032
- Table 93: Saudi Arabia FPSO Market Revenue (Million) Forecast, by Application 2019 & 2032
- Table 94: United Arab Emirates FPSO Market Revenue (Million) Forecast, by Application 2019 & 2032
- Table 95: Nigeria FPSO Market Revenue (Million) Forecast, by Application 2019 & 2032
- Table 96: Algeria FPSO Market Revenue (Million) Forecast, by Application 2019 & 2032
- Table 97: Qatar FPSO Market Revenue (Million) Forecast, by Application 2019 & 2032
- Table 98: South Africa FPSO Market Revenue (Million) Forecast, by Application 2019 & 2032
- Table 99: Egypt FPSO Market Revenue (Million) Forecast, by Application 2019 & 2032
- Table 100: Rest of Middle East and Africa FPSO Market Revenue (Million) Forecast, by Application 2019 & 2032
Frequently Asked Questions
1. What is the projected Compound Annual Growth Rate (CAGR) of the FPSO Market?
The projected CAGR is approximately 8.50%.
2. Which companies are prominent players in the FPSO Market?
Key companies in the market include 6 Shell PLC, 5 Bluewater Holding BV, 6 Saipem SpA, 7 BP PLC*List Not Exhaustive, 1 Petroleo Brasileiro SA (Petrobras), 4 Teekay Offshore Partners LP, 5 Chevron Corporation, 3 TotalEnergies SE, 7 Petrofac Limited, 4 ExxonMobil Corp, 1 Modec Inc, 3 BW Offshore Limited, FPSO Operators, 2 SBM Offshore NV, 2 CNOOC Ltd, FPSO Contractors.
3. What are the main segments of the FPSO Market?
The market segments include Ownership, Water Depth.
4. Can you provide details about the market size?
The market size is estimated to be USD 12.04 Million as of 2022.
5. What are some drivers contributing to market growth?
4.; Increasing Offshore Oil and Gas Exploration and Production Activities4.; Growing Demand for Energy.
6. What are the notable trends driving market growth?
Contractor-owned FPSO Expected to Dominate the Market.
7. Are there any restraints impacting market growth?
4.; High Upfront Costs.
8. Can you provide examples of recent developments in the market?
May 2023: SBM Offshore and Esso Exploration & Production Guyana entered a 10-year Operations and Maintenance Enabling Agreement. The agreement entails SBM Offshore being responsible for the operations and maintenance of four FPSOs: Liza Destiny, Liza Unity, Prosperity, and ONE GUYANA.
9. What pricing options are available for accessing the report?
Pricing options include single-user, multi-user, and enterprise licenses priced at USD 4750, USD 5250, and USD 8750 respectively.
10. Is the market size provided in terms of value or volume?
The market size is provided in terms of value, measured in Million.
11. Are there any specific market keywords associated with the report?
Yes, the market keyword associated with the report is "FPSO Market," which aids in identifying and referencing the specific market segment covered.
12. How do I determine which pricing option suits my needs best?
The pricing options vary based on user requirements and access needs. Individual users may opt for single-user licenses, while businesses requiring broader access may choose multi-user or enterprise licenses for cost-effective access to the report.
13. Are there any additional resources or data provided in the FPSO Market report?
While the report offers comprehensive insights, it's advisable to review the specific contents or supplementary materials provided to ascertain if additional resources or data are available.
14. How can I stay updated on further developments or reports in the FPSO Market?
To stay informed about further developments, trends, and reports in the FPSO Market, consider subscribing to industry newsletters, following relevant companies and organizations, or regularly checking reputable industry news sources and publications.
Methodology
Step 1 - Identification of Relevant Samples Size from Population Database


Step 2 - Approaches for Defining Global Market Size (Value, Volume* & Price*)

Note*: In applicable scenarios
Step 3 - Data Sources
Primary Research
- Web Analytics
- Survey Reports
- Research Institute
- Latest Research Reports
- Opinion Leaders
Secondary Research
- Annual Reports
- White Paper
- Latest Press Release
- Industry Association
- Paid Database
- Investor Presentations

Step 4 - Data Triangulation
Involves using different sources of information in order to increase the validity of a study
These sources are likely to be stakeholders in a program - participants, other researchers, program staff, other community members, and so on.
Then we put all data in single framework & apply various statistical tools to find out the dynamic on the market.
During the analysis stage, feedback from the stakeholder groups would be compared to determine areas of agreement as well as areas of divergence


