
Key Insights
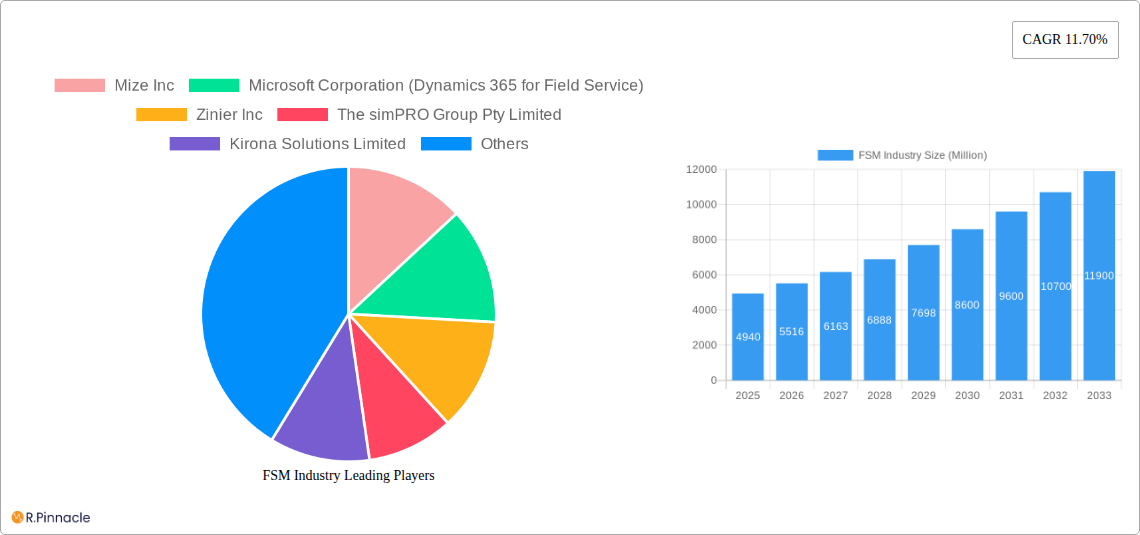
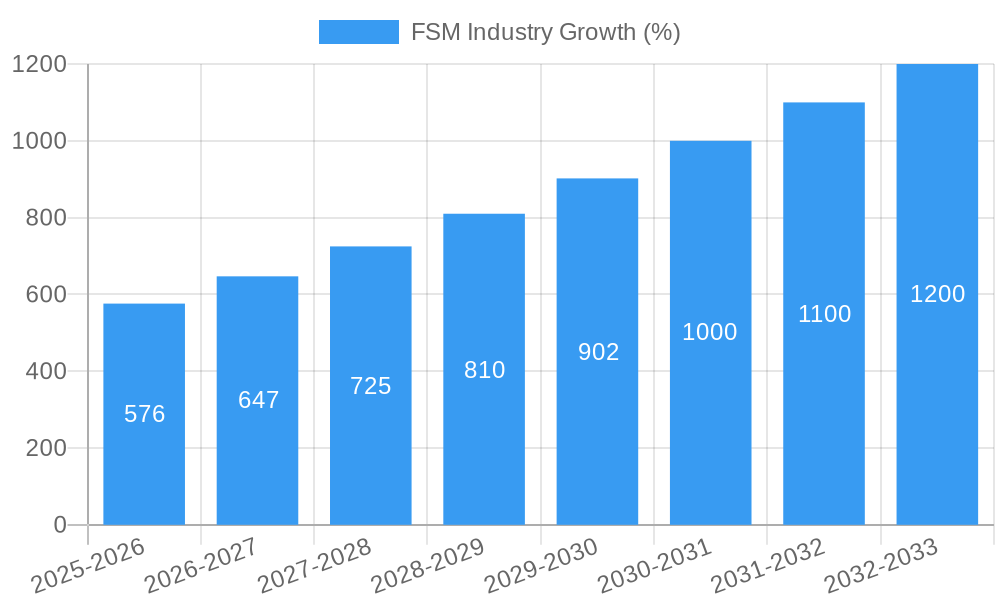
The Field Service Management (FSM) software market, valued at $4.94 billion in 2025, is experiencing robust growth, projected to expand at a Compound Annual Growth Rate (CAGR) of 11.70% from 2025 to 2033. This expansion is driven by several key factors. The increasing adoption of cloud-based solutions offers scalability and cost-effectiveness, attracting Small and Medium Enterprises (SMEs) and large enterprises alike. Furthermore, the rising need for improved operational efficiency, enhanced customer experience, and real-time data visibility are compelling businesses across diverse sectors, including allied FM (building, HVAC, landscaping, and cleaning), IT and telecom, healthcare, and energy, to invest in FSM solutions. Advanced features like scheduling, dispatch and route optimization, and service contract management are crucial for streamlining operations and reducing costs. The growing prevalence of mobile workforce management needs also contributes significantly to the market's expansion. The competitive landscape features both established players like Microsoft and Salesforce, and innovative startups offering specialized solutions, fueling innovation and market penetration.
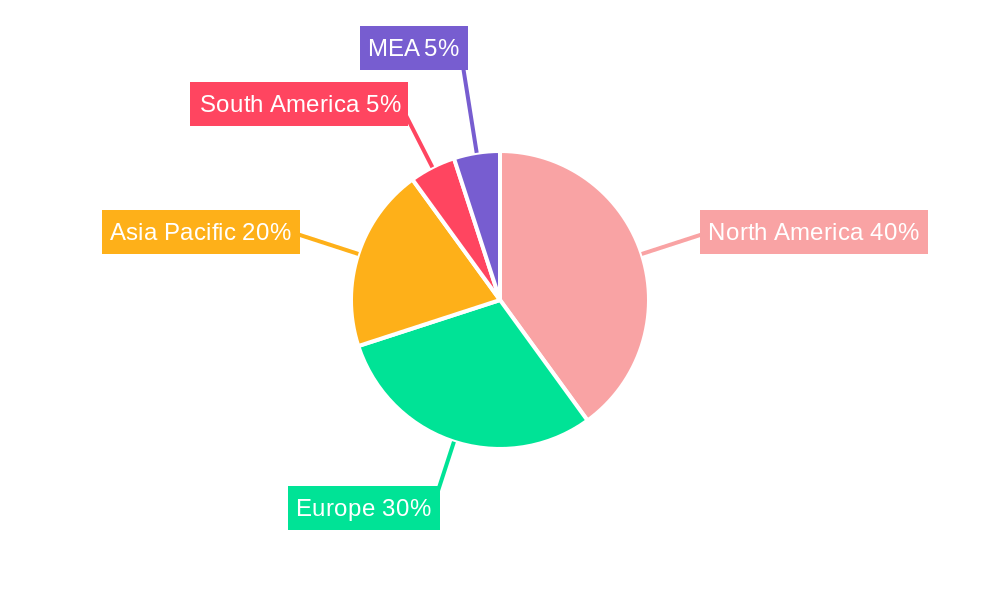
Regional growth is expected to be varied. North America, with its mature technology adoption and significant presence of leading FSM vendors, will likely maintain a substantial market share. However, the Asia-Pacific region is poised for significant growth due to increasing digitalization and expanding industrial sectors. Europe will continue to show steady growth, driven by the adoption of advanced FSM technologies across various industries. The competitive landscape is dynamic, with mergers, acquisitions, and partnerships shaping the market. Continuous innovation, including integration with IoT devices and AI-powered predictive analytics, is further driving market expansion and differentiation among vendors. The market's future growth hinges on the successful integration of these advancements and the continued expansion of the digital landscape across industries.
FSM Industry Market Report: 2019-2033
This comprehensive report provides a detailed analysis of the Field Service Management (FSM) industry, projecting a market value exceeding $XX Million by 2033. This in-depth study covers market structure, dynamics, key players, and future opportunities, offering actionable insights for industry professionals. The report utilizes data from the historical period (2019-2024), the base year (2025), and forecasts from 2025-2033, providing a complete picture of this dynamic market.
FSM Industry Market Structure & Innovation Trends
The FSM market exhibits a moderately concentrated structure, with key players like Mize Inc, Microsoft Corporation (Dynamics 365 for Field Service), Zinier Inc, The simPRO Group Pty Limited, Kirona Solutions Limited, IFS AB, ServiceMax Inc, Field Aware US Inc, Salesforce com Inc (Field Service Cloud), Trimble Inc, Oracle Corporation (OFSC), Accruent LLC (Fortive Corp), Coresystems (SAP SE), and ServicePower Inc holding significant market share. Market share distribution varies across segments, with cloud-based solutions gaining prominence.
Innovation is driven by advancements in IoT, AI, and cloud computing, leading to improved scheduling, route optimization, and predictive maintenance capabilities. Regulatory frameworks, such as data privacy regulations, significantly impact market players. Product substitutes, such as basic scheduling tools, pose limited threats due to the enhanced capabilities offered by integrated FSM solutions.
- Market Concentration: Moderately concentrated, with top 10 players holding approximately XX% of the market share in 2025.
- M&A Activity: Significant M&A activity observed, exemplified by Visma's acquisition of OutSmart in October 2022 (deal value: $XX Million). These activities drive consolidation and expansion within the market.
- End-User Demographics: Growth is driven by large enterprises across diverse sectors, with increasing adoption amongst SMEs.
FSM Industry Market Dynamics & Trends
The FSM market is experiencing robust growth, with a projected Compound Annual Growth Rate (CAGR) of XX% during the forecast period (2025-2033). Key growth drivers include the rising demand for improved service efficiency, increased customer expectations, and the growing adoption of digital transformation strategies across various industries.
Technological disruptions, particularly the integration of AI and IoT, are revolutionizing service delivery models. Consumer preferences are shifting towards personalized, proactive, and data-driven service experiences. Competitive dynamics are characterized by intense rivalry among established players and the emergence of innovative startups. Market penetration is highest in developed economies but shows substantial growth potential in emerging markets. The increasing adoption of cloud-based solutions is a defining trend, accounting for XX% of the market in 2025 and projected to reach XX% by 2033.
Dominant Regions & Segments in FSM Industry
North America currently dominates the FSM market, driven by early adoption of advanced technologies and a large base of enterprises. However, the Asia-Pacific region is expected to witness substantial growth during the forecast period due to rising infrastructure investments and expanding digitalization initiatives.
- Dominant Deployment Type: Cloud-based solutions lead the market due to scalability, accessibility, and cost-effectiveness.
- Dominant Organization Size: Large enterprises account for the majority of market revenue owing to their higher budgets and complex service requirements.
- Dominant FSM Software & Service Type: Scheduling, dispatch, and route optimization remain the most sought-after functionalities, followed by work order management and customer management.
- Dominant End-User: The IT and Telecom sector and Allied FM (Hard - Building and HVAC and Soft - Landscaping & Cleaning) demonstrate the highest adoption rates.
Key Drivers for Regional Dominance:
- North America: Strong technological infrastructure, high digital literacy, and established business processes.
- Asia-Pacific: Rapid economic growth, increasing investments in infrastructure, and a growing demand for efficient service delivery across various sectors.
FSM Industry Product Innovations
Recent innovations focus on AI-powered predictive maintenance, automated scheduling, and real-time data analytics to optimize field service operations. The integration of IoT devices enables proactive maintenance and reduces downtime. These advancements offer competitive advantages by improving operational efficiency, enhancing customer satisfaction, and reducing operational costs. The market is witnessing a shift towards mobile-first solutions and the integration of augmented reality (AR) and virtual reality (VR) technologies for remote support and troubleshooting.
Report Scope & Segmentation Analysis
This report segments the FSM market based on deployment type (on-premises, cloud), organization size (SMEs, large enterprises), FSM software and service type (scheduling, dispatch & route optimization, service contract management, work order management, customer management, inventory management, other software, services), and end-user industry (Allied FM, IT & Telecom, Healthcare & Lifesciences, Energy & Utilities, Oil & Gas, Manufacturing, other end-users). Each segment's growth projection, market size, and competitive dynamics are thoroughly analyzed within the report. The cloud segment is projected to grow at a CAGR of XX%, exceeding $XX Million by 2033.
Key Drivers of FSM Industry Growth
Technological advancements (AI, IoT, cloud computing), increasing demand for improved service efficiency, rising customer expectations for personalized service, and governmental regulations promoting digitalization are key drivers of FSM industry growth. The expansion of smart cities and the growth of the Internet of Things (IoT) are fueling market expansion in several sectors.
Challenges in the FSM Industry Sector
Integration complexities across disparate systems, the high cost of implementation, the need for skilled workforce, data security concerns, and competition from new entrants pose challenges for the FSM industry. The impact of these challenges is estimated to result in an average XX% delay in project implementation across the industry during the forecast period.
Emerging Opportunities in FSM Industry
Emerging opportunities exist in untapped markets, such as the growing adoption of FSM solutions in the developing economies and the expansion of services like preventative maintenance, remote diagnostics, and augmented reality-based support. Opportunities also exist for providers focusing on niche industry solutions and integration with other business software systems.
Leading Players in the FSM Industry Market
- Mize Inc
- Microsoft Corporation (Dynamics 365 for Field Service)
- Zinier Inc
- The simPRO Group Pty Limited
- Kirona Solutions Limited
- IFS AB
- ServiceMax Inc
- Field Aware US Inc
- Salesforce com Inc (Field Service Cloud)
- Trimble Inc
- Oracle Corporation (OFSC)
- Accruent LLC (Fortive Corp)
- Coresystems (SAP SE)
- ServicePower Inc
Key Developments in FSM Industry
- June 2022: ServiceMax launched DataGuide, enhancing its platform's reporting and form generation capabilities.
- October 2022: Visma acquired OutSmart, expanding its reach in the European FSM market.
Future Outlook for FSM Industry Market
The FSM market is poised for continued growth, driven by technological innovation, increased digital adoption, and the rising demand for efficient and customer-centric service delivery. Strategic partnerships, mergers and acquisitions, and investments in research and development will play crucial roles in shaping the future market landscape. The predicted market size of over $XX Million by 2033 indicates significant potential for growth and expansion in the years to come.
FSM Industry Segmentation
-
1. Deployment Type
- 1.1. On-premises
- 1.2. Cloud
-
2. Organisation Size
- 2.1. Small and Medium Enterprises
- 2.2. Large Enterprises
-
3. FSM Software and Service Type
- 3.1. Scheduling, Dispatch & Route Optimization
- 3.2. Service Contract Management
- 3.3. Work Order Management
- 3.4. Customer Management
- 3.5. Inventory Management
- 3.6. Services
-
4. End-User
- 4.1. Allied F
- 4.2. IT and Telecom
- 4.3. Healthcare and Lifesciences
- 4.4. Energy and Utilities
- 4.5. Oil and Gas
- 4.6. Manufacturing
- 4.7. Other
FSM Industry Segmentation By Geography
- 1. North America
- 2. Europe
- 3. Asia
- 4. Australia and New Zealand
- 5. Middle East and Africa
- 6. Latin America
FSM Industry REPORT HIGHLIGHTS
| Aspects | Details |
|---|---|
| Study Period | 2019-2033 |
| Base Year | 2024 |
| Estimated Year | 2025 |
| Forecast Period | 2025-2033 |
| Historical Period | 2019-2024 |
| Growth Rate | CAGR of 11.70% from 2019-2033 |
| Segmentation |
|
Table of Contents
- 1. Introduction
- 1.1. Research Scope
- 1.2. Market Segmentation
- 1.3. Research Methodology
- 1.4. Definitions and Assumptions
- 2. Executive Summary
- 2.1. Introduction
- 3. Market Dynamics
- 3.1. Introduction
- 3.2. Market Drivers
- 3.2.1. Growing emphasis on maximizing work efficiency; Technological trends such as mobility and adoption of cloud-based solutions; Creation of new sales opportunities
- 3.3. Market Restrains
- 3.3.1. Increasing Risk of Counterfeits
- 3.4. Market Trends
- 3.4.1. Service Contract Management to Hold Significant Market Share
- 4. Market Factor Analysis
- 4.1. Porters Five Forces
- 4.2. Supply/Value Chain
- 4.3. PESTEL analysis
- 4.4. Market Entropy
- 4.5. Patent/Trademark Analysis
- 5. Global FSM Industry Analysis, Insights and Forecast, 2019-2031
- 5.1. Market Analysis, Insights and Forecast - by Deployment Type
- 5.1.1. On-premises
- 5.1.2. Cloud
- 5.2. Market Analysis, Insights and Forecast - by Organisation Size
- 5.2.1. Small and Medium Enterprises
- 5.2.2. Large Enterprises
- 5.3. Market Analysis, Insights and Forecast - by FSM Software and Service Type
- 5.3.1. Scheduling, Dispatch & Route Optimization
- 5.3.2. Service Contract Management
- 5.3.3. Work Order Management
- 5.3.4. Customer Management
- 5.3.5. Inventory Management
- 5.3.6. Services
- 5.4. Market Analysis, Insights and Forecast - by End-User
- 5.4.1. Allied F
- 5.4.2. IT and Telecom
- 5.4.3. Healthcare and Lifesciences
- 5.4.4. Energy and Utilities
- 5.4.5. Oil and Gas
- 5.4.6. Manufacturing
- 5.4.7. Other
- 5.5. Market Analysis, Insights and Forecast - by Region
- 5.5.1. North America
- 5.5.2. Europe
- 5.5.3. Asia
- 5.5.4. Australia and New Zealand
- 5.5.5. Middle East and Africa
- 5.5.6. Latin America
- 5.1. Market Analysis, Insights and Forecast - by Deployment Type
- 6. North America FSM Industry Analysis, Insights and Forecast, 2019-2031
- 6.1. Market Analysis, Insights and Forecast - by Deployment Type
- 6.1.1. On-premises
- 6.1.2. Cloud
- 6.2. Market Analysis, Insights and Forecast - by Organisation Size
- 6.2.1. Small and Medium Enterprises
- 6.2.2. Large Enterprises
- 6.3. Market Analysis, Insights and Forecast - by FSM Software and Service Type
- 6.3.1. Scheduling, Dispatch & Route Optimization
- 6.3.2. Service Contract Management
- 6.3.3. Work Order Management
- 6.3.4. Customer Management
- 6.3.5. Inventory Management
- 6.3.6. Services
- 6.4. Market Analysis, Insights and Forecast - by End-User
- 6.4.1. Allied F
- 6.4.2. IT and Telecom
- 6.4.3. Healthcare and Lifesciences
- 6.4.4. Energy and Utilities
- 6.4.5. Oil and Gas
- 6.4.6. Manufacturing
- 6.4.7. Other
- 6.1. Market Analysis, Insights and Forecast - by Deployment Type
- 7. Europe FSM Industry Analysis, Insights and Forecast, 2019-2031
- 7.1. Market Analysis, Insights and Forecast - by Deployment Type
- 7.1.1. On-premises
- 7.1.2. Cloud
- 7.2. Market Analysis, Insights and Forecast - by Organisation Size
- 7.2.1. Small and Medium Enterprises
- 7.2.2. Large Enterprises
- 7.3. Market Analysis, Insights and Forecast - by FSM Software and Service Type
- 7.3.1. Scheduling, Dispatch & Route Optimization
- 7.3.2. Service Contract Management
- 7.3.3. Work Order Management
- 7.3.4. Customer Management
- 7.3.5. Inventory Management
- 7.3.6. Services
- 7.4. Market Analysis, Insights and Forecast - by End-User
- 7.4.1. Allied F
- 7.4.2. IT and Telecom
- 7.4.3. Healthcare and Lifesciences
- 7.4.4. Energy and Utilities
- 7.4.5. Oil and Gas
- 7.4.6. Manufacturing
- 7.4.7. Other
- 7.1. Market Analysis, Insights and Forecast - by Deployment Type
- 8. Asia FSM Industry Analysis, Insights and Forecast, 2019-2031
- 8.1. Market Analysis, Insights and Forecast - by Deployment Type
- 8.1.1. On-premises
- 8.1.2. Cloud
- 8.2. Market Analysis, Insights and Forecast - by Organisation Size
- 8.2.1. Small and Medium Enterprises
- 8.2.2. Large Enterprises
- 8.3. Market Analysis, Insights and Forecast - by FSM Software and Service Type
- 8.3.1. Scheduling, Dispatch & Route Optimization
- 8.3.2. Service Contract Management
- 8.3.3. Work Order Management
- 8.3.4. Customer Management
- 8.3.5. Inventory Management
- 8.3.6. Services
- 8.4. Market Analysis, Insights and Forecast - by End-User
- 8.4.1. Allied F
- 8.4.2. IT and Telecom
- 8.4.3. Healthcare and Lifesciences
- 8.4.4. Energy and Utilities
- 8.4.5. Oil and Gas
- 8.4.6. Manufacturing
- 8.4.7. Other
- 8.1. Market Analysis, Insights and Forecast - by Deployment Type
- 9. Australia and New Zealand FSM Industry Analysis, Insights and Forecast, 2019-2031
- 9.1. Market Analysis, Insights and Forecast - by Deployment Type
- 9.1.1. On-premises
- 9.1.2. Cloud
- 9.2. Market Analysis, Insights and Forecast - by Organisation Size
- 9.2.1. Small and Medium Enterprises
- 9.2.2. Large Enterprises
- 9.3. Market Analysis, Insights and Forecast - by FSM Software and Service Type
- 9.3.1. Scheduling, Dispatch & Route Optimization
- 9.3.2. Service Contract Management
- 9.3.3. Work Order Management
- 9.3.4. Customer Management
- 9.3.5. Inventory Management
- 9.3.6. Services
- 9.4. Market Analysis, Insights and Forecast - by End-User
- 9.4.1. Allied F
- 9.4.2. IT and Telecom
- 9.4.3. Healthcare and Lifesciences
- 9.4.4. Energy and Utilities
- 9.4.5. Oil and Gas
- 9.4.6. Manufacturing
- 9.4.7. Other
- 9.1. Market Analysis, Insights and Forecast - by Deployment Type
- 10. Middle East and Africa FSM Industry Analysis, Insights and Forecast, 2019-2031
- 10.1. Market Analysis, Insights and Forecast - by Deployment Type
- 10.1.1. On-premises
- 10.1.2. Cloud
- 10.2. Market Analysis, Insights and Forecast - by Organisation Size
- 10.2.1. Small and Medium Enterprises
- 10.2.2. Large Enterprises
- 10.3. Market Analysis, Insights and Forecast - by FSM Software and Service Type
- 10.3.1. Scheduling, Dispatch & Route Optimization
- 10.3.2. Service Contract Management
- 10.3.3. Work Order Management
- 10.3.4. Customer Management
- 10.3.5. Inventory Management
- 10.3.6. Services
- 10.4. Market Analysis, Insights and Forecast - by End-User
- 10.4.1. Allied F
- 10.4.2. IT and Telecom
- 10.4.3. Healthcare and Lifesciences
- 10.4.4. Energy and Utilities
- 10.4.5. Oil and Gas
- 10.4.6. Manufacturing
- 10.4.7. Other
- 10.1. Market Analysis, Insights and Forecast - by Deployment Type
- 11. Latin America FSM Industry Analysis, Insights and Forecast, 2019-2031
- 11.1. Market Analysis, Insights and Forecast - by Deployment Type
- 11.1.1. On-premises
- 11.1.2. Cloud
- 11.2. Market Analysis, Insights and Forecast - by Organisation Size
- 11.2.1. Small and Medium Enterprises
- 11.2.2. Large Enterprises
- 11.3. Market Analysis, Insights and Forecast - by FSM Software and Service Type
- 11.3.1. Scheduling, Dispatch & Route Optimization
- 11.3.2. Service Contract Management
- 11.3.3. Work Order Management
- 11.3.4. Customer Management
- 11.3.5. Inventory Management
- 11.3.6. Services
- 11.4. Market Analysis, Insights and Forecast - by End-User
- 11.4.1. Allied F
- 11.4.2. IT and Telecom
- 11.4.3. Healthcare and Lifesciences
- 11.4.4. Energy and Utilities
- 11.4.5. Oil and Gas
- 11.4.6. Manufacturing
- 11.4.7. Other
- 11.1. Market Analysis, Insights and Forecast - by Deployment Type
- 12. North America FSM Industry Analysis, Insights and Forecast, 2019-2031
- 12.1. Market Analysis, Insights and Forecast - By Country/Sub-region
- 12.1.1 United States
- 12.1.2 Canada
- 12.1.3 Mexico
- 13. Europe FSM Industry Analysis, Insights and Forecast, 2019-2031
- 13.1. Market Analysis, Insights and Forecast - By Country/Sub-region
- 13.1.1 Germany
- 13.1.2 United Kingdom
- 13.1.3 France
- 13.1.4 Spain
- 13.1.5 Italy
- 13.1.6 Spain
- 13.1.7 Belgium
- 13.1.8 Netherland
- 13.1.9 Nordics
- 13.1.10 Rest of Europe
- 14. Asia Pacific FSM Industry Analysis, Insights and Forecast, 2019-2031
- 14.1. Market Analysis, Insights and Forecast - By Country/Sub-region
- 14.1.1 China
- 14.1.2 Japan
- 14.1.3 India
- 14.1.4 South Korea
- 14.1.5 Southeast Asia
- 14.1.6 Australia
- 14.1.7 Indonesia
- 14.1.8 Phillipes
- 14.1.9 Singapore
- 14.1.10 Thailandc
- 14.1.11 Rest of Asia Pacific
- 15. South America FSM Industry Analysis, Insights and Forecast, 2019-2031
- 15.1. Market Analysis, Insights and Forecast - By Country/Sub-region
- 15.1.1 Brazil
- 15.1.2 Argentina
- 15.1.3 Peru
- 15.1.4 Chile
- 15.1.5 Colombia
- 15.1.6 Ecuador
- 15.1.7 Venezuela
- 15.1.8 Rest of South America
- 16. North America FSM Industry Analysis, Insights and Forecast, 2019-2031
- 16.1. Market Analysis, Insights and Forecast - By Country/Sub-region
- 16.1.1 United States
- 16.1.2 Canada
- 16.1.3 Mexico
- 17. MEA FSM Industry Analysis, Insights and Forecast, 2019-2031
- 17.1. Market Analysis, Insights and Forecast - By Country/Sub-region
- 17.1.1 United Arab Emirates
- 17.1.2 Saudi Arabia
- 17.1.3 South Africa
- 17.1.4 Rest of Middle East and Africa
- 18. Competitive Analysis
- 18.1. Global Market Share Analysis 2024
- 18.2. Company Profiles
- 18.2.1 Mize Inc
- 18.2.1.1. Overview
- 18.2.1.2. Products
- 18.2.1.3. SWOT Analysis
- 18.2.1.4. Recent Developments
- 18.2.1.5. Financials (Based on Availability)
- 18.2.2 Microsoft Corporation (Dynamics 365 for Field Service)
- 18.2.2.1. Overview
- 18.2.2.2. Products
- 18.2.2.3. SWOT Analysis
- 18.2.2.4. Recent Developments
- 18.2.2.5. Financials (Based on Availability)
- 18.2.3 Zinier Inc
- 18.2.3.1. Overview
- 18.2.3.2. Products
- 18.2.3.3. SWOT Analysis
- 18.2.3.4. Recent Developments
- 18.2.3.5. Financials (Based on Availability)
- 18.2.4 The simPRO Group Pty Limited
- 18.2.4.1. Overview
- 18.2.4.2. Products
- 18.2.4.3. SWOT Analysis
- 18.2.4.4. Recent Developments
- 18.2.4.5. Financials (Based on Availability)
- 18.2.5 Kirona Solutions Limited
- 18.2.5.1. Overview
- 18.2.5.2. Products
- 18.2.5.3. SWOT Analysis
- 18.2.5.4. Recent Developments
- 18.2.5.5. Financials (Based on Availability)
- 18.2.6 IFS AB
- 18.2.6.1. Overview
- 18.2.6.2. Products
- 18.2.6.3. SWOT Analysis
- 18.2.6.4. Recent Developments
- 18.2.6.5. Financials (Based on Availability)
- 18.2.7 ServiceMax Inc
- 18.2.7.1. Overview
- 18.2.7.2. Products
- 18.2.7.3. SWOT Analysis
- 18.2.7.4. Recent Developments
- 18.2.7.5. Financials (Based on Availability)
- 18.2.8 Field Aware US Inc
- 18.2.8.1. Overview
- 18.2.8.2. Products
- 18.2.8.3. SWOT Analysis
- 18.2.8.4. Recent Developments
- 18.2.8.5. Financials (Based on Availability)
- 18.2.9 Salesforce com Inc (Field Service Cloud)
- 18.2.9.1. Overview
- 18.2.9.2. Products
- 18.2.9.3. SWOT Analysis
- 18.2.9.4. Recent Developments
- 18.2.9.5. Financials (Based on Availability)
- 18.2.10 Trimble Inc
- 18.2.10.1. Overview
- 18.2.10.2. Products
- 18.2.10.3. SWOT Analysis
- 18.2.10.4. Recent Developments
- 18.2.10.5. Financials (Based on Availability)
- 18.2.11 Oracle Corporation (OFSC)
- 18.2.11.1. Overview
- 18.2.11.2. Products
- 18.2.11.3. SWOT Analysis
- 18.2.11.4. Recent Developments
- 18.2.11.5. Financials (Based on Availability)
- 18.2.12 Accruent LLC (Fortive Corp)
- 18.2.12.1. Overview
- 18.2.12.2. Products
- 18.2.12.3. SWOT Analysis
- 18.2.12.4. Recent Developments
- 18.2.12.5. Financials (Based on Availability)
- 18.2.13 Coresystems (SAP SE)
- 18.2.13.1. Overview
- 18.2.13.2. Products
- 18.2.13.3. SWOT Analysis
- 18.2.13.4. Recent Developments
- 18.2.13.5. Financials (Based on Availability)
- 18.2.14 ServicePower Inc
- 18.2.14.1. Overview
- 18.2.14.2. Products
- 18.2.14.3. SWOT Analysis
- 18.2.14.4. Recent Developments
- 18.2.14.5. Financials (Based on Availability)
- 18.2.1 Mize Inc
List of Figures
- Figure 1: Global FSM Industry Revenue Breakdown (Million, %) by Region 2024 & 2032
- Figure 2: North America FSM Industry Revenue (Million), by Country 2024 & 2032
- Figure 3: North America FSM Industry Revenue Share (%), by Country 2024 & 2032
- Figure 4: Europe FSM Industry Revenue (Million), by Country 2024 & 2032
- Figure 5: Europe FSM Industry Revenue Share (%), by Country 2024 & 2032
- Figure 6: Asia Pacific FSM Industry Revenue (Million), by Country 2024 & 2032
- Figure 7: Asia Pacific FSM Industry Revenue Share (%), by Country 2024 & 2032
- Figure 8: South America FSM Industry Revenue (Million), by Country 2024 & 2032
- Figure 9: South America FSM Industry Revenue Share (%), by Country 2024 & 2032
- Figure 10: North America FSM Industry Revenue (Million), by Country 2024 & 2032
- Figure 11: North America FSM Industry Revenue Share (%), by Country 2024 & 2032
- Figure 12: MEA FSM Industry Revenue (Million), by Country 2024 & 2032
- Figure 13: MEA FSM Industry Revenue Share (%), by Country 2024 & 2032
- Figure 14: North America FSM Industry Revenue (Million), by Deployment Type 2024 & 2032
- Figure 15: North America FSM Industry Revenue Share (%), by Deployment Type 2024 & 2032
- Figure 16: North America FSM Industry Revenue (Million), by Organisation Size 2024 & 2032
- Figure 17: North America FSM Industry Revenue Share (%), by Organisation Size 2024 & 2032
- Figure 18: North America FSM Industry Revenue (Million), by FSM Software and Service Type 2024 & 2032
- Figure 19: North America FSM Industry Revenue Share (%), by FSM Software and Service Type 2024 & 2032
- Figure 20: North America FSM Industry Revenue (Million), by End-User 2024 & 2032
- Figure 21: North America FSM Industry Revenue Share (%), by End-User 2024 & 2032
- Figure 22: North America FSM Industry Revenue (Million), by Country 2024 & 2032
- Figure 23: North America FSM Industry Revenue Share (%), by Country 2024 & 2032
- Figure 24: Europe FSM Industry Revenue (Million), by Deployment Type 2024 & 2032
- Figure 25: Europe FSM Industry Revenue Share (%), by Deployment Type 2024 & 2032
- Figure 26: Europe FSM Industry Revenue (Million), by Organisation Size 2024 & 2032
- Figure 27: Europe FSM Industry Revenue Share (%), by Organisation Size 2024 & 2032
- Figure 28: Europe FSM Industry Revenue (Million), by FSM Software and Service Type 2024 & 2032
- Figure 29: Europe FSM Industry Revenue Share (%), by FSM Software and Service Type 2024 & 2032
- Figure 30: Europe FSM Industry Revenue (Million), by End-User 2024 & 2032
- Figure 31: Europe FSM Industry Revenue Share (%), by End-User 2024 & 2032
- Figure 32: Europe FSM Industry Revenue (Million), by Country 2024 & 2032
- Figure 33: Europe FSM Industry Revenue Share (%), by Country 2024 & 2032
- Figure 34: Asia FSM Industry Revenue (Million), by Deployment Type 2024 & 2032
- Figure 35: Asia FSM Industry Revenue Share (%), by Deployment Type 2024 & 2032
- Figure 36: Asia FSM Industry Revenue (Million), by Organisation Size 2024 & 2032
- Figure 37: Asia FSM Industry Revenue Share (%), by Organisation Size 2024 & 2032
- Figure 38: Asia FSM Industry Revenue (Million), by FSM Software and Service Type 2024 & 2032
- Figure 39: Asia FSM Industry Revenue Share (%), by FSM Software and Service Type 2024 & 2032
- Figure 40: Asia FSM Industry Revenue (Million), by End-User 2024 & 2032
- Figure 41: Asia FSM Industry Revenue Share (%), by End-User 2024 & 2032
- Figure 42: Asia FSM Industry Revenue (Million), by Country 2024 & 2032
- Figure 43: Asia FSM Industry Revenue Share (%), by Country 2024 & 2032
- Figure 44: Australia and New Zealand FSM Industry Revenue (Million), by Deployment Type 2024 & 2032
- Figure 45: Australia and New Zealand FSM Industry Revenue Share (%), by Deployment Type 2024 & 2032
- Figure 46: Australia and New Zealand FSM Industry Revenue (Million), by Organisation Size 2024 & 2032
- Figure 47: Australia and New Zealand FSM Industry Revenue Share (%), by Organisation Size 2024 & 2032
- Figure 48: Australia and New Zealand FSM Industry Revenue (Million), by FSM Software and Service Type 2024 & 2032
- Figure 49: Australia and New Zealand FSM Industry Revenue Share (%), by FSM Software and Service Type 2024 & 2032
- Figure 50: Australia and New Zealand FSM Industry Revenue (Million), by End-User 2024 & 2032
- Figure 51: Australia and New Zealand FSM Industry Revenue Share (%), by End-User 2024 & 2032
- Figure 52: Australia and New Zealand FSM Industry Revenue (Million), by Country 2024 & 2032
- Figure 53: Australia and New Zealand FSM Industry Revenue Share (%), by Country 2024 & 2032
- Figure 54: Middle East and Africa FSM Industry Revenue (Million), by Deployment Type 2024 & 2032
- Figure 55: Middle East and Africa FSM Industry Revenue Share (%), by Deployment Type 2024 & 2032
- Figure 56: Middle East and Africa FSM Industry Revenue (Million), by Organisation Size 2024 & 2032
- Figure 57: Middle East and Africa FSM Industry Revenue Share (%), by Organisation Size 2024 & 2032
- Figure 58: Middle East and Africa FSM Industry Revenue (Million), by FSM Software and Service Type 2024 & 2032
- Figure 59: Middle East and Africa FSM Industry Revenue Share (%), by FSM Software and Service Type 2024 & 2032
- Figure 60: Middle East and Africa FSM Industry Revenue (Million), by End-User 2024 & 2032
- Figure 61: Middle East and Africa FSM Industry Revenue Share (%), by End-User 2024 & 2032
- Figure 62: Middle East and Africa FSM Industry Revenue (Million), by Country 2024 & 2032
- Figure 63: Middle East and Africa FSM Industry Revenue Share (%), by Country 2024 & 2032
- Figure 64: Latin America FSM Industry Revenue (Million), by Deployment Type 2024 & 2032
- Figure 65: Latin America FSM Industry Revenue Share (%), by Deployment Type 2024 & 2032
- Figure 66: Latin America FSM Industry Revenue (Million), by Organisation Size 2024 & 2032
- Figure 67: Latin America FSM Industry Revenue Share (%), by Organisation Size 2024 & 2032
- Figure 68: Latin America FSM Industry Revenue (Million), by FSM Software and Service Type 2024 & 2032
- Figure 69: Latin America FSM Industry Revenue Share (%), by FSM Software and Service Type 2024 & 2032
- Figure 70: Latin America FSM Industry Revenue (Million), by End-User 2024 & 2032
- Figure 71: Latin America FSM Industry Revenue Share (%), by End-User 2024 & 2032
- Figure 72: Latin America FSM Industry Revenue (Million), by Country 2024 & 2032
- Figure 73: Latin America FSM Industry Revenue Share (%), by Country 2024 & 2032
List of Tables
- Table 1: Global FSM Industry Revenue Million Forecast, by Region 2019 & 2032
- Table 2: Global FSM Industry Revenue Million Forecast, by Deployment Type 2019 & 2032
- Table 3: Global FSM Industry Revenue Million Forecast, by Organisation Size 2019 & 2032
- Table 4: Global FSM Industry Revenue Million Forecast, by FSM Software and Service Type 2019 & 2032
- Table 5: Global FSM Industry Revenue Million Forecast, by End-User 2019 & 2032
- Table 6: Global FSM Industry Revenue Million Forecast, by Region 2019 & 2032
- Table 7: Global FSM Industry Revenue Million Forecast, by Country 2019 & 2032
- Table 8: United States FSM Industry Revenue (Million) Forecast, by Application 2019 & 2032
- Table 9: Canada FSM Industry Revenue (Million) Forecast, by Application 2019 & 2032
- Table 10: Mexico FSM Industry Revenue (Million) Forecast, by Application 2019 & 2032
- Table 11: Global FSM Industry Revenue Million Forecast, by Country 2019 & 2032
- Table 12: Germany FSM Industry Revenue (Million) Forecast, by Application 2019 & 2032
- Table 13: United Kingdom FSM Industry Revenue (Million) Forecast, by Application 2019 & 2032
- Table 14: France FSM Industry Revenue (Million) Forecast, by Application 2019 & 2032
- Table 15: Spain FSM Industry Revenue (Million) Forecast, by Application 2019 & 2032
- Table 16: Italy FSM Industry Revenue (Million) Forecast, by Application 2019 & 2032
- Table 17: Spain FSM Industry Revenue (Million) Forecast, by Application 2019 & 2032
- Table 18: Belgium FSM Industry Revenue (Million) Forecast, by Application 2019 & 2032
- Table 19: Netherland FSM Industry Revenue (Million) Forecast, by Application 2019 & 2032
- Table 20: Nordics FSM Industry Revenue (Million) Forecast, by Application 2019 & 2032
- Table 21: Rest of Europe FSM Industry Revenue (Million) Forecast, by Application 2019 & 2032
- Table 22: Global FSM Industry Revenue Million Forecast, by Country 2019 & 2032
- Table 23: China FSM Industry Revenue (Million) Forecast, by Application 2019 & 2032
- Table 24: Japan FSM Industry Revenue (Million) Forecast, by Application 2019 & 2032
- Table 25: India FSM Industry Revenue (Million) Forecast, by Application 2019 & 2032
- Table 26: South Korea FSM Industry Revenue (Million) Forecast, by Application 2019 & 2032
- Table 27: Southeast Asia FSM Industry Revenue (Million) Forecast, by Application 2019 & 2032
- Table 28: Australia FSM Industry Revenue (Million) Forecast, by Application 2019 & 2032
- Table 29: Indonesia FSM Industry Revenue (Million) Forecast, by Application 2019 & 2032
- Table 30: Phillipes FSM Industry Revenue (Million) Forecast, by Application 2019 & 2032
- Table 31: Singapore FSM Industry Revenue (Million) Forecast, by Application 2019 & 2032
- Table 32: Thailandc FSM Industry Revenue (Million) Forecast, by Application 2019 & 2032
- Table 33: Rest of Asia Pacific FSM Industry Revenue (Million) Forecast, by Application 2019 & 2032
- Table 34: Global FSM Industry Revenue Million Forecast, by Country 2019 & 2032
- Table 35: Brazil FSM Industry Revenue (Million) Forecast, by Application 2019 & 2032
- Table 36: Argentina FSM Industry Revenue (Million) Forecast, by Application 2019 & 2032
- Table 37: Peru FSM Industry Revenue (Million) Forecast, by Application 2019 & 2032
- Table 38: Chile FSM Industry Revenue (Million) Forecast, by Application 2019 & 2032
- Table 39: Colombia FSM Industry Revenue (Million) Forecast, by Application 2019 & 2032
- Table 40: Ecuador FSM Industry Revenue (Million) Forecast, by Application 2019 & 2032
- Table 41: Venezuela FSM Industry Revenue (Million) Forecast, by Application 2019 & 2032
- Table 42: Rest of South America FSM Industry Revenue (Million) Forecast, by Application 2019 & 2032
- Table 43: Global FSM Industry Revenue Million Forecast, by Country 2019 & 2032
- Table 44: United States FSM Industry Revenue (Million) Forecast, by Application 2019 & 2032
- Table 45: Canada FSM Industry Revenue (Million) Forecast, by Application 2019 & 2032
- Table 46: Mexico FSM Industry Revenue (Million) Forecast, by Application 2019 & 2032
- Table 47: Global FSM Industry Revenue Million Forecast, by Country 2019 & 2032
- Table 48: United Arab Emirates FSM Industry Revenue (Million) Forecast, by Application 2019 & 2032
- Table 49: Saudi Arabia FSM Industry Revenue (Million) Forecast, by Application 2019 & 2032
- Table 50: South Africa FSM Industry Revenue (Million) Forecast, by Application 2019 & 2032
- Table 51: Rest of Middle East and Africa FSM Industry Revenue (Million) Forecast, by Application 2019 & 2032
- Table 52: Global FSM Industry Revenue Million Forecast, by Deployment Type 2019 & 2032
- Table 53: Global FSM Industry Revenue Million Forecast, by Organisation Size 2019 & 2032
- Table 54: Global FSM Industry Revenue Million Forecast, by FSM Software and Service Type 2019 & 2032
- Table 55: Global FSM Industry Revenue Million Forecast, by End-User 2019 & 2032
- Table 56: Global FSM Industry Revenue Million Forecast, by Country 2019 & 2032
- Table 57: Global FSM Industry Revenue Million Forecast, by Deployment Type 2019 & 2032
- Table 58: Global FSM Industry Revenue Million Forecast, by Organisation Size 2019 & 2032
- Table 59: Global FSM Industry Revenue Million Forecast, by FSM Software and Service Type 2019 & 2032
- Table 60: Global FSM Industry Revenue Million Forecast, by End-User 2019 & 2032
- Table 61: Global FSM Industry Revenue Million Forecast, by Country 2019 & 2032
- Table 62: Global FSM Industry Revenue Million Forecast, by Deployment Type 2019 & 2032
- Table 63: Global FSM Industry Revenue Million Forecast, by Organisation Size 2019 & 2032
- Table 64: Global FSM Industry Revenue Million Forecast, by FSM Software and Service Type 2019 & 2032
- Table 65: Global FSM Industry Revenue Million Forecast, by End-User 2019 & 2032
- Table 66: Global FSM Industry Revenue Million Forecast, by Country 2019 & 2032
- Table 67: Global FSM Industry Revenue Million Forecast, by Deployment Type 2019 & 2032
- Table 68: Global FSM Industry Revenue Million Forecast, by Organisation Size 2019 & 2032
- Table 69: Global FSM Industry Revenue Million Forecast, by FSM Software and Service Type 2019 & 2032
- Table 70: Global FSM Industry Revenue Million Forecast, by End-User 2019 & 2032
- Table 71: Global FSM Industry Revenue Million Forecast, by Country 2019 & 2032
- Table 72: Global FSM Industry Revenue Million Forecast, by Deployment Type 2019 & 2032
- Table 73: Global FSM Industry Revenue Million Forecast, by Organisation Size 2019 & 2032
- Table 74: Global FSM Industry Revenue Million Forecast, by FSM Software and Service Type 2019 & 2032
- Table 75: Global FSM Industry Revenue Million Forecast, by End-User 2019 & 2032
- Table 76: Global FSM Industry Revenue Million Forecast, by Country 2019 & 2032
- Table 77: Global FSM Industry Revenue Million Forecast, by Deployment Type 2019 & 2032
- Table 78: Global FSM Industry Revenue Million Forecast, by Organisation Size 2019 & 2032
- Table 79: Global FSM Industry Revenue Million Forecast, by FSM Software and Service Type 2019 & 2032
- Table 80: Global FSM Industry Revenue Million Forecast, by End-User 2019 & 2032
- Table 81: Global FSM Industry Revenue Million Forecast, by Country 2019 & 2032
Frequently Asked Questions
1. What is the projected Compound Annual Growth Rate (CAGR) of the FSM Industry?
The projected CAGR is approximately 11.70%.
2. Which companies are prominent players in the FSM Industry?
Key companies in the market include Mize Inc, Microsoft Corporation (Dynamics 365 for Field Service), Zinier Inc, The simPRO Group Pty Limited, Kirona Solutions Limited, IFS AB, ServiceMax Inc, Field Aware US Inc, Salesforce com Inc (Field Service Cloud), Trimble Inc, Oracle Corporation (OFSC), Accruent LLC (Fortive Corp), Coresystems (SAP SE), ServicePower Inc.
3. What are the main segments of the FSM Industry?
The market segments include Deployment Type, Organisation Size, FSM Software and Service Type, End-User.
4. Can you provide details about the market size?
The market size is estimated to be USD 4.94 Million as of 2022.
5. What are some drivers contributing to market growth?
Growing emphasis on maximizing work efficiency; Technological trends such as mobility and adoption of cloud-based solutions; Creation of new sales opportunities.
6. What are the notable trends driving market growth?
Service Contract Management to Hold Significant Market Share.
7. Are there any restraints impacting market growth?
Increasing Risk of Counterfeits.
8. Can you provide examples of recent developments in the market?
October 2022 - OutSmart, a provider of field service management software for small and medium-sized organizations, has been acquired by Visma, a company in cloud software in Europe. OutSmart has operations in the Netherlands, Belgium, Germany, and Portugal. OutSmart can expedite its growth goals by joining Visma due to its software having features for digital scheduling, materials management, quotes, customer relationship management, time tracking, invoicing, project planning, contract and object management, as well as particular features for refrigeration installation.
9. What pricing options are available for accessing the report?
Pricing options include single-user, multi-user, and enterprise licenses priced at USD 4750, USD 5250, and USD 8750 respectively.
10. Is the market size provided in terms of value or volume?
The market size is provided in terms of value, measured in Million.
11. Are there any specific market keywords associated with the report?
Yes, the market keyword associated with the report is "FSM Industry," which aids in identifying and referencing the specific market segment covered.
12. How do I determine which pricing option suits my needs best?
The pricing options vary based on user requirements and access needs. Individual users may opt for single-user licenses, while businesses requiring broader access may choose multi-user or enterprise licenses for cost-effective access to the report.
13. Are there any additional resources or data provided in the FSM Industry report?
While the report offers comprehensive insights, it's advisable to review the specific contents or supplementary materials provided to ascertain if additional resources or data are available.
14. How can I stay updated on further developments or reports in the FSM Industry?
To stay informed about further developments, trends, and reports in the FSM Industry, consider subscribing to industry newsletters, following relevant companies and organizations, or regularly checking reputable industry news sources and publications.
Methodology
Step 1 - Identification of Relevant Samples Size from Population Database


Step 2 - Approaches for Defining Global Market Size (Value, Volume* & Price*)

Note*: In applicable scenarios
Step 3 - Data Sources
Primary Research
- Web Analytics
- Survey Reports
- Research Institute
- Latest Research Reports
- Opinion Leaders
Secondary Research
- Annual Reports
- White Paper
- Latest Press Release
- Industry Association
- Paid Database
- Investor Presentations

Step 4 - Data Triangulation
Involves using different sources of information in order to increase the validity of a study
These sources are likely to be stakeholders in a program - participants, other researchers, program staff, other community members, and so on.
Then we put all data in single framework & apply various statistical tools to find out the dynamic on the market.
During the analysis stage, feedback from the stakeholder groups would be compared to determine areas of agreement as well as areas of divergence


