
Key Insights
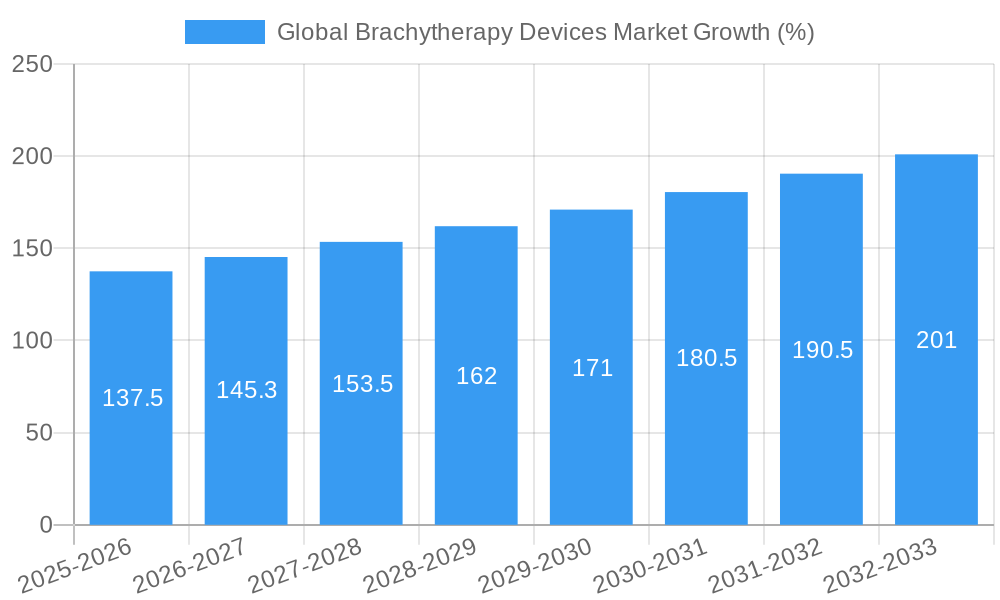
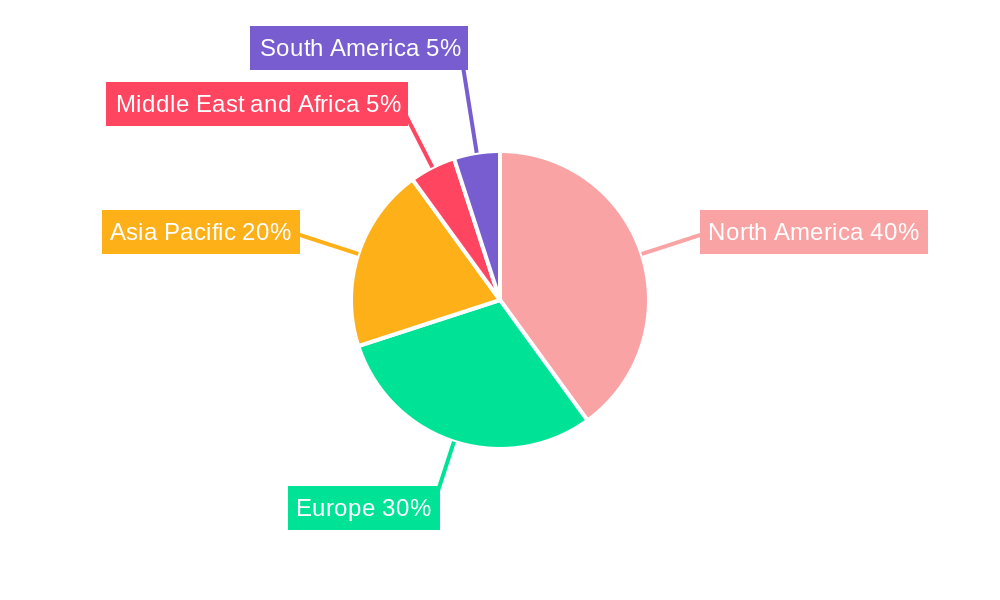
The global brachytherapy devices market is experiencing steady growth, projected to reach a significant market size driven by the increasing prevalence of cancers like prostate, breast, and gynecological cancers. The market's Compound Annual Growth Rate (CAGR) of 5.50% from 2019 to 2024 suggests a robust and expanding demand for these devices. This growth is fueled by several key factors. Technological advancements leading to the development of more precise and efficient high-dose-rate (HDR) and low-dose-rate (LDR) brachytherapy devices are playing a crucial role. Minimally invasive procedures and improved patient outcomes are driving adoption among healthcare providers. Furthermore, the aging global population contributes to a higher incidence of cancers, further boosting market demand. The market is segmented by device type (HDR and LDR) and application (gynecological, prostate, breast, and other cancers), offering opportunities for specialized device manufacturers. North America currently holds a substantial market share due to high healthcare expenditure and advanced infrastructure. However, the Asia Pacific region is expected to witness significant growth in the coming years due to rising healthcare awareness and expanding healthcare infrastructure.
Despite the positive outlook, certain restraints are present. High costs associated with brachytherapy devices and procedures can limit access in developing economies. Stringent regulatory approvals and reimbursement policies also present challenges for market players. Competition among established players and emerging companies contributes to pricing pressures. However, ongoing research and development efforts focusing on improved device design, enhanced precision, and reduced treatment times are likely to mitigate these challenges and sustain the market's growth trajectory throughout the forecast period (2025-2033). The market is expected to continue its expansion, driven by technological innovation and an ever-increasing need for effective cancer treatment modalities. A shift towards minimally invasive procedures and personalized medicine will shape future market trends.
Global Brachytherapy Devices Market Report: 2019-2033
This comprehensive report provides a detailed analysis of the global brachytherapy devices market, offering invaluable insights for industry professionals, investors, and stakeholders. The study period covers 2019-2033, with 2025 as the base and estimated year, and a forecast period of 2025-2033. The report examines market size, segmentation, growth drivers, challenges, and emerging opportunities, providing a 360-degree view of this dynamic sector.
Global Brachytherapy Devices Market Structure & Innovation Trends
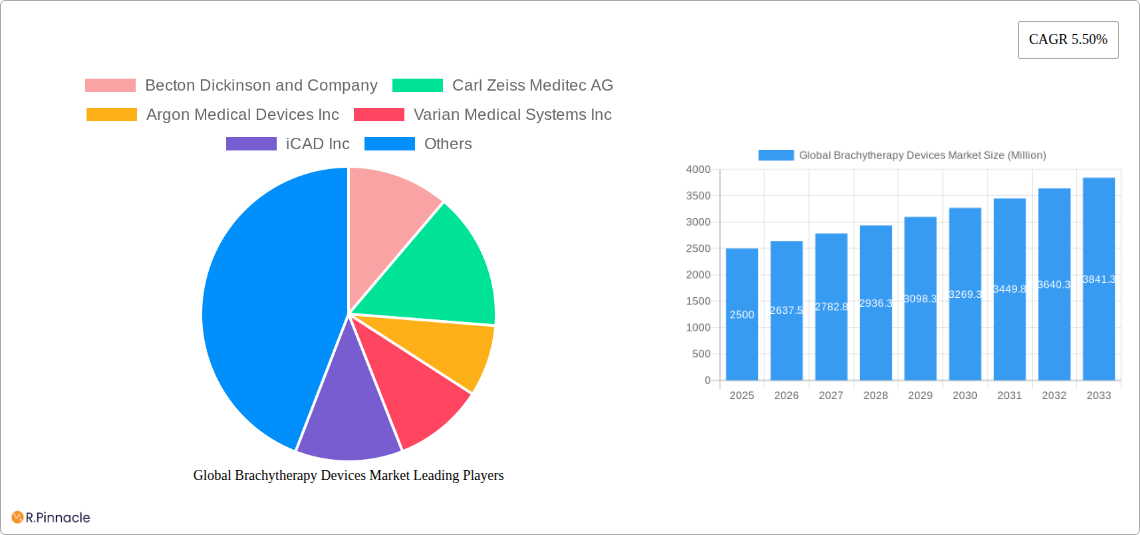
The global brachytherapy devices market exhibits a moderately concentrated structure with key players holding significant market share. The market's competitive landscape is shaped by ongoing innovation, regulatory approvals, and strategic mergers and acquisitions (M&A) activities. While precise market share figures for individual companies are proprietary within the full report, the analysis reveals a dynamic interplay between established players like Becton Dickinson and Company, Varian Medical Systems Inc., and Elekta AB, and smaller, specialized companies such as Isoray Inc. and Eckert & Ziegler BEBIG S.A. Innovation is driven by the need for improved treatment efficacy, reduced side effects, and enhanced patient experience. Regulatory frameworks, particularly those related to safety and efficacy, significantly influence market dynamics. The market also faces competition from alternative cancer therapies. M&A activity is characterized by a mix of strategic acquisitions aimed at expanding product portfolios and geographic reach, with deal values varying significantly depending on the size and scope of the transaction. For example, a xx Million deal in 2024 (predicted) involved a smaller player acquiring a specialized technology. The end-user demographics are predominantly oncology centers and hospitals, with a growing adoption in private clinics.
Global Brachytherapy Devices Market Dynamics & Trends
The global brachytherapy devices market is experiencing robust growth, driven by several factors. The increasing prevalence of cancers, particularly prostate, breast, and gynecological cancers, is a major catalyst. Technological advancements, such as the development of high-dose-rate (HDR) and low-dose-rate (LDR) brachytherapy systems with improved imaging capabilities and delivery techniques, are enhancing treatment outcomes and patient comfort. Furthermore, a rising preference for minimally invasive procedures and improved reimbursement policies are contributing to market expansion. The market is witnessing significant technological disruptions with the integration of advanced imaging technologies, such as MRI and CT, improving treatment planning and accuracy. The CAGR for the forecast period is projected to be xx%, driven by factors discussed above. Market penetration is highest in developed regions, but is steadily increasing in emerging markets with rising healthcare infrastructure and awareness. Competitive dynamics are characterized by ongoing innovation, strategic partnerships, and the introduction of new products and technologies.
Dominant Regions & Segments in Global Brachytherapy Devices Market
- Dominant Region: North America currently holds a leading position in the global brachytherapy devices market, driven by factors such as high cancer prevalence, advanced healthcare infrastructure, and high adoption rates of advanced technologies.
- Dominant Technique: High Dose Rate (HDR) brachytherapy devices dominate the market due to their efficiency and precision, although LDR devices continue to hold a significant share.
- Dominant Application: Prostate cancer treatment accounts for a substantial share of the market, followed by gynecological and breast cancers.
- Key Drivers for North America: Strong healthcare infrastructure, advanced technology adoption, high per capita healthcare expenditure, and favorable regulatory environments.
- Key Drivers for HDR Brachytherapy: Speed and efficiency, reduced treatment time, and potential for outpatient procedures.
- Key Drivers for Prostate Cancer Application: High prevalence of prostate cancer and suitability of brachytherapy for this specific cancer.
The dominance of these segments is further analyzed in the full report through detailed market sizing and forecasting.
Global Brachytherapy Devices Market Product Innovations
Recent years have seen significant advancements in brachytherapy device technology. These include the development of smaller, more precise applicators, improved afterloading systems, and the integration of advanced imaging technologies for enhanced treatment planning. This translates to more effective and comfortable treatments with fewer side effects. The market is also witnessing the emergence of innovative brachytherapy techniques and delivery systems tailored to specific cancer types, further enhancing treatment efficacy and patient outcomes. Companies are focusing on developing devices with better image guidance, improved dose distribution, and reduced treatment time.
Report Scope & Segmentation Analysis
This report segments the global brachytherapy devices market based on technique (High Dose Rate Brachytherapy Devices and Low Dose Rate Brachytherapy Devices) and application (Gynecologic Cancer, Prostate Cancer, Breast Cancer, and Others). Each segment is analyzed in detail, considering its market size, growth rate, and competitive landscape. For example, the HDR brachytherapy segment is expected to witness faster growth compared to the LDR segment due to its advantages in treatment efficiency. Similarly, the prostate cancer application segment holds a significant market share, driven by the high prevalence of prostate cancer and the suitability of brachytherapy for this specific cancer. The “Others” category encompasses various applications including but not limited to lung, skin, and head and neck cancers. Growth projections for each segment are provided in the complete report.
Key Drivers of Global Brachytherapy Devices Market Growth
The market's growth is propelled by several factors: the rising prevalence of various cancers, advancements in brachytherapy technology leading to improved treatment outcomes, growing adoption of minimally invasive procedures, and favorable reimbursement policies. Technological advancements such as improved imaging capabilities and real-time monitoring systems enhance treatment accuracy and effectiveness. Increased awareness of brachytherapy's benefits among both healthcare professionals and patients further drives market growth.
Challenges in the Global Brachytherapy Devices Market Sector
The brachytherapy devices market faces challenges such as high treatment costs, stringent regulatory approvals, and the availability of alternative cancer treatments. The complex nature of brachytherapy requires specialized training and expertise, potentially limiting access in certain regions. Supply chain disruptions and technological advancements also present challenges to market players, influencing pricing strategies and competition. The estimated impact of these constraints on market growth is a predicted reduction of xx% in the forecast period.
Emerging Opportunities in Global Brachytherapy Devices Market
Emerging opportunities lie in the development of advanced brachytherapy techniques and devices with improved accuracy, efficacy, and safety. The integration of artificial intelligence and machine learning in treatment planning and delivery systems presents significant potential. Expanding into untapped markets in developing countries, and focusing on patient-centric care, further creates opportunities for growth. The development of novel radioactive sources and brachytherapy systems for improved tumor targeting, and minimal side effects presents lucrative prospects.
Leading Players in the Global Brachytherapy Devices Market
- Becton Dickinson and Company
- Carl Zeiss Meditec AG
- Argon Medical Devices Inc
- Varian Medical Systems Inc
- iCAD Inc
- CIVCO Medical Solutions
- Theragenics Corporation
- Elekta AB
- Argon Medical
- Eckert & Ziegler BEBIG S.A
- Isoray Inc
Key Developments in Global Brachytherapy Devices Market Industry
- June 2022: Isoray, Inc. hosted a lunch symposium featuring Dr. Stephen J. Frank of the MD Anderson Cancer Center at the American Brachytherapy Society's (ABS) annual conference. This highlights the growing importance of brachytherapy and industry collaboration.
- June 2022: MRI-assisted radiosurgery with C4 Imaging's Sirius offered detailed anatomic information for Prostate Cancer treatment. This signifies the integration of advanced imaging technologies into brachytherapy, enhancing treatment precision.
Future Outlook for Global Brachytherapy Devices Market
The future of the global brachytherapy devices market looks promising, driven by continuous technological advancements, rising cancer prevalence, and growing awareness of brachytherapy's benefits. Strategic collaborations between device manufacturers and healthcare providers will play a crucial role in expanding market access and improving treatment outcomes. The focus on personalized medicine and the development of targeted therapies will further fuel market growth. The predicted xx% growth in the forecast period will be supported by continued investment in research and development and the adoption of innovative treatment methods.
Global Brachytherapy Devices Market Segmentation
-
1. Technique
- 1.1. High Dose Rate Brachytherapy Devices
- 1.2. Low Dose Rate Brachytherapy Devices
-
2. Application
- 2.1. Gynecologic Cancer
- 2.2. Prostrate Cancer
- 2.3. Breast Cancer
- 2.4. Others
Global Brachytherapy Devices Market Segmentation By Geography
-
1. North America
- 1.1. United States
- 1.2. Canada
- 1.3. Mexico
-
2. Europe
- 2.1. Germany
- 2.2. United Kingdom
- 2.3. France
- 2.4. Italy
- 2.5. Spain
- 2.6. Rest of Europe
-
3. Asia Pacific
- 3.1. China
- 3.2. Japan
- 3.3. India
- 3.4. Australia
- 3.5. South Korea
- 3.6. Rest of Asia Pacific
-
4. Middle East and Africa
- 4.1. GCC
- 4.2. South Africa
- 4.3. Rest of Middle East and Africa
-
5. South America
- 5.1. Brazil
- 5.2. Argentina
- 5.3. Rest of South America
Global Brachytherapy Devices Market REPORT HIGHLIGHTS
| Aspects | Details |
|---|---|
| Study Period | 2019-2033 |
| Base Year | 2024 |
| Estimated Year | 2025 |
| Forecast Period | 2025-2033 |
| Historical Period | 2019-2024 |
| Growth Rate | CAGR of 5.50% from 2019-2033 |
| Segmentation |
|
Table of Contents
- 1. Introduction
- 1.1. Research Scope
- 1.2. Market Segmentation
- 1.3. Research Methodology
- 1.4. Definitions and Assumptions
- 2. Executive Summary
- 2.1. Introduction
- 3. Market Dynamics
- 3.1. Introduction
- 3.2. Market Drivers
- 3.2.1. Growing Burden of Cancer; Rising Government Initiatives to Increase Awareness; Technological Advancements in Minimally Invasive Surgical Procedures
- 3.3. Market Restrains
- 3.3.1. Lack of Skilled Radiologists and Advanced Radiotherapy Facilities; Reimbursement Issues
- 3.4. Market Trends
- 3.4.1. Breast Cancer Segment is Expected to Register a Significant Growth Over the Forecast Period
- 4. Market Factor Analysis
- 4.1. Porters Five Forces
- 4.2. Supply/Value Chain
- 4.3. PESTEL analysis
- 4.4. Market Entropy
- 4.5. Patent/Trademark Analysis
- 5. Global Brachytherapy Devices Market Analysis, Insights and Forecast, 2019-2031
- 5.1. Market Analysis, Insights and Forecast - by Technique
- 5.1.1. High Dose Rate Brachytherapy Devices
- 5.1.2. Low Dose Rate Brachytherapy Devices
- 5.2. Market Analysis, Insights and Forecast - by Application
- 5.2.1. Gynecologic Cancer
- 5.2.2. Prostrate Cancer
- 5.2.3. Breast Cancer
- 5.2.4. Others
- 5.3. Market Analysis, Insights and Forecast - by Region
- 5.3.1. North America
- 5.3.2. Europe
- 5.3.3. Asia Pacific
- 5.3.4. Middle East and Africa
- 5.3.5. South America
- 5.1. Market Analysis, Insights and Forecast - by Technique
- 6. North America Global Brachytherapy Devices Market Analysis, Insights and Forecast, 2019-2031
- 6.1. Market Analysis, Insights and Forecast - by Technique
- 6.1.1. High Dose Rate Brachytherapy Devices
- 6.1.2. Low Dose Rate Brachytherapy Devices
- 6.2. Market Analysis, Insights and Forecast - by Application
- 6.2.1. Gynecologic Cancer
- 6.2.2. Prostrate Cancer
- 6.2.3. Breast Cancer
- 6.2.4. Others
- 6.1. Market Analysis, Insights and Forecast - by Technique
- 7. Europe Global Brachytherapy Devices Market Analysis, Insights and Forecast, 2019-2031
- 7.1. Market Analysis, Insights and Forecast - by Technique
- 7.1.1. High Dose Rate Brachytherapy Devices
- 7.1.2. Low Dose Rate Brachytherapy Devices
- 7.2. Market Analysis, Insights and Forecast - by Application
- 7.2.1. Gynecologic Cancer
- 7.2.2. Prostrate Cancer
- 7.2.3. Breast Cancer
- 7.2.4. Others
- 7.1. Market Analysis, Insights and Forecast - by Technique
- 8. Asia Pacific Global Brachytherapy Devices Market Analysis, Insights and Forecast, 2019-2031
- 8.1. Market Analysis, Insights and Forecast - by Technique
- 8.1.1. High Dose Rate Brachytherapy Devices
- 8.1.2. Low Dose Rate Brachytherapy Devices
- 8.2. Market Analysis, Insights and Forecast - by Application
- 8.2.1. Gynecologic Cancer
- 8.2.2. Prostrate Cancer
- 8.2.3. Breast Cancer
- 8.2.4. Others
- 8.1. Market Analysis, Insights and Forecast - by Technique
- 9. Middle East and Africa Global Brachytherapy Devices Market Analysis, Insights and Forecast, 2019-2031
- 9.1. Market Analysis, Insights and Forecast - by Technique
- 9.1.1. High Dose Rate Brachytherapy Devices
- 9.1.2. Low Dose Rate Brachytherapy Devices
- 9.2. Market Analysis, Insights and Forecast - by Application
- 9.2.1. Gynecologic Cancer
- 9.2.2. Prostrate Cancer
- 9.2.3. Breast Cancer
- 9.2.4. Others
- 9.1. Market Analysis, Insights and Forecast - by Technique
- 10. South America Global Brachytherapy Devices Market Analysis, Insights and Forecast, 2019-2031
- 10.1. Market Analysis, Insights and Forecast - by Technique
- 10.1.1. High Dose Rate Brachytherapy Devices
- 10.1.2. Low Dose Rate Brachytherapy Devices
- 10.2. Market Analysis, Insights and Forecast - by Application
- 10.2.1. Gynecologic Cancer
- 10.2.2. Prostrate Cancer
- 10.2.3. Breast Cancer
- 10.2.4. Others
- 10.1. Market Analysis, Insights and Forecast - by Technique
- 11. North America Global Brachytherapy Devices Market Analysis, Insights and Forecast, 2019-2031
- 11.1. Market Analysis, Insights and Forecast - By Country/Sub-region
- 11.1.1. undefined
- 12. Europe Global Brachytherapy Devices Market Analysis, Insights and Forecast, 2019-2031
- 12.1. Market Analysis, Insights and Forecast - By Country/Sub-region
- 12.1.1. undefined
- 13. Asia Pacific Global Brachytherapy Devices Market Analysis, Insights and Forecast, 2019-2031
- 13.1. Market Analysis, Insights and Forecast - By Country/Sub-region
- 13.1.1. undefined
- 14. Middle East and Africa Global Brachytherapy Devices Market Analysis, Insights and Forecast, 2019-2031
- 14.1. Market Analysis, Insights and Forecast - By Country/Sub-region
- 14.1.1. undefined
- 15. South America Global Brachytherapy Devices Market Analysis, Insights and Forecast, 2019-2031
- 15.1. Market Analysis, Insights and Forecast - By Country/Sub-region
- 15.1.1. undefined
- 16. Competitive Analysis
- 16.1. Market Share Analysis 2024
- 16.2. Company Profiles
- 16.2.1 Becton Dickinson and Company
- 16.2.1.1. Overview
- 16.2.1.2. Products
- 16.2.1.3. SWOT Analysis
- 16.2.1.4. Recent Developments
- 16.2.1.5. Financials (Based on Availability)
- 16.2.2 Carl Zeiss Meditec AG
- 16.2.2.1. Overview
- 16.2.2.2. Products
- 16.2.2.3. SWOT Analysis
- 16.2.2.4. Recent Developments
- 16.2.2.5. Financials (Based on Availability)
- 16.2.3 Argon Medical Devices Inc
- 16.2.3.1. Overview
- 16.2.3.2. Products
- 16.2.3.3. SWOT Analysis
- 16.2.3.4. Recent Developments
- 16.2.3.5. Financials (Based on Availability)
- 16.2.4 Varian Medical Systems Inc
- 16.2.4.1. Overview
- 16.2.4.2. Products
- 16.2.4.3. SWOT Analysis
- 16.2.4.4. Recent Developments
- 16.2.4.5. Financials (Based on Availability)
- 16.2.5 iCAD Inc
- 16.2.5.1. Overview
- 16.2.5.2. Products
- 16.2.5.3. SWOT Analysis
- 16.2.5.4. Recent Developments
- 16.2.5.5. Financials (Based on Availability)
- 16.2.6 CIVCO Medical Solutions
- 16.2.6.1. Overview
- 16.2.6.2. Products
- 16.2.6.3. SWOT Analysis
- 16.2.6.4. Recent Developments
- 16.2.6.5. Financials (Based on Availability)
- 16.2.7 Theragenics Corporation
- 16.2.7.1. Overview
- 16.2.7.2. Products
- 16.2.7.3. SWOT Analysis
- 16.2.7.4. Recent Developments
- 16.2.7.5. Financials (Based on Availability)
- 16.2.8 Elekta AB
- 16.2.8.1. Overview
- 16.2.8.2. Products
- 16.2.8.3. SWOT Analysis
- 16.2.8.4. Recent Developments
- 16.2.8.5. Financials (Based on Availability)
- 16.2.9 Argon Medical
- 16.2.9.1. Overview
- 16.2.9.2. Products
- 16.2.9.3. SWOT Analysis
- 16.2.9.4. Recent Developments
- 16.2.9.5. Financials (Based on Availability)
- 16.2.10 Eckert & Ziegler BEBIG S A
- 16.2.10.1. Overview
- 16.2.10.2. Products
- 16.2.10.3. SWOT Analysis
- 16.2.10.4. Recent Developments
- 16.2.10.5. Financials (Based on Availability)
- 16.2.11 Isoray Inc
- 16.2.11.1. Overview
- 16.2.11.2. Products
- 16.2.11.3. SWOT Analysis
- 16.2.11.4. Recent Developments
- 16.2.11.5. Financials (Based on Availability)
- 16.2.1 Becton Dickinson and Company
List of Figures
- Figure 1: Global Global Brachytherapy Devices Market Revenue Breakdown (Million, %) by Region 2024 & 2032
- Figure 2: Global Global Brachytherapy Devices Market Volume Breakdown (K Unit, %) by Region 2024 & 2032
- Figure 3: North America Global Brachytherapy Devices Market Revenue (Million), by Country 2024 & 2032
- Figure 4: North America Global Brachytherapy Devices Market Volume (K Unit), by Country 2024 & 2032
- Figure 5: North America Global Brachytherapy Devices Market Revenue Share (%), by Country 2024 & 2032
- Figure 6: North America Global Brachytherapy Devices Market Volume Share (%), by Country 2024 & 2032
- Figure 7: Europe Global Brachytherapy Devices Market Revenue (Million), by Country 2024 & 2032
- Figure 8: Europe Global Brachytherapy Devices Market Volume (K Unit), by Country 2024 & 2032
- Figure 9: Europe Global Brachytherapy Devices Market Revenue Share (%), by Country 2024 & 2032
- Figure 10: Europe Global Brachytherapy Devices Market Volume Share (%), by Country 2024 & 2032
- Figure 11: Asia Pacific Global Brachytherapy Devices Market Revenue (Million), by Country 2024 & 2032
- Figure 12: Asia Pacific Global Brachytherapy Devices Market Volume (K Unit), by Country 2024 & 2032
- Figure 13: Asia Pacific Global Brachytherapy Devices Market Revenue Share (%), by Country 2024 & 2032
- Figure 14: Asia Pacific Global Brachytherapy Devices Market Volume Share (%), by Country 2024 & 2032
- Figure 15: Middle East and Africa Global Brachytherapy Devices Market Revenue (Million), by Country 2024 & 2032
- Figure 16: Middle East and Africa Global Brachytherapy Devices Market Volume (K Unit), by Country 2024 & 2032
- Figure 17: Middle East and Africa Global Brachytherapy Devices Market Revenue Share (%), by Country 2024 & 2032
- Figure 18: Middle East and Africa Global Brachytherapy Devices Market Volume Share (%), by Country 2024 & 2032
- Figure 19: South America Global Brachytherapy Devices Market Revenue (Million), by Country 2024 & 2032
- Figure 20: South America Global Brachytherapy Devices Market Volume (K Unit), by Country 2024 & 2032
- Figure 21: South America Global Brachytherapy Devices Market Revenue Share (%), by Country 2024 & 2032
- Figure 22: South America Global Brachytherapy Devices Market Volume Share (%), by Country 2024 & 2032
- Figure 23: North America Global Brachytherapy Devices Market Revenue (Million), by Technique 2024 & 2032
- Figure 24: North America Global Brachytherapy Devices Market Volume (K Unit), by Technique 2024 & 2032
- Figure 25: North America Global Brachytherapy Devices Market Revenue Share (%), by Technique 2024 & 2032
- Figure 26: North America Global Brachytherapy Devices Market Volume Share (%), by Technique 2024 & 2032
- Figure 27: North America Global Brachytherapy Devices Market Revenue (Million), by Application 2024 & 2032
- Figure 28: North America Global Brachytherapy Devices Market Volume (K Unit), by Application 2024 & 2032
- Figure 29: North America Global Brachytherapy Devices Market Revenue Share (%), by Application 2024 & 2032
- Figure 30: North America Global Brachytherapy Devices Market Volume Share (%), by Application 2024 & 2032
- Figure 31: North America Global Brachytherapy Devices Market Revenue (Million), by Country 2024 & 2032
- Figure 32: North America Global Brachytherapy Devices Market Volume (K Unit), by Country 2024 & 2032
- Figure 33: North America Global Brachytherapy Devices Market Revenue Share (%), by Country 2024 & 2032
- Figure 34: North America Global Brachytherapy Devices Market Volume Share (%), by Country 2024 & 2032
- Figure 35: Europe Global Brachytherapy Devices Market Revenue (Million), by Technique 2024 & 2032
- Figure 36: Europe Global Brachytherapy Devices Market Volume (K Unit), by Technique 2024 & 2032
- Figure 37: Europe Global Brachytherapy Devices Market Revenue Share (%), by Technique 2024 & 2032
- Figure 38: Europe Global Brachytherapy Devices Market Volume Share (%), by Technique 2024 & 2032
- Figure 39: Europe Global Brachytherapy Devices Market Revenue (Million), by Application 2024 & 2032
- Figure 40: Europe Global Brachytherapy Devices Market Volume (K Unit), by Application 2024 & 2032
- Figure 41: Europe Global Brachytherapy Devices Market Revenue Share (%), by Application 2024 & 2032
- Figure 42: Europe Global Brachytherapy Devices Market Volume Share (%), by Application 2024 & 2032
- Figure 43: Europe Global Brachytherapy Devices Market Revenue (Million), by Country 2024 & 2032
- Figure 44: Europe Global Brachytherapy Devices Market Volume (K Unit), by Country 2024 & 2032
- Figure 45: Europe Global Brachytherapy Devices Market Revenue Share (%), by Country 2024 & 2032
- Figure 46: Europe Global Brachytherapy Devices Market Volume Share (%), by Country 2024 & 2032
- Figure 47: Asia Pacific Global Brachytherapy Devices Market Revenue (Million), by Technique 2024 & 2032
- Figure 48: Asia Pacific Global Brachytherapy Devices Market Volume (K Unit), by Technique 2024 & 2032
- Figure 49: Asia Pacific Global Brachytherapy Devices Market Revenue Share (%), by Technique 2024 & 2032
- Figure 50: Asia Pacific Global Brachytherapy Devices Market Volume Share (%), by Technique 2024 & 2032
- Figure 51: Asia Pacific Global Brachytherapy Devices Market Revenue (Million), by Application 2024 & 2032
- Figure 52: Asia Pacific Global Brachytherapy Devices Market Volume (K Unit), by Application 2024 & 2032
- Figure 53: Asia Pacific Global Brachytherapy Devices Market Revenue Share (%), by Application 2024 & 2032
- Figure 54: Asia Pacific Global Brachytherapy Devices Market Volume Share (%), by Application 2024 & 2032
- Figure 55: Asia Pacific Global Brachytherapy Devices Market Revenue (Million), by Country 2024 & 2032
- Figure 56: Asia Pacific Global Brachytherapy Devices Market Volume (K Unit), by Country 2024 & 2032
- Figure 57: Asia Pacific Global Brachytherapy Devices Market Revenue Share (%), by Country 2024 & 2032
- Figure 58: Asia Pacific Global Brachytherapy Devices Market Volume Share (%), by Country 2024 & 2032
- Figure 59: Middle East and Africa Global Brachytherapy Devices Market Revenue (Million), by Technique 2024 & 2032
- Figure 60: Middle East and Africa Global Brachytherapy Devices Market Volume (K Unit), by Technique 2024 & 2032
- Figure 61: Middle East and Africa Global Brachytherapy Devices Market Revenue Share (%), by Technique 2024 & 2032
- Figure 62: Middle East and Africa Global Brachytherapy Devices Market Volume Share (%), by Technique 2024 & 2032
- Figure 63: Middle East and Africa Global Brachytherapy Devices Market Revenue (Million), by Application 2024 & 2032
- Figure 64: Middle East and Africa Global Brachytherapy Devices Market Volume (K Unit), by Application 2024 & 2032
- Figure 65: Middle East and Africa Global Brachytherapy Devices Market Revenue Share (%), by Application 2024 & 2032
- Figure 66: Middle East and Africa Global Brachytherapy Devices Market Volume Share (%), by Application 2024 & 2032
- Figure 67: Middle East and Africa Global Brachytherapy Devices Market Revenue (Million), by Country 2024 & 2032
- Figure 68: Middle East and Africa Global Brachytherapy Devices Market Volume (K Unit), by Country 2024 & 2032
- Figure 69: Middle East and Africa Global Brachytherapy Devices Market Revenue Share (%), by Country 2024 & 2032
- Figure 70: Middle East and Africa Global Brachytherapy Devices Market Volume Share (%), by Country 2024 & 2032
- Figure 71: South America Global Brachytherapy Devices Market Revenue (Million), by Technique 2024 & 2032
- Figure 72: South America Global Brachytherapy Devices Market Volume (K Unit), by Technique 2024 & 2032
- Figure 73: South America Global Brachytherapy Devices Market Revenue Share (%), by Technique 2024 & 2032
- Figure 74: South America Global Brachytherapy Devices Market Volume Share (%), by Technique 2024 & 2032
- Figure 75: South America Global Brachytherapy Devices Market Revenue (Million), by Application 2024 & 2032
- Figure 76: South America Global Brachytherapy Devices Market Volume (K Unit), by Application 2024 & 2032
- Figure 77: South America Global Brachytherapy Devices Market Revenue Share (%), by Application 2024 & 2032
- Figure 78: South America Global Brachytherapy Devices Market Volume Share (%), by Application 2024 & 2032
- Figure 79: South America Global Brachytherapy Devices Market Revenue (Million), by Country 2024 & 2032
- Figure 80: South America Global Brachytherapy Devices Market Volume (K Unit), by Country 2024 & 2032
- Figure 81: South America Global Brachytherapy Devices Market Revenue Share (%), by Country 2024 & 2032
- Figure 82: South America Global Brachytherapy Devices Market Volume Share (%), by Country 2024 & 2032
List of Tables
- Table 1: Global Brachytherapy Devices Market Revenue Million Forecast, by Region 2019 & 2032
- Table 2: Global Brachytherapy Devices Market Volume K Unit Forecast, by Region 2019 & 2032
- Table 3: Global Brachytherapy Devices Market Revenue Million Forecast, by Technique 2019 & 2032
- Table 4: Global Brachytherapy Devices Market Volume K Unit Forecast, by Technique 2019 & 2032
- Table 5: Global Brachytherapy Devices Market Revenue Million Forecast, by Application 2019 & 2032
- Table 6: Global Brachytherapy Devices Market Volume K Unit Forecast, by Application 2019 & 2032
- Table 7: Global Brachytherapy Devices Market Revenue Million Forecast, by Region 2019 & 2032
- Table 8: Global Brachytherapy Devices Market Volume K Unit Forecast, by Region 2019 & 2032
- Table 9: Global Brachytherapy Devices Market Revenue Million Forecast, by Country 2019 & 2032
- Table 10: Global Brachytherapy Devices Market Volume K Unit Forecast, by Country 2019 & 2032
- Table 11: Global Brachytherapy Devices Market Revenue Million Forecast, by Country 2019 & 2032
- Table 12: Global Brachytherapy Devices Market Volume K Unit Forecast, by Country 2019 & 2032
- Table 13: Global Brachytherapy Devices Market Revenue Million Forecast, by Country 2019 & 2032
- Table 14: Global Brachytherapy Devices Market Volume K Unit Forecast, by Country 2019 & 2032
- Table 15: Global Brachytherapy Devices Market Revenue Million Forecast, by Country 2019 & 2032
- Table 16: Global Brachytherapy Devices Market Volume K Unit Forecast, by Country 2019 & 2032
- Table 17: Global Brachytherapy Devices Market Revenue Million Forecast, by Country 2019 & 2032
- Table 18: Global Brachytherapy Devices Market Volume K Unit Forecast, by Country 2019 & 2032
- Table 19: Global Brachytherapy Devices Market Revenue Million Forecast, by Technique 2019 & 2032
- Table 20: Global Brachytherapy Devices Market Volume K Unit Forecast, by Technique 2019 & 2032
- Table 21: Global Brachytherapy Devices Market Revenue Million Forecast, by Application 2019 & 2032
- Table 22: Global Brachytherapy Devices Market Volume K Unit Forecast, by Application 2019 & 2032
- Table 23: Global Brachytherapy Devices Market Revenue Million Forecast, by Country 2019 & 2032
- Table 24: Global Brachytherapy Devices Market Volume K Unit Forecast, by Country 2019 & 2032
- Table 25: United States Global Brachytherapy Devices Market Revenue (Million) Forecast, by Application 2019 & 2032
- Table 26: United States Global Brachytherapy Devices Market Volume (K Unit) Forecast, by Application 2019 & 2032
- Table 27: Canada Global Brachytherapy Devices Market Revenue (Million) Forecast, by Application 2019 & 2032
- Table 28: Canada Global Brachytherapy Devices Market Volume (K Unit) Forecast, by Application 2019 & 2032
- Table 29: Mexico Global Brachytherapy Devices Market Revenue (Million) Forecast, by Application 2019 & 2032
- Table 30: Mexico Global Brachytherapy Devices Market Volume (K Unit) Forecast, by Application 2019 & 2032
- Table 31: Global Brachytherapy Devices Market Revenue Million Forecast, by Technique 2019 & 2032
- Table 32: Global Brachytherapy Devices Market Volume K Unit Forecast, by Technique 2019 & 2032
- Table 33: Global Brachytherapy Devices Market Revenue Million Forecast, by Application 2019 & 2032
- Table 34: Global Brachytherapy Devices Market Volume K Unit Forecast, by Application 2019 & 2032
- Table 35: Global Brachytherapy Devices Market Revenue Million Forecast, by Country 2019 & 2032
- Table 36: Global Brachytherapy Devices Market Volume K Unit Forecast, by Country 2019 & 2032
- Table 37: Germany Global Brachytherapy Devices Market Revenue (Million) Forecast, by Application 2019 & 2032
- Table 38: Germany Global Brachytherapy Devices Market Volume (K Unit) Forecast, by Application 2019 & 2032
- Table 39: United Kingdom Global Brachytherapy Devices Market Revenue (Million) Forecast, by Application 2019 & 2032
- Table 40: United Kingdom Global Brachytherapy Devices Market Volume (K Unit) Forecast, by Application 2019 & 2032
- Table 41: France Global Brachytherapy Devices Market Revenue (Million) Forecast, by Application 2019 & 2032
- Table 42: France Global Brachytherapy Devices Market Volume (K Unit) Forecast, by Application 2019 & 2032
- Table 43: Italy Global Brachytherapy Devices Market Revenue (Million) Forecast, by Application 2019 & 2032
- Table 44: Italy Global Brachytherapy Devices Market Volume (K Unit) Forecast, by Application 2019 & 2032
- Table 45: Spain Global Brachytherapy Devices Market Revenue (Million) Forecast, by Application 2019 & 2032
- Table 46: Spain Global Brachytherapy Devices Market Volume (K Unit) Forecast, by Application 2019 & 2032
- Table 47: Rest of Europe Global Brachytherapy Devices Market Revenue (Million) Forecast, by Application 2019 & 2032
- Table 48: Rest of Europe Global Brachytherapy Devices Market Volume (K Unit) Forecast, by Application 2019 & 2032
- Table 49: Global Brachytherapy Devices Market Revenue Million Forecast, by Technique 2019 & 2032
- Table 50: Global Brachytherapy Devices Market Volume K Unit Forecast, by Technique 2019 & 2032
- Table 51: Global Brachytherapy Devices Market Revenue Million Forecast, by Application 2019 & 2032
- Table 52: Global Brachytherapy Devices Market Volume K Unit Forecast, by Application 2019 & 2032
- Table 53: Global Brachytherapy Devices Market Revenue Million Forecast, by Country 2019 & 2032
- Table 54: Global Brachytherapy Devices Market Volume K Unit Forecast, by Country 2019 & 2032
- Table 55: China Global Brachytherapy Devices Market Revenue (Million) Forecast, by Application 2019 & 2032
- Table 56: China Global Brachytherapy Devices Market Volume (K Unit) Forecast, by Application 2019 & 2032
- Table 57: Japan Global Brachytherapy Devices Market Revenue (Million) Forecast, by Application 2019 & 2032
- Table 58: Japan Global Brachytherapy Devices Market Volume (K Unit) Forecast, by Application 2019 & 2032
- Table 59: India Global Brachytherapy Devices Market Revenue (Million) Forecast, by Application 2019 & 2032
- Table 60: India Global Brachytherapy Devices Market Volume (K Unit) Forecast, by Application 2019 & 2032
- Table 61: Australia Global Brachytherapy Devices Market Revenue (Million) Forecast, by Application 2019 & 2032
- Table 62: Australia Global Brachytherapy Devices Market Volume (K Unit) Forecast, by Application 2019 & 2032
- Table 63: South Korea Global Brachytherapy Devices Market Revenue (Million) Forecast, by Application 2019 & 2032
- Table 64: South Korea Global Brachytherapy Devices Market Volume (K Unit) Forecast, by Application 2019 & 2032
- Table 65: Rest of Asia Pacific Global Brachytherapy Devices Market Revenue (Million) Forecast, by Application 2019 & 2032
- Table 66: Rest of Asia Pacific Global Brachytherapy Devices Market Volume (K Unit) Forecast, by Application 2019 & 2032
- Table 67: Global Brachytherapy Devices Market Revenue Million Forecast, by Technique 2019 & 2032
- Table 68: Global Brachytherapy Devices Market Volume K Unit Forecast, by Technique 2019 & 2032
- Table 69: Global Brachytherapy Devices Market Revenue Million Forecast, by Application 2019 & 2032
- Table 70: Global Brachytherapy Devices Market Volume K Unit Forecast, by Application 2019 & 2032
- Table 71: Global Brachytherapy Devices Market Revenue Million Forecast, by Country 2019 & 2032
- Table 72: Global Brachytherapy Devices Market Volume K Unit Forecast, by Country 2019 & 2032
- Table 73: GCC Global Brachytherapy Devices Market Revenue (Million) Forecast, by Application 2019 & 2032
- Table 74: GCC Global Brachytherapy Devices Market Volume (K Unit) Forecast, by Application 2019 & 2032
- Table 75: South Africa Global Brachytherapy Devices Market Revenue (Million) Forecast, by Application 2019 & 2032
- Table 76: South Africa Global Brachytherapy Devices Market Volume (K Unit) Forecast, by Application 2019 & 2032
- Table 77: Rest of Middle East and Africa Global Brachytherapy Devices Market Revenue (Million) Forecast, by Application 2019 & 2032
- Table 78: Rest of Middle East and Africa Global Brachytherapy Devices Market Volume (K Unit) Forecast, by Application 2019 & 2032
- Table 79: Global Brachytherapy Devices Market Revenue Million Forecast, by Technique 2019 & 2032
- Table 80: Global Brachytherapy Devices Market Volume K Unit Forecast, by Technique 2019 & 2032
- Table 81: Global Brachytherapy Devices Market Revenue Million Forecast, by Application 2019 & 2032
- Table 82: Global Brachytherapy Devices Market Volume K Unit Forecast, by Application 2019 & 2032
- Table 83: Global Brachytherapy Devices Market Revenue Million Forecast, by Country 2019 & 2032
- Table 84: Global Brachytherapy Devices Market Volume K Unit Forecast, by Country 2019 & 2032
- Table 85: Brazil Global Brachytherapy Devices Market Revenue (Million) Forecast, by Application 2019 & 2032
- Table 86: Brazil Global Brachytherapy Devices Market Volume (K Unit) Forecast, by Application 2019 & 2032
- Table 87: Argentina Global Brachytherapy Devices Market Revenue (Million) Forecast, by Application 2019 & 2032
- Table 88: Argentina Global Brachytherapy Devices Market Volume (K Unit) Forecast, by Application 2019 & 2032
- Table 89: Rest of South America Global Brachytherapy Devices Market Revenue (Million) Forecast, by Application 2019 & 2032
- Table 90: Rest of South America Global Brachytherapy Devices Market Volume (K Unit) Forecast, by Application 2019 & 2032
Frequently Asked Questions
1. What is the projected Compound Annual Growth Rate (CAGR) of the Global Brachytherapy Devices Market?
The projected CAGR is approximately 5.50%.
2. Which companies are prominent players in the Global Brachytherapy Devices Market?
Key companies in the market include Becton Dickinson and Company, Carl Zeiss Meditec AG, Argon Medical Devices Inc, Varian Medical Systems Inc, iCAD Inc, CIVCO Medical Solutions, Theragenics Corporation, Elekta AB, Argon Medical, Eckert & Ziegler BEBIG S A, Isoray Inc.
3. What are the main segments of the Global Brachytherapy Devices Market?
The market segments include Technique, Application.
4. Can you provide details about the market size?
The market size is estimated to be USD XX Million as of 2022.
5. What are some drivers contributing to market growth?
Growing Burden of Cancer; Rising Government Initiatives to Increase Awareness; Technological Advancements in Minimally Invasive Surgical Procedures.
6. What are the notable trends driving market growth?
Breast Cancer Segment is Expected to Register a Significant Growth Over the Forecast Period.
7. Are there any restraints impacting market growth?
Lack of Skilled Radiologists and Advanced Radiotherapy Facilities; Reimbursement Issues.
8. Can you provide examples of recent developments in the market?
In June 2022, Isoray, Inc. hosted a lunch symposium featuring Dr. Stephen J. Frank of the MD Anderson Cancer Center at the American Brachytherapy Society's (ABS) annual conference.
9. What pricing options are available for accessing the report?
Pricing options include single-user, multi-user, and enterprise licenses priced at USD 4750, USD 5250, and USD 8750 respectively.
10. Is the market size provided in terms of value or volume?
The market size is provided in terms of value, measured in Million and volume, measured in K Unit.
11. Are there any specific market keywords associated with the report?
Yes, the market keyword associated with the report is "Global Brachytherapy Devices Market," which aids in identifying and referencing the specific market segment covered.
12. How do I determine which pricing option suits my needs best?
The pricing options vary based on user requirements and access needs. Individual users may opt for single-user licenses, while businesses requiring broader access may choose multi-user or enterprise licenses for cost-effective access to the report.
13. Are there any additional resources or data provided in the Global Brachytherapy Devices Market report?
While the report offers comprehensive insights, it's advisable to review the specific contents or supplementary materials provided to ascertain if additional resources or data are available.
14. How can I stay updated on further developments or reports in the Global Brachytherapy Devices Market?
To stay informed about further developments, trends, and reports in the Global Brachytherapy Devices Market, consider subscribing to industry newsletters, following relevant companies and organizations, or regularly checking reputable industry news sources and publications.
Methodology
Step 1 - Identification of Relevant Samples Size from Population Database


Step 2 - Approaches for Defining Global Market Size (Value, Volume* & Price*)

Note*: In applicable scenarios
Step 3 - Data Sources
Primary Research
- Web Analytics
- Survey Reports
- Research Institute
- Latest Research Reports
- Opinion Leaders
Secondary Research
- Annual Reports
- White Paper
- Latest Press Release
- Industry Association
- Paid Database
- Investor Presentations

Step 4 - Data Triangulation
Involves using different sources of information in order to increase the validity of a study
These sources are likely to be stakeholders in a program - participants, other researchers, program staff, other community members, and so on.
Then we put all data in single framework & apply various statistical tools to find out the dynamic on the market.
During the analysis stage, feedback from the stakeholder groups would be compared to determine areas of agreement as well as areas of divergence


