
Key Insights
The global comprehensive metabolic panel (CMP) market is experiencing robust growth, driven by increasing prevalence of chronic diseases like diabetes, kidney diseases, and liver diseases, necessitating frequent diagnostic testing. The market's 7.20% CAGR indicates a significant expansion from 2019 to 2033. Technological advancements in diagnostic tools, including automated analyzers and point-of-care testing devices, are further fueling market expansion by improving speed, accuracy, and accessibility of CMPs. The increasing geriatric population, a key demographic requiring more frequent CMPs due to higher susceptibility to chronic illnesses, also contributes significantly to market growth. Furthermore, rising healthcare expenditure and improved healthcare infrastructure in developing economies are expanding market access, particularly in regions like Asia-Pacific and South America, although regulatory hurdles and varying reimbursement policies across different geographies pose challenges. The market is segmented by test type (proteins, kidney tests, electrolytes, liver function tests, glucose, others), disease (kidney diseases, diabetes, liver diseases, others), and end-user (point-of-care centers, laboratories). The dominance of established players like Laboratory Corporation of America Holdings and Quest Diagnostics highlights the competitive landscape, although smaller specialized companies are also emerging, particularly in developing innovative testing technologies.
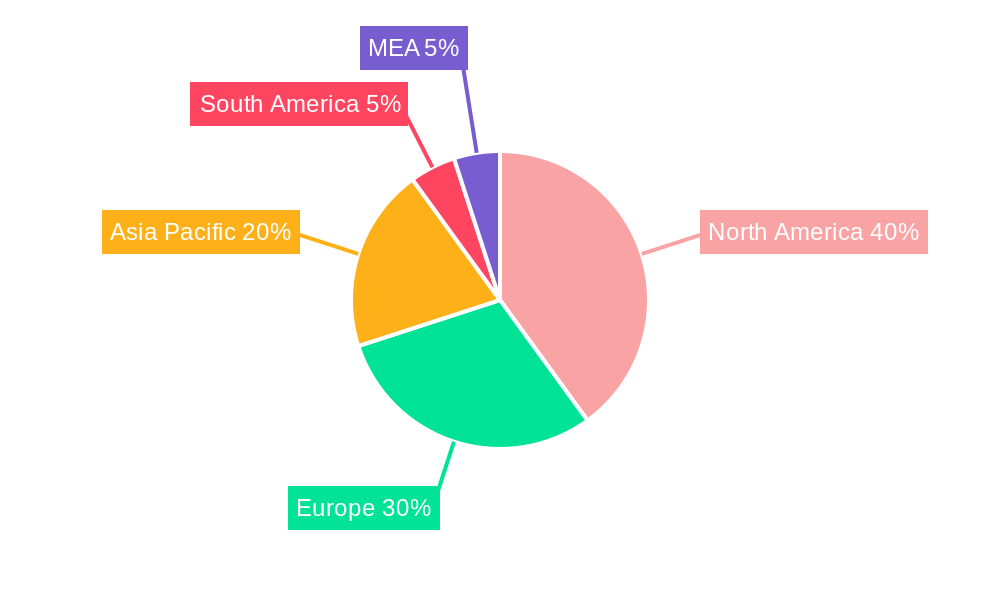
The market segmentation reveals proteins and kidney tests to be significant revenue generators, reflecting the high prevalence of associated diseases. North America currently holds a substantial market share due to advanced healthcare infrastructure and high adoption rates of sophisticated diagnostic technologies. However, the Asia-Pacific region is projected to exhibit the fastest growth in the coming years, driven by rising healthcare expenditure, increasing awareness of preventive healthcare, and a burgeoning middle class. Competitive dynamics are shaping market strategies, with companies focusing on strategic partnerships, acquisitions, and new product development to gain a larger market share. Despite challenges such as fluctuating raw material prices and stringent regulations, the long-term outlook for the CMP market remains positive, projected to reach a substantial market value by 2033 based on the current growth trajectory.
Global Comprehensive Metabolic Panel Market Report: A Deep Dive into Growth, Innovation, and Key Players (2019-2033)
This comprehensive report provides a detailed analysis of the Global Comprehensive Metabolic Panel Market, offering invaluable insights for industry professionals, investors, and strategists. Covering the period from 2019 to 2033, with a focus on 2025, this report unravels market dynamics, identifies key players, and forecasts future growth trajectories. The market is segmented by test type, disease, and end-user, providing a granular understanding of the various market segments and their respective growth potentials.
Global Comprehensive Metabolic Panel Market Structure & Innovation Trends
The Global Comprehensive Metabolic Panel Market exhibits a moderately concentrated structure, with key players such as Laboratory Corporation of America Holdings, Quest Diagnostics, and Abbott Laboratories holding significant market share. However, the market also features several smaller, specialized players, leading to a dynamic competitive landscape. Innovation is driven by the continuous development of more accurate, efficient, and cost-effective testing methods, including point-of-care diagnostics and automation. Regulatory frameworks, particularly those related to diagnostic accuracy and data privacy, play a significant role in shaping market dynamics. The increasing prevalence of chronic diseases like diabetes and kidney disease fuels market growth, while advancements in molecular diagnostics present both opportunities and competitive pressures. M&A activity has been moderate, with deal values ranging from xx Million to xx Million in recent years, primarily focused on expanding testing capabilities and geographic reach. The market is witnessing increased adoption of innovative technologies like AI and machine learning for improved diagnostics and data interpretation, thus posing challenges for conventional approaches. End-user demographics show a rising demand for CMP across diverse age groups and disease prevalence.
Global Comprehensive Metabolic Panel Market Market Dynamics & Trends
The Global Comprehensive Metabolic Panel Market is experiencing robust growth, driven by several key factors. The increasing prevalence of chronic diseases such as diabetes, kidney diseases, and liver diseases is a major driver, necessitating frequent metabolic panel testing. Technological advancements, including the development of automated analyzers and point-of-care testing devices, have improved efficiency and reduced costs. This contributes to an increase in market penetration. A rising geriatric population further fuels market demand. The competitive landscape is intense, with major players focusing on product innovation, strategic partnerships, and acquisitions to maintain market share. Consumer preferences are shifting towards faster, more convenient testing options, creating opportunities for point-of-care testing. The market is estimated to witness a CAGR of xx% during the forecast period (2025-2033), with market penetration expected to reach xx% by 2033. Technological disruptions, such as the emergence of advanced molecular diagnostics, pose both challenges and opportunities for existing players.
Dominant Regions & Segments in Global Comprehensive Metabolic Panel Market
North America currently dominates the Global Comprehensive Metabolic Panel Market, driven by factors such as well-established healthcare infrastructure, high adoption rates of advanced diagnostic technologies, and a large number of diagnostic centers.
- Key Drivers in North America:
- Advanced healthcare infrastructure
- High per capita healthcare expenditure
- Strong regulatory support for diagnostic advancements
- High prevalence of chronic diseases
Europe holds a significant market share, while the Asia-Pacific region is expected to experience rapid growth, propelled by rising healthcare expenditure and increasing awareness of preventive healthcare.
By Test Type: Liver function tests currently hold a dominant position due to high prevalence of liver diseases globally. However, growth is observed in other test types, including kidney tests and glucose tests, with a projected rise driven by increasing incidence of related diseases.
By Disease: Diabetes holds the largest market share due to its high prevalence worldwide. Kidney and liver diseases follow, with projections indicating continued growth across these disease segments.
By End User: Laboratories constitute the largest segment, with high volume testing and specialized equipment supporting their market dominance. However, Point-of-care testing centers are witnessing significant growth driven by demand for faster turnaround times and convenient testing.
Global Comprehensive Metabolic Panel Market Product Innovations
Recent years have seen significant advancements in comprehensive metabolic panel testing technology. Miniaturization of testing devices for point-of-care settings, coupled with automation and improved analytical techniques, has enhanced speed, accuracy, and cost-effectiveness. The integration of artificial intelligence and machine learning algorithms for data analysis and interpretation is also improving diagnostic precision and efficiency, leading to the development of more user-friendly and accessible testing solutions. These innovations are improving diagnostic efficiency, reducing healthcare costs, and boosting the adoption of comprehensive metabolic panels globally.
Report Scope & Segmentation Analysis
This report segments the Global Comprehensive Metabolic Panel Market across various parameters:
By Test Type: Proteins, Kidney Tests, Electrolytes, Liver Function Tests, Glucose, Other Test Types. Each segment's growth trajectory is assessed considering current market size, competitive intensity, and technological developments. Growth projections indicate varying rates for each segment, reflecting diverse disease prevalence and testing demands.
By Disease: Kidney Diseases, Diabetes, Liver Diseases, Other Diseases. Market size projections for each disease segment vary widely, driven by disease prevalence and related testing needs. Competitive intensity is analyzed based on the number of players and innovation activity within each segment.
By End User: Point-of-care Centers and Laboratories. This segmentation reveals differences in market size, growth rates, and competitive pressures faced by each group. Projections account for technology adoption, market penetration, and competitive strategies within each end-user segment.
Key Drivers of Global Comprehensive Metabolic Panel Market Growth
Several factors drive the growth of the Global Comprehensive Metabolic Panel Market. The increasing prevalence of chronic diseases like diabetes and kidney disease significantly boosts demand. Technological advancements, such as automated analyzers and point-of-care testing, improve testing efficiency and accessibility. Rising healthcare expenditure and growing awareness of preventive healthcare are also key contributors. Favorable regulatory policies supporting the adoption of advanced diagnostic technologies further propel market expansion.
Challenges in the Global Comprehensive Metabolic Panel Market Sector
The Global Comprehensive Metabolic Panel Market faces several challenges. Stringent regulatory approvals for new tests and devices create hurdles for innovation. Supply chain disruptions impacting reagent availability can impact testing capacity. Intense competition among established players and emerging companies puts pressure on pricing and profit margins. Variations in reimbursement policies across different healthcare systems further impact market accessibility and profitability.
Emerging Opportunities in Global Comprehensive Metabolic Panel Market
The market presents significant opportunities. Expansion into emerging economies with growing healthcare infrastructure and unmet diagnostic needs offers immense potential. Development of innovative point-of-care diagnostics and advanced molecular testing creates avenues for growth. Integration of artificial intelligence and machine learning to improve diagnostic accuracy and decision-making presents substantial opportunities. Growing focus on personalized medicine further fuels demand for more sophisticated and specific testing.
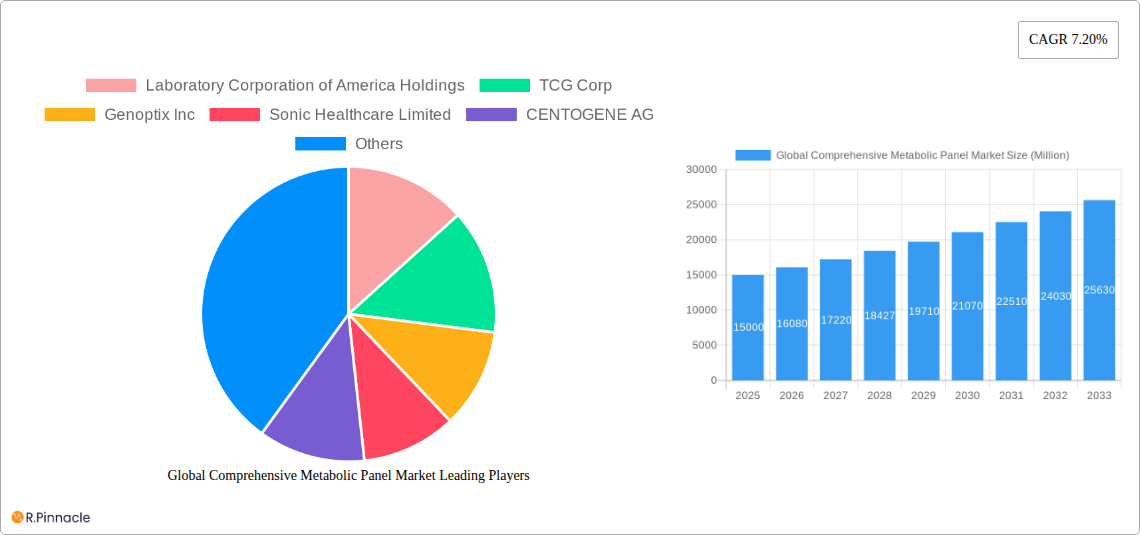
Leading Players in the Global Comprehensive Metabolic Panel Market Market
- Laboratory Corporation of America Holdings
- TCG Corp
- Genoptix Inc
- Sonic Healthcare Limited
- CENTOGENE AG
- Abbott Laboratories
- NeoGenomics Laboratories Inc
- Quest Diagnostics
- Scion Lab Services LLC
- ARUP Laboratories
- Abaxis Inc (Zoetis)
- Charles River Laboratories Inc
- UNIPATH
- SYNLAB International GmbH
Key Developments in Global Comprehensive Metabolic Panel Market Industry
- January 2023: Abbott Laboratories launches a new automated analyzer for comprehensive metabolic panels.
- June 2022: Quest Diagnostics acquires a smaller regional laboratory, expanding its testing network.
- October 2021: New regulations regarding data privacy in diagnostic testing come into effect in the EU.
- March 2020: The COVID-19 pandemic temporarily disrupts the supply chain for certain testing reagents.
Future Outlook for Global Comprehensive Metabolic Panel Market Market
The future of the Global Comprehensive Metabolic Panel Market looks promising. Continued technological advancements, coupled with the rising prevalence of chronic diseases, are expected to drive significant growth. Expansion into emerging markets and the adoption of personalized medicine will create new opportunities. Strategic partnerships and acquisitions among leading players will shape the competitive landscape. The market is poised for substantial expansion, with significant growth potential in the coming years.
Global Comprehensive Metabolic Panel Market Segmentation
-
1. Test Type
- 1.1. Proteins
- 1.2. Kidney Tests
- 1.3. Electrolytes
- 1.4. Liver Function Tests
- 1.5. Glucose
- 1.6. Other Test Types
-
2. Disease
- 2.1. Kidney Diseases
- 2.2. Diabetes
- 2.3. Liver Diseases
- 2.4. Other Diseases
-
3. End User
- 3.1. Point-of-care Centers
- 3.2. Laboratories
Global Comprehensive Metabolic Panel Market Segmentation By Geography
- 1. North America
- 2. Europe
- 3. Asia-Pacific
- 4. Latin America
- 5. Middle East & Africa
Global Comprehensive Metabolic Panel Market REPORT HIGHLIGHTS
| Aspects | Details |
|---|---|
| Study Period | 2019-2033 |
| Base Year | 2024 |
| Estimated Year | 2025 |
| Forecast Period | 2025-2033 |
| Historical Period | 2019-2024 |
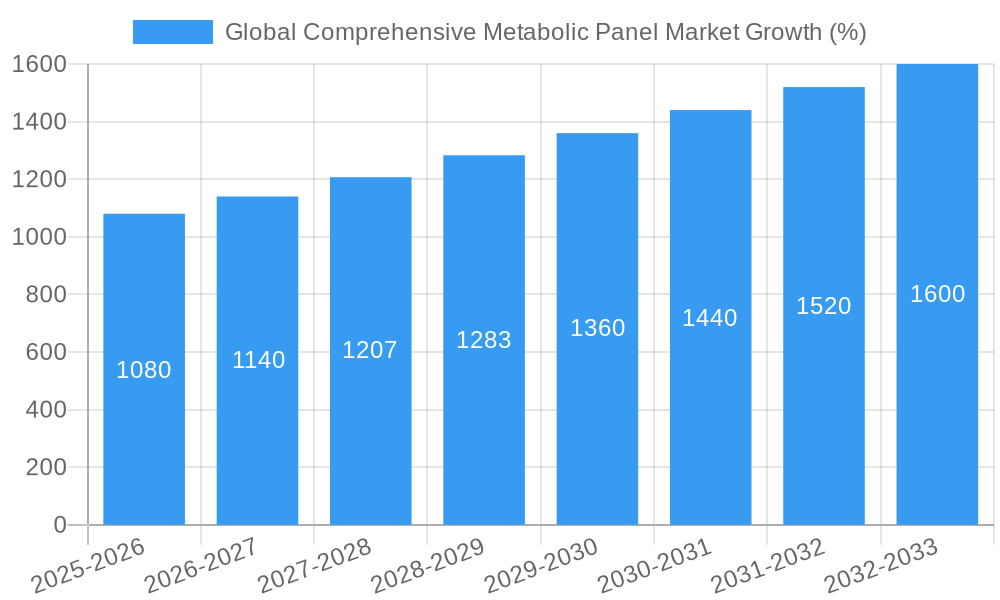
| Growth Rate | CAGR of 7.20% from 2019-2033 |
| Segmentation |
|
Table of Contents
- 1. Introduction
- 1.1. Research Scope
- 1.2. Market Segmentation
- 1.3. Research Methodology
- 1.4. Definitions and Assumptions
- 2. Executive Summary
- 2.1. Introduction
- 3. Market Dynamics
- 3.1. Introduction
- 3.2. Market Drivers
- 3.2.1. Growing Awareness Regarding Early Diagnosis and Treatment of Diseases; Increasing Prevalence of Chronic Diseases
- 3.3. Market Restrains
- 3.3.1. Lack of Skilled Professionals; Stringent Regulatory Policies
- 3.4. Market Trends
- 3.4.1. The Diabetes Segment is Projected to Grow at a Healthy Rate During the Forecast Period
- 4. Market Factor Analysis
- 4.1. Porters Five Forces
- 4.2. Supply/Value Chain
- 4.3. PESTEL analysis
- 4.4. Market Entropy
- 4.5. Patent/Trademark Analysis
- 5. Global Comprehensive Metabolic Panel Market Analysis, Insights and Forecast, 2019-2031
- 5.1. Market Analysis, Insights and Forecast - by Test Type
- 5.1.1. Proteins
- 5.1.2. Kidney Tests
- 5.1.3. Electrolytes
- 5.1.4. Liver Function Tests
- 5.1.5. Glucose
- 5.1.6. Other Test Types
- 5.2. Market Analysis, Insights and Forecast - by Disease
- 5.2.1. Kidney Diseases
- 5.2.2. Diabetes
- 5.2.3. Liver Diseases
- 5.2.4. Other Diseases
- 5.3. Market Analysis, Insights and Forecast - by End User
- 5.3.1. Point-of-care Centers
- 5.3.2. Laboratories
- 5.4. Market Analysis, Insights and Forecast - by Region
- 5.4.1. North America
- 5.4.2. Europe
- 5.4.3. Asia-Pacific
- 5.4.4. Latin America
- 5.4.5. Middle East & Africa
- 5.1. Market Analysis, Insights and Forecast - by Test Type
- 6. North America Global Comprehensive Metabolic Panel Market Analysis, Insights and Forecast, 2019-2031
- 6.1. Market Analysis, Insights and Forecast - by Test Type
- 6.1.1. Proteins
- 6.1.2. Kidney Tests
- 6.1.3. Electrolytes
- 6.1.4. Liver Function Tests
- 6.1.5. Glucose
- 6.1.6. Other Test Types
- 6.2. Market Analysis, Insights and Forecast - by Disease
- 6.2.1. Kidney Diseases
- 6.2.2. Diabetes
- 6.2.3. Liver Diseases
- 6.2.4. Other Diseases
- 6.3. Market Analysis, Insights and Forecast - by End User
- 6.3.1. Point-of-care Centers
- 6.3.2. Laboratories
- 6.1. Market Analysis, Insights and Forecast - by Test Type
- 7. Europe Global Comprehensive Metabolic Panel Market Analysis, Insights and Forecast, 2019-2031
- 7.1. Market Analysis, Insights and Forecast - by Test Type
- 7.1.1. Proteins
- 7.1.2. Kidney Tests
- 7.1.3. Electrolytes
- 7.1.4. Liver Function Tests
- 7.1.5. Glucose
- 7.1.6. Other Test Types
- 7.2. Market Analysis, Insights and Forecast - by Disease
- 7.2.1. Kidney Diseases
- 7.2.2. Diabetes
- 7.2.3. Liver Diseases
- 7.2.4. Other Diseases
- 7.3. Market Analysis, Insights and Forecast - by End User
- 7.3.1. Point-of-care Centers
- 7.3.2. Laboratories
- 7.1. Market Analysis, Insights and Forecast - by Test Type
- 8. Asia-Pacific Global Comprehensive Metabolic Panel Market Analysis, Insights and Forecast, 2019-2031
- 8.1. Market Analysis, Insights and Forecast - by Test Type
- 8.1.1. Proteins
- 8.1.2. Kidney Tests
- 8.1.3. Electrolytes
- 8.1.4. Liver Function Tests
- 8.1.5. Glucose
- 8.1.6. Other Test Types
- 8.2. Market Analysis, Insights and Forecast - by Disease
- 8.2.1. Kidney Diseases
- 8.2.2. Diabetes
- 8.2.3. Liver Diseases
- 8.2.4. Other Diseases
- 8.3. Market Analysis, Insights and Forecast - by End User
- 8.3.1. Point-of-care Centers
- 8.3.2. Laboratories
- 8.1. Market Analysis, Insights and Forecast - by Test Type
- 9. Latin America Global Comprehensive Metabolic Panel Market Analysis, Insights and Forecast, 2019-2031
- 9.1. Market Analysis, Insights and Forecast - by Test Type
- 9.1.1. Proteins
- 9.1.2. Kidney Tests
- 9.1.3. Electrolytes
- 9.1.4. Liver Function Tests
- 9.1.5. Glucose
- 9.1.6. Other Test Types
- 9.2. Market Analysis, Insights and Forecast - by Disease
- 9.2.1. Kidney Diseases
- 9.2.2. Diabetes
- 9.2.3. Liver Diseases
- 9.2.4. Other Diseases
- 9.3. Market Analysis, Insights and Forecast - by End User
- 9.3.1. Point-of-care Centers
- 9.3.2. Laboratories
- 9.1. Market Analysis, Insights and Forecast - by Test Type
- 10. Middle East & Africa Global Comprehensive Metabolic Panel Market Analysis, Insights and Forecast, 2019-2031
- 10.1. Market Analysis, Insights and Forecast - by Test Type
- 10.1.1. Proteins
- 10.1.2. Kidney Tests
- 10.1.3. Electrolytes
- 10.1.4. Liver Function Tests
- 10.1.5. Glucose
- 10.1.6. Other Test Types
- 10.2. Market Analysis, Insights and Forecast - by Disease
- 10.2.1. Kidney Diseases
- 10.2.2. Diabetes
- 10.2.3. Liver Diseases
- 10.2.4. Other Diseases
- 10.3. Market Analysis, Insights and Forecast - by End User
- 10.3.1. Point-of-care Centers
- 10.3.2. Laboratories
- 10.1. Market Analysis, Insights and Forecast - by Test Type
- 11. North America Global Comprehensive Metabolic Panel Market Analysis, Insights and Forecast, 2019-2031
- 11.1. Market Analysis, Insights and Forecast - By Country/Sub-region
- 11.1.1 United States
- 11.1.2 Canada
- 11.1.3 Mexico
- 12. Europe Global Comprehensive Metabolic Panel Market Analysis, Insights and Forecast, 2019-2031
- 12.1. Market Analysis, Insights and Forecast - By Country/Sub-region
- 12.1.1 Germany
- 12.1.2 United Kingdom
- 12.1.3 France
- 12.1.4 Spain
- 12.1.5 Italy
- 12.1.6 Spain
- 12.1.7 Belgium
- 12.1.8 Netherland
- 12.1.9 Nordics
- 12.1.10 Rest of Europe
- 13. Asia Pacific Global Comprehensive Metabolic Panel Market Analysis, Insights and Forecast, 2019-2031
- 13.1. Market Analysis, Insights and Forecast - By Country/Sub-region
- 13.1.1 China
- 13.1.2 Japan
- 13.1.3 India
- 13.1.4 South Korea
- 13.1.5 Southeast Asia
- 13.1.6 Australia
- 13.1.7 Indonesia
- 13.1.8 Phillipes
- 13.1.9 Singapore
- 13.1.10 Thailandc
- 13.1.11 Rest of Asia Pacific
- 14. South America Global Comprehensive Metabolic Panel Market Analysis, Insights and Forecast, 2019-2031
- 14.1. Market Analysis, Insights and Forecast - By Country/Sub-region
- 14.1.1 Brazil
- 14.1.2 Argentina
- 14.1.3 Peru
- 14.1.4 Chile
- 14.1.5 Colombia
- 14.1.6 Ecuador
- 14.1.7 Venezuela
- 14.1.8 Rest of South America
- 15. North America Global Comprehensive Metabolic Panel Market Analysis, Insights and Forecast, 2019-2031
- 15.1. Market Analysis, Insights and Forecast - By Country/Sub-region
- 15.1.1 United States
- 15.1.2 Canada
- 15.1.3 Mexico
- 16. MEA Global Comprehensive Metabolic Panel Market Analysis, Insights and Forecast, 2019-2031
- 16.1. Market Analysis, Insights and Forecast - By Country/Sub-region
- 16.1.1 United Arab Emirates
- 16.1.2 Saudi Arabia
- 16.1.3 South Africa
- 16.1.4 Rest of Middle East and Africa
- 17. Competitive Analysis
- 17.1. Market Share Analysis 2024
- 17.2. Company Profiles
- 17.2.1 Laboratory Corporation of America Holdings
- 17.2.1.1. Overview
- 17.2.1.2. Products
- 17.2.1.3. SWOT Analysis
- 17.2.1.4. Recent Developments
- 17.2.1.5. Financials (Based on Availability)
- 17.2.2 TCG Corp
- 17.2.2.1. Overview
- 17.2.2.2. Products
- 17.2.2.3. SWOT Analysis
- 17.2.2.4. Recent Developments
- 17.2.2.5. Financials (Based on Availability)
- 17.2.3 Genoptix Inc
- 17.2.3.1. Overview
- 17.2.3.2. Products
- 17.2.3.3. SWOT Analysis
- 17.2.3.4. Recent Developments
- 17.2.3.5. Financials (Based on Availability)
- 17.2.4 Sonic Healthcare Limited
- 17.2.4.1. Overview
- 17.2.4.2. Products
- 17.2.4.3. SWOT Analysis
- 17.2.4.4. Recent Developments
- 17.2.4.5. Financials (Based on Availability)
- 17.2.5 CENTOGENE AG
- 17.2.5.1. Overview
- 17.2.5.2. Products
- 17.2.5.3. SWOT Analysis
- 17.2.5.4. Recent Developments
- 17.2.5.5. Financials (Based on Availability)
- 17.2.6 Abbott Laboratories
- 17.2.6.1. Overview
- 17.2.6.2. Products
- 17.2.6.3. SWOT Analysis
- 17.2.6.4. Recent Developments
- 17.2.6.5. Financials (Based on Availability)
- 17.2.7 NeoGenomics Laboratories Inc
- 17.2.7.1. Overview
- 17.2.7.2. Products
- 17.2.7.3. SWOT Analysis
- 17.2.7.4. Recent Developments
- 17.2.7.5. Financials (Based on Availability)
- 17.2.8 Quest Diagnostics
- 17.2.8.1. Overview
- 17.2.8.2. Products
- 17.2.8.3. SWOT Analysis
- 17.2.8.4. Recent Developments
- 17.2.8.5. Financials (Based on Availability)
- 17.2.9 Scion Lab Services LLC
- 17.2.9.1. Overview
- 17.2.9.2. Products
- 17.2.9.3. SWOT Analysis
- 17.2.9.4. Recent Developments
- 17.2.9.5. Financials (Based on Availability)
- 17.2.10 ARUP Laboratories
- 17.2.10.1. Overview
- 17.2.10.2. Products
- 17.2.10.3. SWOT Analysis
- 17.2.10.4. Recent Developments
- 17.2.10.5. Financials (Based on Availability)
- 17.2.11 Abaxis Inc (Zoetis)
- 17.2.11.1. Overview
- 17.2.11.2. Products
- 17.2.11.3. SWOT Analysis
- 17.2.11.4. Recent Developments
- 17.2.11.5. Financials (Based on Availability)
- 17.2.12 Charles River Laboratories Inc
- 17.2.12.1. Overview
- 17.2.12.2. Products
- 17.2.12.3. SWOT Analysis
- 17.2.12.4. Recent Developments
- 17.2.12.5. Financials (Based on Availability)
- 17.2.13 UNIPATH
- 17.2.13.1. Overview
- 17.2.13.2. Products
- 17.2.13.3. SWOT Analysis
- 17.2.13.4. Recent Developments
- 17.2.13.5. Financials (Based on Availability)
- 17.2.14 SYNLAB International GmbH
- 17.2.14.1. Overview
- 17.2.14.2. Products
- 17.2.14.3. SWOT Analysis
- 17.2.14.4. Recent Developments
- 17.2.14.5. Financials (Based on Availability)
- 17.2.1 Laboratory Corporation of America Holdings
List of Figures
- Figure 1: Global Global Comprehensive Metabolic Panel Market Revenue Breakdown (Million, %) by Region 2024 & 2032
- Figure 2: Global Global Comprehensive Metabolic Panel Market Volume Breakdown (K Unit, %) by Region 2024 & 2032
- Figure 3: North America Global Comprehensive Metabolic Panel Market Revenue (Million), by Country 2024 & 2032
- Figure 4: North America Global Comprehensive Metabolic Panel Market Volume (K Unit), by Country 2024 & 2032
- Figure 5: North America Global Comprehensive Metabolic Panel Market Revenue Share (%), by Country 2024 & 2032
- Figure 6: North America Global Comprehensive Metabolic Panel Market Volume Share (%), by Country 2024 & 2032
- Figure 7: Europe Global Comprehensive Metabolic Panel Market Revenue (Million), by Country 2024 & 2032
- Figure 8: Europe Global Comprehensive Metabolic Panel Market Volume (K Unit), by Country 2024 & 2032
- Figure 9: Europe Global Comprehensive Metabolic Panel Market Revenue Share (%), by Country 2024 & 2032
- Figure 10: Europe Global Comprehensive Metabolic Panel Market Volume Share (%), by Country 2024 & 2032
- Figure 11: Asia Pacific Global Comprehensive Metabolic Panel Market Revenue (Million), by Country 2024 & 2032
- Figure 12: Asia Pacific Global Comprehensive Metabolic Panel Market Volume (K Unit), by Country 2024 & 2032
- Figure 13: Asia Pacific Global Comprehensive Metabolic Panel Market Revenue Share (%), by Country 2024 & 2032
- Figure 14: Asia Pacific Global Comprehensive Metabolic Panel Market Volume Share (%), by Country 2024 & 2032
- Figure 15: South America Global Comprehensive Metabolic Panel Market Revenue (Million), by Country 2024 & 2032
- Figure 16: South America Global Comprehensive Metabolic Panel Market Volume (K Unit), by Country 2024 & 2032
- Figure 17: South America Global Comprehensive Metabolic Panel Market Revenue Share (%), by Country 2024 & 2032
- Figure 18: South America Global Comprehensive Metabolic Panel Market Volume Share (%), by Country 2024 & 2032
- Figure 19: North America Global Comprehensive Metabolic Panel Market Revenue (Million), by Country 2024 & 2032
- Figure 20: North America Global Comprehensive Metabolic Panel Market Volume (K Unit), by Country 2024 & 2032
- Figure 21: North America Global Comprehensive Metabolic Panel Market Revenue Share (%), by Country 2024 & 2032
- Figure 22: North America Global Comprehensive Metabolic Panel Market Volume Share (%), by Country 2024 & 2032
- Figure 23: MEA Global Comprehensive Metabolic Panel Market Revenue (Million), by Country 2024 & 2032
- Figure 24: MEA Global Comprehensive Metabolic Panel Market Volume (K Unit), by Country 2024 & 2032
- Figure 25: MEA Global Comprehensive Metabolic Panel Market Revenue Share (%), by Country 2024 & 2032
- Figure 26: MEA Global Comprehensive Metabolic Panel Market Volume Share (%), by Country 2024 & 2032
- Figure 27: North America Global Comprehensive Metabolic Panel Market Revenue (Million), by Test Type 2024 & 2032
- Figure 28: North America Global Comprehensive Metabolic Panel Market Volume (K Unit), by Test Type 2024 & 2032
- Figure 29: North America Global Comprehensive Metabolic Panel Market Revenue Share (%), by Test Type 2024 & 2032
- Figure 30: North America Global Comprehensive Metabolic Panel Market Volume Share (%), by Test Type 2024 & 2032
- Figure 31: North America Global Comprehensive Metabolic Panel Market Revenue (Million), by Disease 2024 & 2032
- Figure 32: North America Global Comprehensive Metabolic Panel Market Volume (K Unit), by Disease 2024 & 2032
- Figure 33: North America Global Comprehensive Metabolic Panel Market Revenue Share (%), by Disease 2024 & 2032
- Figure 34: North America Global Comprehensive Metabolic Panel Market Volume Share (%), by Disease 2024 & 2032
- Figure 35: North America Global Comprehensive Metabolic Panel Market Revenue (Million), by End User 2024 & 2032
- Figure 36: North America Global Comprehensive Metabolic Panel Market Volume (K Unit), by End User 2024 & 2032
- Figure 37: North America Global Comprehensive Metabolic Panel Market Revenue Share (%), by End User 2024 & 2032
- Figure 38: North America Global Comprehensive Metabolic Panel Market Volume Share (%), by End User 2024 & 2032
- Figure 39: North America Global Comprehensive Metabolic Panel Market Revenue (Million), by Country 2024 & 2032
- Figure 40: North America Global Comprehensive Metabolic Panel Market Volume (K Unit), by Country 2024 & 2032
- Figure 41: North America Global Comprehensive Metabolic Panel Market Revenue Share (%), by Country 2024 & 2032
- Figure 42: North America Global Comprehensive Metabolic Panel Market Volume Share (%), by Country 2024 & 2032
- Figure 43: Europe Global Comprehensive Metabolic Panel Market Revenue (Million), by Test Type 2024 & 2032
- Figure 44: Europe Global Comprehensive Metabolic Panel Market Volume (K Unit), by Test Type 2024 & 2032
- Figure 45: Europe Global Comprehensive Metabolic Panel Market Revenue Share (%), by Test Type 2024 & 2032
- Figure 46: Europe Global Comprehensive Metabolic Panel Market Volume Share (%), by Test Type 2024 & 2032
- Figure 47: Europe Global Comprehensive Metabolic Panel Market Revenue (Million), by Disease 2024 & 2032
- Figure 48: Europe Global Comprehensive Metabolic Panel Market Volume (K Unit), by Disease 2024 & 2032
- Figure 49: Europe Global Comprehensive Metabolic Panel Market Revenue Share (%), by Disease 2024 & 2032
- Figure 50: Europe Global Comprehensive Metabolic Panel Market Volume Share (%), by Disease 2024 & 2032
- Figure 51: Europe Global Comprehensive Metabolic Panel Market Revenue (Million), by End User 2024 & 2032
- Figure 52: Europe Global Comprehensive Metabolic Panel Market Volume (K Unit), by End User 2024 & 2032
- Figure 53: Europe Global Comprehensive Metabolic Panel Market Revenue Share (%), by End User 2024 & 2032
- Figure 54: Europe Global Comprehensive Metabolic Panel Market Volume Share (%), by End User 2024 & 2032
- Figure 55: Europe Global Comprehensive Metabolic Panel Market Revenue (Million), by Country 2024 & 2032
- Figure 56: Europe Global Comprehensive Metabolic Panel Market Volume (K Unit), by Country 2024 & 2032
- Figure 57: Europe Global Comprehensive Metabolic Panel Market Revenue Share (%), by Country 2024 & 2032
- Figure 58: Europe Global Comprehensive Metabolic Panel Market Volume Share (%), by Country 2024 & 2032
- Figure 59: Asia-Pacific Global Comprehensive Metabolic Panel Market Revenue (Million), by Test Type 2024 & 2032
- Figure 60: Asia-Pacific Global Comprehensive Metabolic Panel Market Volume (K Unit), by Test Type 2024 & 2032
- Figure 61: Asia-Pacific Global Comprehensive Metabolic Panel Market Revenue Share (%), by Test Type 2024 & 2032
- Figure 62: Asia-Pacific Global Comprehensive Metabolic Panel Market Volume Share (%), by Test Type 2024 & 2032
- Figure 63: Asia-Pacific Global Comprehensive Metabolic Panel Market Revenue (Million), by Disease 2024 & 2032
- Figure 64: Asia-Pacific Global Comprehensive Metabolic Panel Market Volume (K Unit), by Disease 2024 & 2032
- Figure 65: Asia-Pacific Global Comprehensive Metabolic Panel Market Revenue Share (%), by Disease 2024 & 2032
- Figure 66: Asia-Pacific Global Comprehensive Metabolic Panel Market Volume Share (%), by Disease 2024 & 2032
- Figure 67: Asia-Pacific Global Comprehensive Metabolic Panel Market Revenue (Million), by End User 2024 & 2032
- Figure 68: Asia-Pacific Global Comprehensive Metabolic Panel Market Volume (K Unit), by End User 2024 & 2032
- Figure 69: Asia-Pacific Global Comprehensive Metabolic Panel Market Revenue Share (%), by End User 2024 & 2032
- Figure 70: Asia-Pacific Global Comprehensive Metabolic Panel Market Volume Share (%), by End User 2024 & 2032
- Figure 71: Asia-Pacific Global Comprehensive Metabolic Panel Market Revenue (Million), by Country 2024 & 2032
- Figure 72: Asia-Pacific Global Comprehensive Metabolic Panel Market Volume (K Unit), by Country 2024 & 2032
- Figure 73: Asia-Pacific Global Comprehensive Metabolic Panel Market Revenue Share (%), by Country 2024 & 2032
- Figure 74: Asia-Pacific Global Comprehensive Metabolic Panel Market Volume Share (%), by Country 2024 & 2032
- Figure 75: Latin America Global Comprehensive Metabolic Panel Market Revenue (Million), by Test Type 2024 & 2032
- Figure 76: Latin America Global Comprehensive Metabolic Panel Market Volume (K Unit), by Test Type 2024 & 2032
- Figure 77: Latin America Global Comprehensive Metabolic Panel Market Revenue Share (%), by Test Type 2024 & 2032
- Figure 78: Latin America Global Comprehensive Metabolic Panel Market Volume Share (%), by Test Type 2024 & 2032
- Figure 79: Latin America Global Comprehensive Metabolic Panel Market Revenue (Million), by Disease 2024 & 2032
- Figure 80: Latin America Global Comprehensive Metabolic Panel Market Volume (K Unit), by Disease 2024 & 2032
- Figure 81: Latin America Global Comprehensive Metabolic Panel Market Revenue Share (%), by Disease 2024 & 2032
- Figure 82: Latin America Global Comprehensive Metabolic Panel Market Volume Share (%), by Disease 2024 & 2032
- Figure 83: Latin America Global Comprehensive Metabolic Panel Market Revenue (Million), by End User 2024 & 2032
- Figure 84: Latin America Global Comprehensive Metabolic Panel Market Volume (K Unit), by End User 2024 & 2032
- Figure 85: Latin America Global Comprehensive Metabolic Panel Market Revenue Share (%), by End User 2024 & 2032
- Figure 86: Latin America Global Comprehensive Metabolic Panel Market Volume Share (%), by End User 2024 & 2032
- Figure 87: Latin America Global Comprehensive Metabolic Panel Market Revenue (Million), by Country 2024 & 2032
- Figure 88: Latin America Global Comprehensive Metabolic Panel Market Volume (K Unit), by Country 2024 & 2032
- Figure 89: Latin America Global Comprehensive Metabolic Panel Market Revenue Share (%), by Country 2024 & 2032
- Figure 90: Latin America Global Comprehensive Metabolic Panel Market Volume Share (%), by Country 2024 & 2032
- Figure 91: Middle East & Africa Global Comprehensive Metabolic Panel Market Revenue (Million), by Test Type 2024 & 2032
- Figure 92: Middle East & Africa Global Comprehensive Metabolic Panel Market Volume (K Unit), by Test Type 2024 & 2032
- Figure 93: Middle East & Africa Global Comprehensive Metabolic Panel Market Revenue Share (%), by Test Type 2024 & 2032
- Figure 94: Middle East & Africa Global Comprehensive Metabolic Panel Market Volume Share (%), by Test Type 2024 & 2032
- Figure 95: Middle East & Africa Global Comprehensive Metabolic Panel Market Revenue (Million), by Disease 2024 & 2032
- Figure 96: Middle East & Africa Global Comprehensive Metabolic Panel Market Volume (K Unit), by Disease 2024 & 2032
- Figure 97: Middle East & Africa Global Comprehensive Metabolic Panel Market Revenue Share (%), by Disease 2024 & 2032
- Figure 98: Middle East & Africa Global Comprehensive Metabolic Panel Market Volume Share (%), by Disease 2024 & 2032
- Figure 99: Middle East & Africa Global Comprehensive Metabolic Panel Market Revenue (Million), by End User 2024 & 2032
- Figure 100: Middle East & Africa Global Comprehensive Metabolic Panel Market Volume (K Unit), by End User 2024 & 2032
- Figure 101: Middle East & Africa Global Comprehensive Metabolic Panel Market Revenue Share (%), by End User 2024 & 2032
- Figure 102: Middle East & Africa Global Comprehensive Metabolic Panel Market Volume Share (%), by End User 2024 & 2032
- Figure 103: Middle East & Africa Global Comprehensive Metabolic Panel Market Revenue (Million), by Country 2024 & 2032
- Figure 104: Middle East & Africa Global Comprehensive Metabolic Panel Market Volume (K Unit), by Country 2024 & 2032
- Figure 105: Middle East & Africa Global Comprehensive Metabolic Panel Market Revenue Share (%), by Country 2024 & 2032
- Figure 106: Middle East & Africa Global Comprehensive Metabolic Panel Market Volume Share (%), by Country 2024 & 2032
List of Tables
- Table 1: Global Comprehensive Metabolic Panel Market Revenue Million Forecast, by Region 2019 & 2032
- Table 2: Global Comprehensive Metabolic Panel Market Volume K Unit Forecast, by Region 2019 & 2032
- Table 3: Global Comprehensive Metabolic Panel Market Revenue Million Forecast, by Test Type 2019 & 2032
- Table 4: Global Comprehensive Metabolic Panel Market Volume K Unit Forecast, by Test Type 2019 & 2032
- Table 5: Global Comprehensive Metabolic Panel Market Revenue Million Forecast, by Disease 2019 & 2032
- Table 6: Global Comprehensive Metabolic Panel Market Volume K Unit Forecast, by Disease 2019 & 2032
- Table 7: Global Comprehensive Metabolic Panel Market Revenue Million Forecast, by End User 2019 & 2032
- Table 8: Global Comprehensive Metabolic Panel Market Volume K Unit Forecast, by End User 2019 & 2032
- Table 9: Global Comprehensive Metabolic Panel Market Revenue Million Forecast, by Region 2019 & 2032
- Table 10: Global Comprehensive Metabolic Panel Market Volume K Unit Forecast, by Region 2019 & 2032
- Table 11: Global Comprehensive Metabolic Panel Market Revenue Million Forecast, by Country 2019 & 2032
- Table 12: Global Comprehensive Metabolic Panel Market Volume K Unit Forecast, by Country 2019 & 2032
- Table 13: United States Global Comprehensive Metabolic Panel Market Revenue (Million) Forecast, by Application 2019 & 2032
- Table 14: United States Global Comprehensive Metabolic Panel Market Volume (K Unit) Forecast, by Application 2019 & 2032
- Table 15: Canada Global Comprehensive Metabolic Panel Market Revenue (Million) Forecast, by Application 2019 & 2032
- Table 16: Canada Global Comprehensive Metabolic Panel Market Volume (K Unit) Forecast, by Application 2019 & 2032
- Table 17: Mexico Global Comprehensive Metabolic Panel Market Revenue (Million) Forecast, by Application 2019 & 2032
- Table 18: Mexico Global Comprehensive Metabolic Panel Market Volume (K Unit) Forecast, by Application 2019 & 2032
- Table 19: Global Comprehensive Metabolic Panel Market Revenue Million Forecast, by Country 2019 & 2032
- Table 20: Global Comprehensive Metabolic Panel Market Volume K Unit Forecast, by Country 2019 & 2032
- Table 21: Germany Global Comprehensive Metabolic Panel Market Revenue (Million) Forecast, by Application 2019 & 2032
- Table 22: Germany Global Comprehensive Metabolic Panel Market Volume (K Unit) Forecast, by Application 2019 & 2032
- Table 23: United Kingdom Global Comprehensive Metabolic Panel Market Revenue (Million) Forecast, by Application 2019 & 2032
- Table 24: United Kingdom Global Comprehensive Metabolic Panel Market Volume (K Unit) Forecast, by Application 2019 & 2032
- Table 25: France Global Comprehensive Metabolic Panel Market Revenue (Million) Forecast, by Application 2019 & 2032
- Table 26: France Global Comprehensive Metabolic Panel Market Volume (K Unit) Forecast, by Application 2019 & 2032
- Table 27: Spain Global Comprehensive Metabolic Panel Market Revenue (Million) Forecast, by Application 2019 & 2032
- Table 28: Spain Global Comprehensive Metabolic Panel Market Volume (K Unit) Forecast, by Application 2019 & 2032
- Table 29: Italy Global Comprehensive Metabolic Panel Market Revenue (Million) Forecast, by Application 2019 & 2032
- Table 30: Italy Global Comprehensive Metabolic Panel Market Volume (K Unit) Forecast, by Application 2019 & 2032
- Table 31: Spain Global Comprehensive Metabolic Panel Market Revenue (Million) Forecast, by Application 2019 & 2032
- Table 32: Spain Global Comprehensive Metabolic Panel Market Volume (K Unit) Forecast, by Application 2019 & 2032
- Table 33: Belgium Global Comprehensive Metabolic Panel Market Revenue (Million) Forecast, by Application 2019 & 2032
- Table 34: Belgium Global Comprehensive Metabolic Panel Market Volume (K Unit) Forecast, by Application 2019 & 2032
- Table 35: Netherland Global Comprehensive Metabolic Panel Market Revenue (Million) Forecast, by Application 2019 & 2032
- Table 36: Netherland Global Comprehensive Metabolic Panel Market Volume (K Unit) Forecast, by Application 2019 & 2032
- Table 37: Nordics Global Comprehensive Metabolic Panel Market Revenue (Million) Forecast, by Application 2019 & 2032
- Table 38: Nordics Global Comprehensive Metabolic Panel Market Volume (K Unit) Forecast, by Application 2019 & 2032
- Table 39: Rest of Europe Global Comprehensive Metabolic Panel Market Revenue (Million) Forecast, by Application 2019 & 2032
- Table 40: Rest of Europe Global Comprehensive Metabolic Panel Market Volume (K Unit) Forecast, by Application 2019 & 2032
- Table 41: Global Comprehensive Metabolic Panel Market Revenue Million Forecast, by Country 2019 & 2032
- Table 42: Global Comprehensive Metabolic Panel Market Volume K Unit Forecast, by Country 2019 & 2032
- Table 43: China Global Comprehensive Metabolic Panel Market Revenue (Million) Forecast, by Application 2019 & 2032
- Table 44: China Global Comprehensive Metabolic Panel Market Volume (K Unit) Forecast, by Application 2019 & 2032
- Table 45: Japan Global Comprehensive Metabolic Panel Market Revenue (Million) Forecast, by Application 2019 & 2032
- Table 46: Japan Global Comprehensive Metabolic Panel Market Volume (K Unit) Forecast, by Application 2019 & 2032
- Table 47: India Global Comprehensive Metabolic Panel Market Revenue (Million) Forecast, by Application 2019 & 2032
- Table 48: India Global Comprehensive Metabolic Panel Market Volume (K Unit) Forecast, by Application 2019 & 2032
- Table 49: South Korea Global Comprehensive Metabolic Panel Market Revenue (Million) Forecast, by Application 2019 & 2032
- Table 50: South Korea Global Comprehensive Metabolic Panel Market Volume (K Unit) Forecast, by Application 2019 & 2032
- Table 51: Southeast Asia Global Comprehensive Metabolic Panel Market Revenue (Million) Forecast, by Application 2019 & 2032
- Table 52: Southeast Asia Global Comprehensive Metabolic Panel Market Volume (K Unit) Forecast, by Application 2019 & 2032
- Table 53: Australia Global Comprehensive Metabolic Panel Market Revenue (Million) Forecast, by Application 2019 & 2032
- Table 54: Australia Global Comprehensive Metabolic Panel Market Volume (K Unit) Forecast, by Application 2019 & 2032
- Table 55: Indonesia Global Comprehensive Metabolic Panel Market Revenue (Million) Forecast, by Application 2019 & 2032
- Table 56: Indonesia Global Comprehensive Metabolic Panel Market Volume (K Unit) Forecast, by Application 2019 & 2032
- Table 57: Phillipes Global Comprehensive Metabolic Panel Market Revenue (Million) Forecast, by Application 2019 & 2032
- Table 58: Phillipes Global Comprehensive Metabolic Panel Market Volume (K Unit) Forecast, by Application 2019 & 2032
- Table 59: Singapore Global Comprehensive Metabolic Panel Market Revenue (Million) Forecast, by Application 2019 & 2032
- Table 60: Singapore Global Comprehensive Metabolic Panel Market Volume (K Unit) Forecast, by Application 2019 & 2032
- Table 61: Thailandc Global Comprehensive Metabolic Panel Market Revenue (Million) Forecast, by Application 2019 & 2032
- Table 62: Thailandc Global Comprehensive Metabolic Panel Market Volume (K Unit) Forecast, by Application 2019 & 2032
- Table 63: Rest of Asia Pacific Global Comprehensive Metabolic Panel Market Revenue (Million) Forecast, by Application 2019 & 2032
- Table 64: Rest of Asia Pacific Global Comprehensive Metabolic Panel Market Volume (K Unit) Forecast, by Application 2019 & 2032
- Table 65: Global Comprehensive Metabolic Panel Market Revenue Million Forecast, by Country 2019 & 2032
- Table 66: Global Comprehensive Metabolic Panel Market Volume K Unit Forecast, by Country 2019 & 2032
- Table 67: Brazil Global Comprehensive Metabolic Panel Market Revenue (Million) Forecast, by Application 2019 & 2032
- Table 68: Brazil Global Comprehensive Metabolic Panel Market Volume (K Unit) Forecast, by Application 2019 & 2032
- Table 69: Argentina Global Comprehensive Metabolic Panel Market Revenue (Million) Forecast, by Application 2019 & 2032
- Table 70: Argentina Global Comprehensive Metabolic Panel Market Volume (K Unit) Forecast, by Application 2019 & 2032
- Table 71: Peru Global Comprehensive Metabolic Panel Market Revenue (Million) Forecast, by Application 2019 & 2032
- Table 72: Peru Global Comprehensive Metabolic Panel Market Volume (K Unit) Forecast, by Application 2019 & 2032
- Table 73: Chile Global Comprehensive Metabolic Panel Market Revenue (Million) Forecast, by Application 2019 & 2032
- Table 74: Chile Global Comprehensive Metabolic Panel Market Volume (K Unit) Forecast, by Application 2019 & 2032
- Table 75: Colombia Global Comprehensive Metabolic Panel Market Revenue (Million) Forecast, by Application 2019 & 2032
- Table 76: Colombia Global Comprehensive Metabolic Panel Market Volume (K Unit) Forecast, by Application 2019 & 2032
- Table 77: Ecuador Global Comprehensive Metabolic Panel Market Revenue (Million) Forecast, by Application 2019 & 2032
- Table 78: Ecuador Global Comprehensive Metabolic Panel Market Volume (K Unit) Forecast, by Application 2019 & 2032
- Table 79: Venezuela Global Comprehensive Metabolic Panel Market Revenue (Million) Forecast, by Application 2019 & 2032
- Table 80: Venezuela Global Comprehensive Metabolic Panel Market Volume (K Unit) Forecast, by Application 2019 & 2032
- Table 81: Rest of South America Global Comprehensive Metabolic Panel Market Revenue (Million) Forecast, by Application 2019 & 2032
- Table 82: Rest of South America Global Comprehensive Metabolic Panel Market Volume (K Unit) Forecast, by Application 2019 & 2032
- Table 83: Global Comprehensive Metabolic Panel Market Revenue Million Forecast, by Country 2019 & 2032
- Table 84: Global Comprehensive Metabolic Panel Market Volume K Unit Forecast, by Country 2019 & 2032
- Table 85: United States Global Comprehensive Metabolic Panel Market Revenue (Million) Forecast, by Application 2019 & 2032
- Table 86: United States Global Comprehensive Metabolic Panel Market Volume (K Unit) Forecast, by Application 2019 & 2032
- Table 87: Canada Global Comprehensive Metabolic Panel Market Revenue (Million) Forecast, by Application 2019 & 2032
- Table 88: Canada Global Comprehensive Metabolic Panel Market Volume (K Unit) Forecast, by Application 2019 & 2032
- Table 89: Mexico Global Comprehensive Metabolic Panel Market Revenue (Million) Forecast, by Application 2019 & 2032
- Table 90: Mexico Global Comprehensive Metabolic Panel Market Volume (K Unit) Forecast, by Application 2019 & 2032
- Table 91: Global Comprehensive Metabolic Panel Market Revenue Million Forecast, by Country 2019 & 2032
- Table 92: Global Comprehensive Metabolic Panel Market Volume K Unit Forecast, by Country 2019 & 2032
- Table 93: United Arab Emirates Global Comprehensive Metabolic Panel Market Revenue (Million) Forecast, by Application 2019 & 2032
- Table 94: United Arab Emirates Global Comprehensive Metabolic Panel Market Volume (K Unit) Forecast, by Application 2019 & 2032
- Table 95: Saudi Arabia Global Comprehensive Metabolic Panel Market Revenue (Million) Forecast, by Application 2019 & 2032
- Table 96: Saudi Arabia Global Comprehensive Metabolic Panel Market Volume (K Unit) Forecast, by Application 2019 & 2032
- Table 97: South Africa Global Comprehensive Metabolic Panel Market Revenue (Million) Forecast, by Application 2019 & 2032
- Table 98: South Africa Global Comprehensive Metabolic Panel Market Volume (K Unit) Forecast, by Application 2019 & 2032
- Table 99: Rest of Middle East and Africa Global Comprehensive Metabolic Panel Market Revenue (Million) Forecast, by Application 2019 & 2032
- Table 100: Rest of Middle East and Africa Global Comprehensive Metabolic Panel Market Volume (K Unit) Forecast, by Application 2019 & 2032
- Table 101: Global Comprehensive Metabolic Panel Market Revenue Million Forecast, by Test Type 2019 & 2032
- Table 102: Global Comprehensive Metabolic Panel Market Volume K Unit Forecast, by Test Type 2019 & 2032
- Table 103: Global Comprehensive Metabolic Panel Market Revenue Million Forecast, by Disease 2019 & 2032
- Table 104: Global Comprehensive Metabolic Panel Market Volume K Unit Forecast, by Disease 2019 & 2032
- Table 105: Global Comprehensive Metabolic Panel Market Revenue Million Forecast, by End User 2019 & 2032
- Table 106: Global Comprehensive Metabolic Panel Market Volume K Unit Forecast, by End User 2019 & 2032
- Table 107: Global Comprehensive Metabolic Panel Market Revenue Million Forecast, by Country 2019 & 2032
- Table 108: Global Comprehensive Metabolic Panel Market Volume K Unit Forecast, by Country 2019 & 2032
- Table 109: Global Comprehensive Metabolic Panel Market Revenue Million Forecast, by Test Type 2019 & 2032
- Table 110: Global Comprehensive Metabolic Panel Market Volume K Unit Forecast, by Test Type 2019 & 2032
- Table 111: Global Comprehensive Metabolic Panel Market Revenue Million Forecast, by Disease 2019 & 2032
- Table 112: Global Comprehensive Metabolic Panel Market Volume K Unit Forecast, by Disease 2019 & 2032
- Table 113: Global Comprehensive Metabolic Panel Market Revenue Million Forecast, by End User 2019 & 2032
- Table 114: Global Comprehensive Metabolic Panel Market Volume K Unit Forecast, by End User 2019 & 2032
- Table 115: Global Comprehensive Metabolic Panel Market Revenue Million Forecast, by Country 2019 & 2032
- Table 116: Global Comprehensive Metabolic Panel Market Volume K Unit Forecast, by Country 2019 & 2032
- Table 117: Global Comprehensive Metabolic Panel Market Revenue Million Forecast, by Test Type 2019 & 2032
- Table 118: Global Comprehensive Metabolic Panel Market Volume K Unit Forecast, by Test Type 2019 & 2032
- Table 119: Global Comprehensive Metabolic Panel Market Revenue Million Forecast, by Disease 2019 & 2032
- Table 120: Global Comprehensive Metabolic Panel Market Volume K Unit Forecast, by Disease 2019 & 2032
- Table 121: Global Comprehensive Metabolic Panel Market Revenue Million Forecast, by End User 2019 & 2032
- Table 122: Global Comprehensive Metabolic Panel Market Volume K Unit Forecast, by End User 2019 & 2032
- Table 123: Global Comprehensive Metabolic Panel Market Revenue Million Forecast, by Country 2019 & 2032
- Table 124: Global Comprehensive Metabolic Panel Market Volume K Unit Forecast, by Country 2019 & 2032
- Table 125: Global Comprehensive Metabolic Panel Market Revenue Million Forecast, by Test Type 2019 & 2032
- Table 126: Global Comprehensive Metabolic Panel Market Volume K Unit Forecast, by Test Type 2019 & 2032
- Table 127: Global Comprehensive Metabolic Panel Market Revenue Million Forecast, by Disease 2019 & 2032
- Table 128: Global Comprehensive Metabolic Panel Market Volume K Unit Forecast, by Disease 2019 & 2032
- Table 129: Global Comprehensive Metabolic Panel Market Revenue Million Forecast, by End User 2019 & 2032
- Table 130: Global Comprehensive Metabolic Panel Market Volume K Unit Forecast, by End User 2019 & 2032
- Table 131: Global Comprehensive Metabolic Panel Market Revenue Million Forecast, by Country 2019 & 2032
- Table 132: Global Comprehensive Metabolic Panel Market Volume K Unit Forecast, by Country 2019 & 2032
- Table 133: Global Comprehensive Metabolic Panel Market Revenue Million Forecast, by Test Type 2019 & 2032
- Table 134: Global Comprehensive Metabolic Panel Market Volume K Unit Forecast, by Test Type 2019 & 2032
- Table 135: Global Comprehensive Metabolic Panel Market Revenue Million Forecast, by Disease 2019 & 2032
- Table 136: Global Comprehensive Metabolic Panel Market Volume K Unit Forecast, by Disease 2019 & 2032
- Table 137: Global Comprehensive Metabolic Panel Market Revenue Million Forecast, by End User 2019 & 2032
- Table 138: Global Comprehensive Metabolic Panel Market Volume K Unit Forecast, by End User 2019 & 2032
- Table 139: Global Comprehensive Metabolic Panel Market Revenue Million Forecast, by Country 2019 & 2032
- Table 140: Global Comprehensive Metabolic Panel Market Volume K Unit Forecast, by Country 2019 & 2032
Frequently Asked Questions
1. What is the projected Compound Annual Growth Rate (CAGR) of the Global Comprehensive Metabolic Panel Market?
The projected CAGR is approximately 7.20%.
2. Which companies are prominent players in the Global Comprehensive Metabolic Panel Market?
Key companies in the market include Laboratory Corporation of America Holdings, TCG Corp, Genoptix Inc, Sonic Healthcare Limited, CENTOGENE AG, Abbott Laboratories, NeoGenomics Laboratories Inc, Quest Diagnostics, Scion Lab Services LLC, ARUP Laboratories, Abaxis Inc (Zoetis), Charles River Laboratories Inc, UNIPATH, SYNLAB International GmbH.
3. What are the main segments of the Global Comprehensive Metabolic Panel Market?
The market segments include Test Type, Disease, End User.
4. Can you provide details about the market size?
The market size is estimated to be USD XX Million as of 2022.
5. What are some drivers contributing to market growth?
Growing Awareness Regarding Early Diagnosis and Treatment of Diseases; Increasing Prevalence of Chronic Diseases.
6. What are the notable trends driving market growth?
The Diabetes Segment is Projected to Grow at a Healthy Rate During the Forecast Period.
7. Are there any restraints impacting market growth?
Lack of Skilled Professionals; Stringent Regulatory Policies.
8. Can you provide examples of recent developments in the market?
N/A
9. What pricing options are available for accessing the report?
Pricing options include single-user, multi-user, and enterprise licenses priced at USD 4750, USD 5250, and USD 8750 respectively.
10. Is the market size provided in terms of value or volume?
The market size is provided in terms of value, measured in Million and volume, measured in K Unit.
11. Are there any specific market keywords associated with the report?
Yes, the market keyword associated with the report is "Global Comprehensive Metabolic Panel Market," which aids in identifying and referencing the specific market segment covered.
12. How do I determine which pricing option suits my needs best?
The pricing options vary based on user requirements and access needs. Individual users may opt for single-user licenses, while businesses requiring broader access may choose multi-user or enterprise licenses for cost-effective access to the report.
13. Are there any additional resources or data provided in the Global Comprehensive Metabolic Panel Market report?
While the report offers comprehensive insights, it's advisable to review the specific contents or supplementary materials provided to ascertain if additional resources or data are available.
14. How can I stay updated on further developments or reports in the Global Comprehensive Metabolic Panel Market?
To stay informed about further developments, trends, and reports in the Global Comprehensive Metabolic Panel Market, consider subscribing to industry newsletters, following relevant companies and organizations, or regularly checking reputable industry news sources and publications.
Methodology
Step 1 - Identification of Relevant Samples Size from Population Database


Step 2 - Approaches for Defining Global Market Size (Value, Volume* & Price*)

Note*: In applicable scenarios
Step 3 - Data Sources
Primary Research
- Web Analytics
- Survey Reports
- Research Institute
- Latest Research Reports
- Opinion Leaders
Secondary Research
- Annual Reports
- White Paper
- Latest Press Release
- Industry Association
- Paid Database
- Investor Presentations

Step 4 - Data Triangulation
Involves using different sources of information in order to increase the validity of a study
These sources are likely to be stakeholders in a program - participants, other researchers, program staff, other community members, and so on.
Then we put all data in single framework & apply various statistical tools to find out the dynamic on the market.
During the analysis stage, feedback from the stakeholder groups would be compared to determine areas of agreement as well as areas of divergence


