
Key Insights
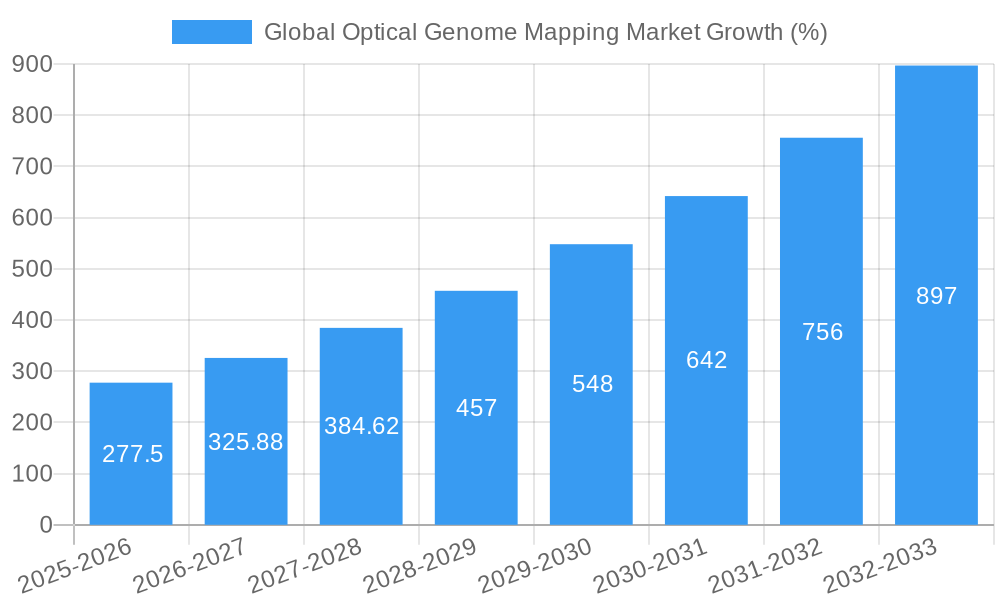
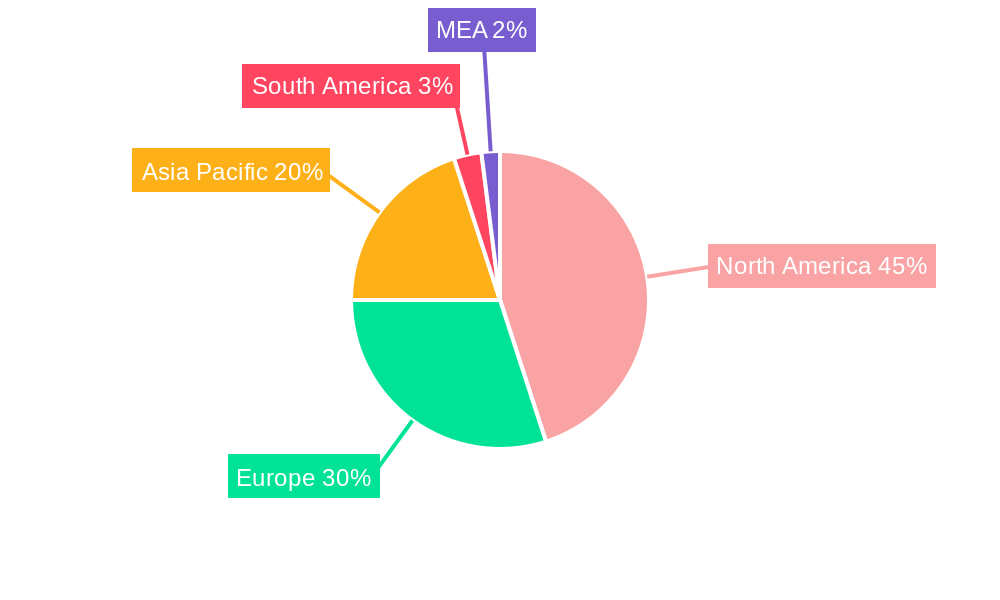
The global optical genome mapping market is experiencing robust growth, driven by the increasing demand for advanced genomic analysis techniques in various sectors. The market's Compound Annual Growth Rate (CAGR) of 18.50% from 2019 to 2024 signifies significant market expansion. This growth is fueled by several key factors: the rising prevalence of genetic disorders necessitating precise diagnostic tools, advancements in optical genome mapping technology resulting in higher accuracy and throughput, and the increasing adoption of personalized medicine approaches relying on comprehensive genomic information. Furthermore, the growing research activities in genomics and the expanding biotechnology and pharmaceutical industries contribute significantly to the market's expansion. The market segmentation reveals a strong demand for both instruments and consumables, with biotechnology and pharmaceutical companies being major end-users. While North America currently holds a substantial market share, the Asia-Pacific region is projected to witness faster growth due to rising healthcare expenditure and increasing investment in research infrastructure.
The market's growth, however, faces some restraints, including the high cost of instruments and consumables, the complexity of the technology requiring specialized expertise, and the need for stringent regulatory approvals. Nevertheless, ongoing technological advancements, the development of user-friendly interfaces, and strategic collaborations between technology providers and research institutions are anticipated to mitigate these challenges. The forecast period (2025-2033) presents significant opportunities for market expansion, particularly in emerging economies with increasing investments in genomics research and healthcare infrastructure. The competitive landscape is characterized by both established players and emerging companies, fostering innovation and driving further market development. Considering the projected CAGR and market dynamics, the total market size is expected to significantly increase over the forecast period, representing substantial growth for both established and new entrants in this dynamic sector.
Global Optical Genome Mapping Market Report: 2019-2033
This comprehensive report provides a detailed analysis of the Global Optical Genome Mapping Market, offering actionable insights for industry professionals, investors, and researchers. Covering the period from 2019 to 2033, with a base year of 2025 and a forecast period of 2025-2033, this report meticulously examines market structure, dynamics, leading players, and future trends. The market is projected to reach xx Million by 2033, exhibiting a CAGR of xx% during the forecast period.
Global Optical Genome Mapping Market Structure & Innovation Trends
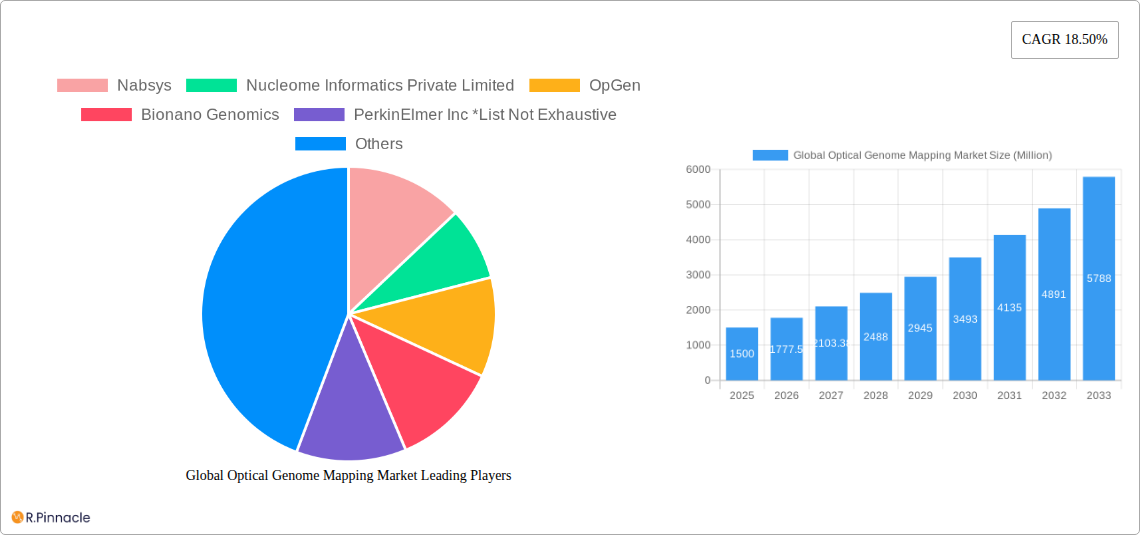
The Global Optical Genome Mapping Market exhibits a moderately concentrated structure, with key players such as Bionano Genomics, PerkinElmer Inc, OpGen, Nabsys, and Nucleome Informatics Private Limited holding significant market share. However, the market also features several smaller players and emerging companies. The exact market share distribution amongst these players in 2025 is estimated to be as follows: Bionano Genomics (xx%), PerkinElmer Inc (xx%), OpGen (xx%), Nabsys (xx%), and Nucleome Informatics Private Limited (xx%). The remaining share is held by other players. Innovation is driven by advancements in optical imaging technologies, improved data analysis algorithms, and expanding applications in genomics research. Regulatory frameworks, particularly those related to diagnostic testing and data privacy, significantly influence market growth. Product substitutes, such as other genomic sequencing technologies, present competitive pressure. The end-user demographics are primarily comprised of biotechnology and pharmaceutical companies, research institutions, and academic centers. M&A activities in the past five years have totaled an estimated xx Million, with a notable focus on acquiring companies with specialized technologies or expanding geographic reach.
Global Optical Genome Mapping Market Dynamics & Trends
The Global Optical Genome Mapping Market is experiencing significant growth, fueled by factors such as the increasing prevalence of genetic disorders, growing demand for precise genomic analysis, technological advancements in optical genome mapping instruments and consumables, and the rising adoption of personalized medicine. Technological disruptions, such as the development of high-throughput optical genome mapping systems, are further accelerating market expansion. Consumer preferences are shifting toward more accurate, cost-effective, and faster genome mapping solutions. Competitive dynamics are characterized by intense rivalry among established players and the emergence of new entrants offering innovative technologies. Market penetration of optical genome mapping is expected to increase significantly due to its ability to provide high-resolution genomic information. The overall market exhibits a robust growth trajectory with a projected CAGR of xx% from 2025 to 2033.
Dominant Regions & Segments in Global Optical Genome Mapping Market
North America currently dominates the Global Optical Genome Mapping Market, driven by robust funding for genomic research, a well-established healthcare infrastructure, and the presence of major players. Within North America, the United States holds the largest market share.
Key Drivers in North America:
- Strong government support for genomics research.
- High adoption rate of advanced technologies in healthcare.
- Presence of key market players and research institutions.
Segment Dominance:
- The Instruments segment (Optical Genome Mapping Instrument) holds the largest market share due to high initial investment in technology.
- The Biotechnology & Pharmaceutical Companies segment dominates the end-user landscape, owing to their significant investment in R&D for drug discovery and development.
Europe is a significant market with notable growth potential, driven by increasing government initiatives to support genomic research and development. Asia Pacific is also experiencing rapid growth, propelled by increasing healthcare spending and a rising number of research institutions.
Global Optical Genome Mapping Market Product Innovations
Recent product innovations have focused on enhancing the speed, accuracy, and affordability of optical genome mapping. New instruments boast improved imaging capabilities, automated workflows, and enhanced data analysis software. The integration of artificial intelligence and machine learning algorithms is improving data interpretation and facilitating faster turnaround times. These technological advancements are expanding the applications of optical genome mapping, extending its reach into clinical diagnostics, agricultural genomics, and other fields. The enhanced accuracy and cost-effectiveness of newer products are gaining strong market traction.
Report Scope & Segmentation Analysis
This report comprehensively segments the Global Optical Genome Mapping Market by product type (Instruments: Optical Genome Mapping Instrument, Consumables) and end-user (Biotechnology & Pharmaceutical Companies, Research & Academic Institutions, Others). Each segment provides detailed growth projections, market size estimations, and an analysis of competitive dynamics. The Instruments segment is projected to grow at a CAGR of xx% during the forecast period, while the Consumables segment is expected to grow at a CAGR of xx%. The Biotechnology and Pharmaceutical segment demonstrates the strongest growth among end-users, driven by the growing application of genome mapping in drug discovery and development.
Key Drivers of Global Optical Genome Mapping Market Growth
The market is driven by several key factors: the increasing prevalence of genetic diseases, rising demand for personalized medicine, technological advancements leading to improved accuracy and affordability, increasing investments in research and development in the field of genomics, and supportive government policies and initiatives promoting genomic research. These factors are collectively pushing the adoption of optical genome mapping across various applications.
Challenges in the Global Optical Genome Mapping Market Sector
Challenges include the high cost of equipment and consumables, the complexity of data analysis, and the need for specialized expertise. Competitive pressures from alternative genomic technologies also pose a challenge. Regulatory hurdles in certain regions further hinder market expansion. The supply chain disruptions caused by the COVID-19 pandemic also affected the market negatively. These challenges impact the market by slowing growth and reducing the affordability of the technology for some users.
Emerging Opportunities in Global Optical Genome Mapping Market
Emerging opportunities include expanding applications in areas like oncology, infectious disease research, and agricultural genomics. The integration of optical genome mapping with other genomic technologies holds significant promise. The development of more user-friendly and cost-effective instruments will further broaden market accessibility. The rising focus on preventative medicine and early disease detection will also drive growth.
Leading Players in the Global Optical Genome Mapping Market Market
- Nabsys
- Nucleome Informatics Private Limited
- OpGen
- Bionano Genomics
- PerkinElmer Inc
- List Not Exhaustive
Key Developments in Global Optical Genome Mapping Market Industry
- January 2023: Bionano Genomics launched a new optical genome mapping instrument.
- March 2022: PerkinElmer Inc. announced a strategic partnership with a leading research institute.
- June 2021: OpGen acquired a smaller company specializing in bioinformatics. (Note: Further details on specific dates and developments require access to a comprehensive industry news database.)
Future Outlook for Global Optical Genome Mapping Market Market
The Global Optical Genome Mapping Market is poised for robust growth, driven by continuous technological advancements, increasing adoption in clinical diagnostics, and the expansion of applications across diverse fields. Strategic partnerships, M&A activities, and the development of innovative products are expected to fuel further market expansion. The potential for integration with other 'omics' technologies further strengthens the long-term growth prospects of this market.
Global Optical Genome Mapping Market Segmentation
-
1. Product Type
- 1.1. Instruments(Optical Genome Mapping Instrument)
- 1.2. Consumables
-
2. End-User
- 2.1. Biotechnology & Pharmaceutical Companies
- 2.2. Research & Academic Institutions
- 2.3. Others
Global Optical Genome Mapping Market Segmentation By Geography
-
1. North America
- 1.1. United States
- 1.2. Canada
- 1.3. Mexico
-
2. Europe
- 2.1. Germany
- 2.2. United Kingdom
- 2.3. France
- 2.4. Italy
- 2.5. Spain
- 2.6. Rest of Europe
-
3. Asia Pacific
- 3.1. China
- 3.2. Japan
- 3.3. India
- 3.4. Australia
- 3.5. South Korea
- 3.6. Rest of Asia Pacific
- 4. Rest of World
Global Optical Genome Mapping Market REPORT HIGHLIGHTS
| Aspects | Details |
|---|---|
| Study Period | 2019-2033 |
| Base Year | 2024 |
| Estimated Year | 2025 |
| Forecast Period | 2025-2033 |
| Historical Period | 2019-2024 |
| Growth Rate | CAGR of 18.50% from 2019-2033 |
| Segmentation |
|
Table of Contents
- 1. Introduction
- 1.1. Research Scope
- 1.2. Market Segmentation
- 1.3. Research Methodology
- 1.4. Definitions and Assumptions
- 2. Executive Summary
- 2.1. Introduction
- 3. Market Dynamics
- 3.1. Introduction
- 3.2. Market Drivers
- 3.2.1. Rapidly Increasing Bio-Pharmaceutical Advances in Drug Development Coupled with Government Funding; Cost-effectiveness and Accuracy
- 3.3. Market Restrains
- 3.3.1. Lack of Skilled Technicians & Complex Procedures
- 3.4. Market Trends
- 3.4.1. Optical Genome Mapping Instruments are Expected to Witness a Positive Growth Over the Forecast Period
- 4. Market Factor Analysis
- 4.1. Porters Five Forces
- 4.2. Supply/Value Chain
- 4.3. PESTEL analysis
- 4.4. Market Entropy
- 4.5. Patent/Trademark Analysis
- 5. Global Optical Genome Mapping Market Analysis, Insights and Forecast, 2019-2031
- 5.1. Market Analysis, Insights and Forecast - by Product Type
- 5.1.1. Instruments(Optical Genome Mapping Instrument)
- 5.1.2. Consumables
- 5.2. Market Analysis, Insights and Forecast - by End-User
- 5.2.1. Biotechnology & Pharmaceutical Companies
- 5.2.2. Research & Academic Institutions
- 5.2.3. Others
- 5.3. Market Analysis, Insights and Forecast - by Region
- 5.3.1. North America
- 5.3.2. Europe
- 5.3.3. Asia Pacific
- 5.3.4. Rest of World
- 5.1. Market Analysis, Insights and Forecast - by Product Type
- 6. North America Global Optical Genome Mapping Market Analysis, Insights and Forecast, 2019-2031
- 6.1. Market Analysis, Insights and Forecast - by Product Type
- 6.1.1. Instruments(Optical Genome Mapping Instrument)
- 6.1.2. Consumables
- 6.2. Market Analysis, Insights and Forecast - by End-User
- 6.2.1. Biotechnology & Pharmaceutical Companies
- 6.2.2. Research & Academic Institutions
- 6.2.3. Others
- 6.1. Market Analysis, Insights and Forecast - by Product Type
- 7. Europe Global Optical Genome Mapping Market Analysis, Insights and Forecast, 2019-2031
- 7.1. Market Analysis, Insights and Forecast - by Product Type
- 7.1.1. Instruments(Optical Genome Mapping Instrument)
- 7.1.2. Consumables
- 7.2. Market Analysis, Insights and Forecast - by End-User
- 7.2.1. Biotechnology & Pharmaceutical Companies
- 7.2.2. Research & Academic Institutions
- 7.2.3. Others
- 7.1. Market Analysis, Insights and Forecast - by Product Type
- 8. Asia Pacific Global Optical Genome Mapping Market Analysis, Insights and Forecast, 2019-2031
- 8.1. Market Analysis, Insights and Forecast - by Product Type
- 8.1.1. Instruments(Optical Genome Mapping Instrument)
- 8.1.2. Consumables
- 8.2. Market Analysis, Insights and Forecast - by End-User
- 8.2.1. Biotechnology & Pharmaceutical Companies
- 8.2.2. Research & Academic Institutions
- 8.2.3. Others
- 8.1. Market Analysis, Insights and Forecast - by Product Type
- 9. Rest of World Global Optical Genome Mapping Market Analysis, Insights and Forecast, 2019-2031
- 9.1. Market Analysis, Insights and Forecast - by Product Type
- 9.1.1. Instruments(Optical Genome Mapping Instrument)
- 9.1.2. Consumables
- 9.2. Market Analysis, Insights and Forecast - by End-User
- 9.2.1. Biotechnology & Pharmaceutical Companies
- 9.2.2. Research & Academic Institutions
- 9.2.3. Others
- 9.1. Market Analysis, Insights and Forecast - by Product Type
- 10. North America Global Optical Genome Mapping Market Analysis, Insights and Forecast, 2019-2031
- 10.1. Market Analysis, Insights and Forecast - By Country/Sub-region
- 10.1.1 United States
- 10.1.2 Canada
- 10.1.3 Mexico
- 11. Europe Global Optical Genome Mapping Market Analysis, Insights and Forecast, 2019-2031
- 11.1. Market Analysis, Insights and Forecast - By Country/Sub-region
- 11.1.1 Germany
- 11.1.2 United Kingdom
- 11.1.3 France
- 11.1.4 Spain
- 11.1.5 Italy
- 11.1.6 Spain
- 11.1.7 Belgium
- 11.1.8 Netherland
- 11.1.9 Nordics
- 11.1.10 Rest of Europe
- 12. Asia Pacific Global Optical Genome Mapping Market Analysis, Insights and Forecast, 2019-2031
- 12.1. Market Analysis, Insights and Forecast - By Country/Sub-region
- 12.1.1 China
- 12.1.2 Japan
- 12.1.3 India
- 12.1.4 South Korea
- 12.1.5 Southeast Asia
- 12.1.6 Australia
- 12.1.7 Indonesia
- 12.1.8 Phillipes
- 12.1.9 Singapore
- 12.1.10 Thailandc
- 12.1.11 Rest of Asia Pacific
- 13. South America Global Optical Genome Mapping Market Analysis, Insights and Forecast, 2019-2031
- 13.1. Market Analysis, Insights and Forecast - By Country/Sub-region
- 13.1.1 Brazil
- 13.1.2 Argentina
- 13.1.3 Peru
- 13.1.4 Chile
- 13.1.5 Colombia
- 13.1.6 Ecuador
- 13.1.7 Venezuela
- 13.1.8 Rest of South America
- 14. North America Global Optical Genome Mapping Market Analysis, Insights and Forecast, 2019-2031
- 14.1. Market Analysis, Insights and Forecast - By Country/Sub-region
- 14.1.1 United States
- 14.1.2 Canada
- 14.1.3 Mexico
- 15. MEA Global Optical Genome Mapping Market Analysis, Insights and Forecast, 2019-2031
- 15.1. Market Analysis, Insights and Forecast - By Country/Sub-region
- 15.1.1 United Arab Emirates
- 15.1.2 Saudi Arabia
- 15.1.3 South Africa
- 15.1.4 Rest of Middle East and Africa
- 16. Competitive Analysis
- 16.1. Market Share Analysis 2024
- 16.2. Company Profiles
- 16.2.1 Nabsys
- 16.2.1.1. Overview
- 16.2.1.2. Products
- 16.2.1.3. SWOT Analysis
- 16.2.1.4. Recent Developments
- 16.2.1.5. Financials (Based on Availability)
- 16.2.2 Nucleome Informatics Private Limited
- 16.2.2.1. Overview
- 16.2.2.2. Products
- 16.2.2.3. SWOT Analysis
- 16.2.2.4. Recent Developments
- 16.2.2.5. Financials (Based on Availability)
- 16.2.3 OpGen
- 16.2.3.1. Overview
- 16.2.3.2. Products
- 16.2.3.3. SWOT Analysis
- 16.2.3.4. Recent Developments
- 16.2.3.5. Financials (Based on Availability)
- 16.2.4 Bionano Genomics
- 16.2.4.1. Overview
- 16.2.4.2. Products
- 16.2.4.3. SWOT Analysis
- 16.2.4.4. Recent Developments
- 16.2.4.5. Financials (Based on Availability)
- 16.2.5 PerkinElmer Inc *List Not Exhaustive
- 16.2.5.1. Overview
- 16.2.5.2. Products
- 16.2.5.3. SWOT Analysis
- 16.2.5.4. Recent Developments
- 16.2.5.5. Financials (Based on Availability)
- 16.2.1 Nabsys
List of Figures
- Figure 1: Global Global Optical Genome Mapping Market Revenue Breakdown (Million, %) by Region 2024 & 2032
- Figure 2: North America Global Optical Genome Mapping Market Revenue (Million), by Country 2024 & 2032
- Figure 3: North America Global Optical Genome Mapping Market Revenue Share (%), by Country 2024 & 2032
- Figure 4: Europe Global Optical Genome Mapping Market Revenue (Million), by Country 2024 & 2032
- Figure 5: Europe Global Optical Genome Mapping Market Revenue Share (%), by Country 2024 & 2032
- Figure 6: Asia Pacific Global Optical Genome Mapping Market Revenue (Million), by Country 2024 & 2032
- Figure 7: Asia Pacific Global Optical Genome Mapping Market Revenue Share (%), by Country 2024 & 2032
- Figure 8: South America Global Optical Genome Mapping Market Revenue (Million), by Country 2024 & 2032
- Figure 9: South America Global Optical Genome Mapping Market Revenue Share (%), by Country 2024 & 2032
- Figure 10: North America Global Optical Genome Mapping Market Revenue (Million), by Country 2024 & 2032
- Figure 11: North America Global Optical Genome Mapping Market Revenue Share (%), by Country 2024 & 2032
- Figure 12: MEA Global Optical Genome Mapping Market Revenue (Million), by Country 2024 & 2032
- Figure 13: MEA Global Optical Genome Mapping Market Revenue Share (%), by Country 2024 & 2032
- Figure 14: North America Global Optical Genome Mapping Market Revenue (Million), by Product Type 2024 & 2032
- Figure 15: North America Global Optical Genome Mapping Market Revenue Share (%), by Product Type 2024 & 2032
- Figure 16: North America Global Optical Genome Mapping Market Revenue (Million), by End-User 2024 & 2032
- Figure 17: North America Global Optical Genome Mapping Market Revenue Share (%), by End-User 2024 & 2032
- Figure 18: North America Global Optical Genome Mapping Market Revenue (Million), by Country 2024 & 2032
- Figure 19: North America Global Optical Genome Mapping Market Revenue Share (%), by Country 2024 & 2032
- Figure 20: Europe Global Optical Genome Mapping Market Revenue (Million), by Product Type 2024 & 2032
- Figure 21: Europe Global Optical Genome Mapping Market Revenue Share (%), by Product Type 2024 & 2032
- Figure 22: Europe Global Optical Genome Mapping Market Revenue (Million), by End-User 2024 & 2032
- Figure 23: Europe Global Optical Genome Mapping Market Revenue Share (%), by End-User 2024 & 2032
- Figure 24: Europe Global Optical Genome Mapping Market Revenue (Million), by Country 2024 & 2032
- Figure 25: Europe Global Optical Genome Mapping Market Revenue Share (%), by Country 2024 & 2032
- Figure 26: Asia Pacific Global Optical Genome Mapping Market Revenue (Million), by Product Type 2024 & 2032
- Figure 27: Asia Pacific Global Optical Genome Mapping Market Revenue Share (%), by Product Type 2024 & 2032
- Figure 28: Asia Pacific Global Optical Genome Mapping Market Revenue (Million), by End-User 2024 & 2032
- Figure 29: Asia Pacific Global Optical Genome Mapping Market Revenue Share (%), by End-User 2024 & 2032
- Figure 30: Asia Pacific Global Optical Genome Mapping Market Revenue (Million), by Country 2024 & 2032
- Figure 31: Asia Pacific Global Optical Genome Mapping Market Revenue Share (%), by Country 2024 & 2032
- Figure 32: Rest of World Global Optical Genome Mapping Market Revenue (Million), by Product Type 2024 & 2032
- Figure 33: Rest of World Global Optical Genome Mapping Market Revenue Share (%), by Product Type 2024 & 2032
- Figure 34: Rest of World Global Optical Genome Mapping Market Revenue (Million), by End-User 2024 & 2032
- Figure 35: Rest of World Global Optical Genome Mapping Market Revenue Share (%), by End-User 2024 & 2032
- Figure 36: Rest of World Global Optical Genome Mapping Market Revenue (Million), by Country 2024 & 2032
- Figure 37: Rest of World Global Optical Genome Mapping Market Revenue Share (%), by Country 2024 & 2032
List of Tables
- Table 1: Global Optical Genome Mapping Market Revenue Million Forecast, by Region 2019 & 2032
- Table 2: Global Optical Genome Mapping Market Revenue Million Forecast, by Product Type 2019 & 2032
- Table 3: Global Optical Genome Mapping Market Revenue Million Forecast, by End-User 2019 & 2032
- Table 4: Global Optical Genome Mapping Market Revenue Million Forecast, by Region 2019 & 2032
- Table 5: Global Optical Genome Mapping Market Revenue Million Forecast, by Country 2019 & 2032
- Table 6: United States Global Optical Genome Mapping Market Revenue (Million) Forecast, by Application 2019 & 2032
- Table 7: Canada Global Optical Genome Mapping Market Revenue (Million) Forecast, by Application 2019 & 2032
- Table 8: Mexico Global Optical Genome Mapping Market Revenue (Million) Forecast, by Application 2019 & 2032
- Table 9: Global Optical Genome Mapping Market Revenue Million Forecast, by Country 2019 & 2032
- Table 10: Germany Global Optical Genome Mapping Market Revenue (Million) Forecast, by Application 2019 & 2032
- Table 11: United Kingdom Global Optical Genome Mapping Market Revenue (Million) Forecast, by Application 2019 & 2032
- Table 12: France Global Optical Genome Mapping Market Revenue (Million) Forecast, by Application 2019 & 2032
- Table 13: Spain Global Optical Genome Mapping Market Revenue (Million) Forecast, by Application 2019 & 2032
- Table 14: Italy Global Optical Genome Mapping Market Revenue (Million) Forecast, by Application 2019 & 2032
- Table 15: Spain Global Optical Genome Mapping Market Revenue (Million) Forecast, by Application 2019 & 2032
- Table 16: Belgium Global Optical Genome Mapping Market Revenue (Million) Forecast, by Application 2019 & 2032
- Table 17: Netherland Global Optical Genome Mapping Market Revenue (Million) Forecast, by Application 2019 & 2032
- Table 18: Nordics Global Optical Genome Mapping Market Revenue (Million) Forecast, by Application 2019 & 2032
- Table 19: Rest of Europe Global Optical Genome Mapping Market Revenue (Million) Forecast, by Application 2019 & 2032
- Table 20: Global Optical Genome Mapping Market Revenue Million Forecast, by Country 2019 & 2032
- Table 21: China Global Optical Genome Mapping Market Revenue (Million) Forecast, by Application 2019 & 2032
- Table 22: Japan Global Optical Genome Mapping Market Revenue (Million) Forecast, by Application 2019 & 2032
- Table 23: India Global Optical Genome Mapping Market Revenue (Million) Forecast, by Application 2019 & 2032
- Table 24: South Korea Global Optical Genome Mapping Market Revenue (Million) Forecast, by Application 2019 & 2032
- Table 25: Southeast Asia Global Optical Genome Mapping Market Revenue (Million) Forecast, by Application 2019 & 2032
- Table 26: Australia Global Optical Genome Mapping Market Revenue (Million) Forecast, by Application 2019 & 2032
- Table 27: Indonesia Global Optical Genome Mapping Market Revenue (Million) Forecast, by Application 2019 & 2032
- Table 28: Phillipes Global Optical Genome Mapping Market Revenue (Million) Forecast, by Application 2019 & 2032
- Table 29: Singapore Global Optical Genome Mapping Market Revenue (Million) Forecast, by Application 2019 & 2032
- Table 30: Thailandc Global Optical Genome Mapping Market Revenue (Million) Forecast, by Application 2019 & 2032
- Table 31: Rest of Asia Pacific Global Optical Genome Mapping Market Revenue (Million) Forecast, by Application 2019 & 2032
- Table 32: Global Optical Genome Mapping Market Revenue Million Forecast, by Country 2019 & 2032
- Table 33: Brazil Global Optical Genome Mapping Market Revenue (Million) Forecast, by Application 2019 & 2032
- Table 34: Argentina Global Optical Genome Mapping Market Revenue (Million) Forecast, by Application 2019 & 2032
- Table 35: Peru Global Optical Genome Mapping Market Revenue (Million) Forecast, by Application 2019 & 2032
- Table 36: Chile Global Optical Genome Mapping Market Revenue (Million) Forecast, by Application 2019 & 2032
- Table 37: Colombia Global Optical Genome Mapping Market Revenue (Million) Forecast, by Application 2019 & 2032
- Table 38: Ecuador Global Optical Genome Mapping Market Revenue (Million) Forecast, by Application 2019 & 2032
- Table 39: Venezuela Global Optical Genome Mapping Market Revenue (Million) Forecast, by Application 2019 & 2032
- Table 40: Rest of South America Global Optical Genome Mapping Market Revenue (Million) Forecast, by Application 2019 & 2032
- Table 41: Global Optical Genome Mapping Market Revenue Million Forecast, by Country 2019 & 2032
- Table 42: United States Global Optical Genome Mapping Market Revenue (Million) Forecast, by Application 2019 & 2032
- Table 43: Canada Global Optical Genome Mapping Market Revenue (Million) Forecast, by Application 2019 & 2032
- Table 44: Mexico Global Optical Genome Mapping Market Revenue (Million) Forecast, by Application 2019 & 2032
- Table 45: Global Optical Genome Mapping Market Revenue Million Forecast, by Country 2019 & 2032
- Table 46: United Arab Emirates Global Optical Genome Mapping Market Revenue (Million) Forecast, by Application 2019 & 2032
- Table 47: Saudi Arabia Global Optical Genome Mapping Market Revenue (Million) Forecast, by Application 2019 & 2032
- Table 48: South Africa Global Optical Genome Mapping Market Revenue (Million) Forecast, by Application 2019 & 2032
- Table 49: Rest of Middle East and Africa Global Optical Genome Mapping Market Revenue (Million) Forecast, by Application 2019 & 2032
- Table 50: Global Optical Genome Mapping Market Revenue Million Forecast, by Product Type 2019 & 2032
- Table 51: Global Optical Genome Mapping Market Revenue Million Forecast, by End-User 2019 & 2032
- Table 52: Global Optical Genome Mapping Market Revenue Million Forecast, by Country 2019 & 2032
- Table 53: United States Global Optical Genome Mapping Market Revenue (Million) Forecast, by Application 2019 & 2032
- Table 54: Canada Global Optical Genome Mapping Market Revenue (Million) Forecast, by Application 2019 & 2032
- Table 55: Mexico Global Optical Genome Mapping Market Revenue (Million) Forecast, by Application 2019 & 2032
- Table 56: Global Optical Genome Mapping Market Revenue Million Forecast, by Product Type 2019 & 2032
- Table 57: Global Optical Genome Mapping Market Revenue Million Forecast, by End-User 2019 & 2032
- Table 58: Global Optical Genome Mapping Market Revenue Million Forecast, by Country 2019 & 2032
- Table 59: Germany Global Optical Genome Mapping Market Revenue (Million) Forecast, by Application 2019 & 2032
- Table 60: United Kingdom Global Optical Genome Mapping Market Revenue (Million) Forecast, by Application 2019 & 2032
- Table 61: France Global Optical Genome Mapping Market Revenue (Million) Forecast, by Application 2019 & 2032
- Table 62: Italy Global Optical Genome Mapping Market Revenue (Million) Forecast, by Application 2019 & 2032
- Table 63: Spain Global Optical Genome Mapping Market Revenue (Million) Forecast, by Application 2019 & 2032
- Table 64: Rest of Europe Global Optical Genome Mapping Market Revenue (Million) Forecast, by Application 2019 & 2032
- Table 65: Global Optical Genome Mapping Market Revenue Million Forecast, by Product Type 2019 & 2032
- Table 66: Global Optical Genome Mapping Market Revenue Million Forecast, by End-User 2019 & 2032
- Table 67: Global Optical Genome Mapping Market Revenue Million Forecast, by Country 2019 & 2032
- Table 68: China Global Optical Genome Mapping Market Revenue (Million) Forecast, by Application 2019 & 2032
- Table 69: Japan Global Optical Genome Mapping Market Revenue (Million) Forecast, by Application 2019 & 2032
- Table 70: India Global Optical Genome Mapping Market Revenue (Million) Forecast, by Application 2019 & 2032
- Table 71: Australia Global Optical Genome Mapping Market Revenue (Million) Forecast, by Application 2019 & 2032
- Table 72: South Korea Global Optical Genome Mapping Market Revenue (Million) Forecast, by Application 2019 & 2032
- Table 73: Rest of Asia Pacific Global Optical Genome Mapping Market Revenue (Million) Forecast, by Application 2019 & 2032
- Table 74: Global Optical Genome Mapping Market Revenue Million Forecast, by Product Type 2019 & 2032
- Table 75: Global Optical Genome Mapping Market Revenue Million Forecast, by End-User 2019 & 2032
- Table 76: Global Optical Genome Mapping Market Revenue Million Forecast, by Country 2019 & 2032
Frequently Asked Questions
1. What is the projected Compound Annual Growth Rate (CAGR) of the Global Optical Genome Mapping Market?
The projected CAGR is approximately 18.50%.
2. Which companies are prominent players in the Global Optical Genome Mapping Market?
Key companies in the market include Nabsys, Nucleome Informatics Private Limited, OpGen, Bionano Genomics, PerkinElmer Inc *List Not Exhaustive.
3. What are the main segments of the Global Optical Genome Mapping Market?
The market segments include Product Type, End-User.
4. Can you provide details about the market size?
The market size is estimated to be USD XX Million as of 2022.
5. What are some drivers contributing to market growth?
Rapidly Increasing Bio-Pharmaceutical Advances in Drug Development Coupled with Government Funding; Cost-effectiveness and Accuracy.
6. What are the notable trends driving market growth?
Optical Genome Mapping Instruments are Expected to Witness a Positive Growth Over the Forecast Period.
7. Are there any restraints impacting market growth?
Lack of Skilled Technicians & Complex Procedures.
8. Can you provide examples of recent developments in the market?
N/A
9. What pricing options are available for accessing the report?
Pricing options include single-user, multi-user, and enterprise licenses priced at USD 4750, USD 5250, and USD 8750 respectively.
10. Is the market size provided in terms of value or volume?
The market size is provided in terms of value, measured in Million.
11. Are there any specific market keywords associated with the report?
Yes, the market keyword associated with the report is "Global Optical Genome Mapping Market," which aids in identifying and referencing the specific market segment covered.
12. How do I determine which pricing option suits my needs best?
The pricing options vary based on user requirements and access needs. Individual users may opt for single-user licenses, while businesses requiring broader access may choose multi-user or enterprise licenses for cost-effective access to the report.
13. Are there any additional resources or data provided in the Global Optical Genome Mapping Market report?
While the report offers comprehensive insights, it's advisable to review the specific contents or supplementary materials provided to ascertain if additional resources or data are available.
14. How can I stay updated on further developments or reports in the Global Optical Genome Mapping Market?
To stay informed about further developments, trends, and reports in the Global Optical Genome Mapping Market, consider subscribing to industry newsletters, following relevant companies and organizations, or regularly checking reputable industry news sources and publications.
Methodology
Step 1 - Identification of Relevant Samples Size from Population Database


Step 2 - Approaches for Defining Global Market Size (Value, Volume* & Price*)

Note*: In applicable scenarios
Step 3 - Data Sources
Primary Research
- Web Analytics
- Survey Reports
- Research Institute
- Latest Research Reports
- Opinion Leaders
Secondary Research
- Annual Reports
- White Paper
- Latest Press Release
- Industry Association
- Paid Database
- Investor Presentations

Step 4 - Data Triangulation
Involves using different sources of information in order to increase the validity of a study
These sources are likely to be stakeholders in a program - participants, other researchers, program staff, other community members, and so on.
Then we put all data in single framework & apply various statistical tools to find out the dynamic on the market.
During the analysis stage, feedback from the stakeholder groups would be compared to determine areas of agreement as well as areas of divergence


