
Key Insights
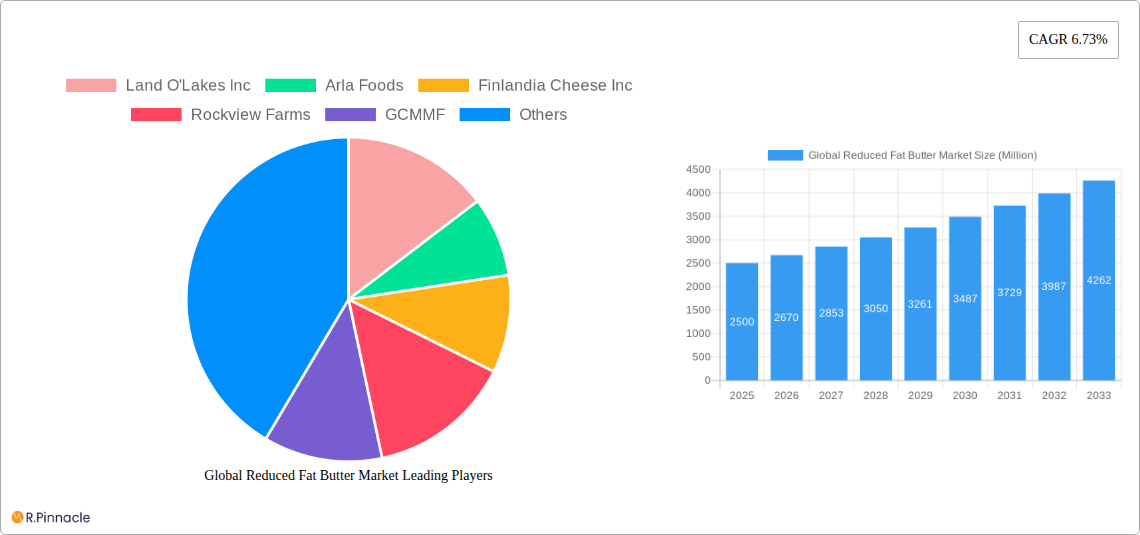
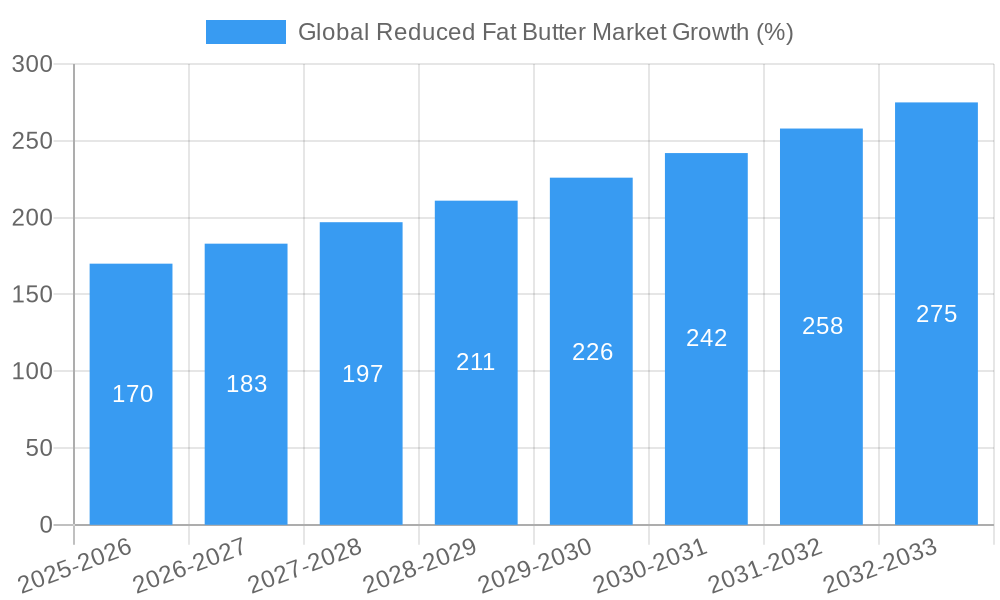
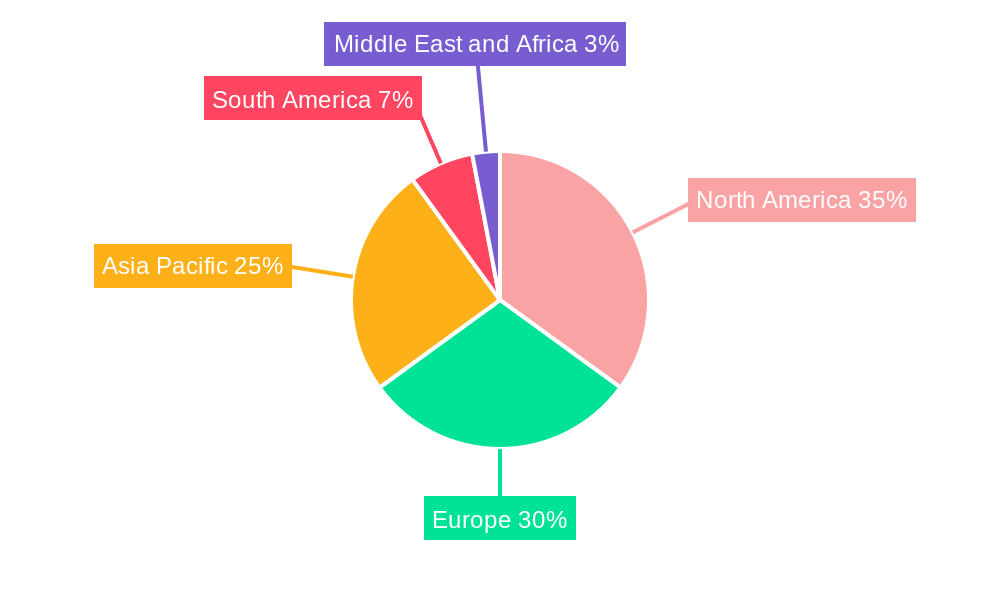
The global reduced-fat butter market, valued at approximately $2.5 billion in 2025, is projected to experience robust growth, driven by increasing health consciousness among consumers and the rising prevalence of diet-related diseases. A compound annual growth rate (CAGR) of 6.73% from 2025 to 2033 indicates a significant expansion of this market, reaching an estimated value of over $4.5 billion by 2033. Key market drivers include the growing demand for healthier alternatives to full-fat butter, increasing consumer awareness of the benefits of reduced-fat dairy products, and the rise in popularity of low-fat and low-calorie diets. Market trends point towards innovation in product formulations, with manufacturers focusing on enhancing taste and texture while maintaining reduced-fat content. The spreadable segment is expected to dominate due to its convenience and versatility in culinary applications. Supermarkets and hypermarkets remain the primary distribution channels, although online retailers are witnessing significant growth, capitalizing on the rising e-commerce penetration. Geographical distribution sees North America and Europe maintaining considerable market shares, but Asia-Pacific is anticipated to show the fastest growth due to increasing disposable incomes and changing dietary habits. Despite these positive trends, challenges remain, including fluctuations in dairy prices and competition from alternative fat spreads. Major players like Land O'Lakes, Arla Foods, and Unilever are strategically investing in research and development to enhance their product portfolios and cater to evolving consumer preferences.
The market segmentation reveals further nuances. The salted and unsalted categories each occupy a significant portion of the market, reflecting consumer preferences. Within distribution channels, the online retail segment’s growth is fueled by factors like home delivery services, ease of purchasing, and the rise of online grocery shopping. Regional variations in consumption patterns and regulatory landscapes will influence the market's trajectory. While North America and Europe currently hold dominant market shares, Asia-Pacific's developing economies and growing middle class present substantial opportunities for future expansion. The competitive landscape is marked by both established multinational corporations and regional players, leading to a dynamic market characterized by continuous innovation and strategic expansion.
Global Reduced Fat Butter Market: A Comprehensive Report (2019-2033)
This comprehensive report provides a detailed analysis of the global reduced fat butter market, offering invaluable insights for industry professionals, investors, and stakeholders. Covering the period from 2019 to 2033, with 2025 as the base year, this study meticulously examines market structure, dynamics, regional performance, and future outlook. The report leverages extensive market research to deliver actionable data and forecasts, empowering informed decision-making.
Global Reduced Fat Butter Market Market Structure & Innovation Trends
This section analyzes the competitive landscape of the global reduced fat butter market, encompassing market concentration, innovation drivers, regulatory frameworks, product substitutes, end-user demographics, and mergers & acquisitions (M&A) activities.
The market exhibits a moderately concentrated structure, with key players holding significant market shares. For example, Land O'Lakes Inc. and Arla Foods collectively account for an estimated xx% of the global market share in 2025. Innovation in the sector is driven by consumer demand for healthier alternatives and technological advancements in fat reduction techniques. Regulatory frameworks, particularly concerning labeling and health claims, significantly impact market dynamics. The primary substitute for reduced-fat butter is margarine and other plant-based spreads. The end-user demographic is primarily composed of health-conscious consumers and those seeking lower-fat dietary options. M&A activity in the sector has been moderate, with deal values averaging approximately xx Million in recent years. Notable acquisitions include [insert example of a recent M&A deal if available, otherwise omit this sentence].
Global Reduced Fat Butter Market Market Dynamics & Trends
This section delves into the key drivers and trends shaping the reduced fat butter market's growth trajectory. The market is projected to experience a Compound Annual Growth Rate (CAGR) of xx% during the forecast period (2025-2033). This growth is primarily fueled by the increasing prevalence of health-conscious consumers seeking lower-fat alternatives to traditional butter. Technological advancements in fat reduction and processing techniques are further contributing to market expansion. Shifting consumer preferences towards healthier eating habits and the rising demand for convenient and readily available food products are also major drivers. Competitive dynamics are characterized by intense rivalry among established players and emerging entrants, leading to product innovation and price competition. Market penetration of reduced-fat butter remains high in developed countries but is witnessing significant growth in emerging markets due to increased disposable incomes and changing lifestyles.
Dominant Regions & Segments in Global Reduced Fat Butter Market
This section identifies the leading regions and segments within the global reduced fat butter market.
Dominant Region: [Insert dominant region, e.g., North America] currently holds the largest market share, driven by factors such as high consumer awareness of health benefits, strong established distribution channels, and a high per capita consumption rate.
Dominant Segments:
- By Form: The spreadable segment dominates the market due to its convenient application and versatility in various culinary applications.
- By Distribution Channel: Supermarkets/Hypermarkets constitute the largest distribution channel, benefiting from strong brand presence and broad consumer reach.
- By Type: The salted segment holds a larger market share than the unsalted segment, owing to traditional preference and taste profiles in many regions.
Key Drivers by Region (Examples):
- North America: Strong regulatory support for health-conscious products, established retail infrastructure.
- Europe: High consumer awareness of health and wellness, preference for natural and organic products.
- Asia-Pacific: Rising disposable incomes, increasing urbanization, and changing dietary habits.
Global Reduced Fat Butter Market Product Innovations
Recent product developments focus on enhanced taste profiles, improved texture, and extended shelf life. Manufacturers are exploring innovative techniques to minimize fat content without compromising on flavor and quality. Technological trends like high-pressure processing and micro-encapsulation are being adopted to improve product consistency and stability. These innovations cater to consumer demand for healthier, yet palatable, food options, creating a competitive advantage for companies successfully integrating these advancements.
Report Scope & Segmentation Analysis
This report segments the global reduced fat butter market based on form (spreadable, non-spreadable), distribution channel (supermarkets/hypermarkets, convenience stores, online retailers, other distribution channels), and type (salted, unsalted). Each segment's market size, growth projections, and competitive dynamics are meticulously analyzed. For instance, the spreadable segment is expected to grow at a CAGR of xx% during the forecast period, while online retailers are projected to experience significant growth due to increasing e-commerce penetration. The competitive intensity varies across segments, with some being highly fragmented and others dominated by a few major players.
Key Drivers of Global Reduced Fat Butter Market Growth
The growth of the global reduced-fat butter market is primarily driven by the increasing health consciousness of consumers, leading to greater demand for lower-fat dairy products. Technological advancements in fat reduction methods have also contributed significantly. Favorable government regulations promoting healthier food options further support market expansion. Lastly, the rising disposable incomes in developing economies are fueling demand for premium and convenient food products.
Challenges in the Global Reduced Fat Butter Market Sector
The reduced-fat butter market faces challenges including the fluctuating prices of raw materials, supply chain disruptions, and intense competition among existing and new players. Stringent regulatory requirements concerning food labeling and health claims also add complexity. These factors can significantly impact profitability and market growth. Moreover, maintaining consistent quality and flavor while reducing fat content remains a technological challenge for some manufacturers.
Emerging Opportunities in Global Reduced Fat Butter Market
Emerging opportunities lie in the exploration of novel fat reduction technologies, expansion into untapped markets, and the development of value-added products with functional benefits. Increased consumer demand for sustainable and ethically sourced ingredients presents further opportunities for growth. Furthermore, customized product offerings catering to specific dietary needs and preferences will create new market segments.
Leading Players in the Global Reduced Fat Butter Market Market
- Land O'Lakes Inc
- Arla Foods
- Finlandia Cheese Inc
- Rockview Farms
- GCMMF
- Ornua Co-operative Limited
- Raisio Group plc
- Unilever (Upfield)
- SAVENCIA SA
- Saputo Inc
Key Developments in Global Reduced Fat Butter Market Industry
- [Month, Year]: [Company Name] launches a new line of reduced-fat butter with improved taste and texture.
- [Month, Year]: [Company Name] acquires [Company Name], expanding its market share and product portfolio.
- [Month, Year]: New regulations regarding fat content in dairy products are implemented in [Region/Country].
- [Add more bullet points as needed]
Future Outlook for Global Reduced Fat Butter Market Market
The future of the global reduced-fat butter market looks promising, driven by sustained demand for healthier food alternatives and continuous technological advancements. Strategic partnerships, product diversification, and expansion into emerging markets will be crucial for companies seeking to capitalize on the market’s growth potential. Innovation in taste and texture will be key differentiators in the increasingly competitive market landscape. The market is poised for continued expansion, with specific growth opportunities available to companies that adapt to evolving consumer preferences and regulatory changes.
Global Reduced Fat Butter Market Segmentation
-
1. Type
- 1.1. Salted
- 1.2. Unsalted
-
2. Form
- 2.1. Spreadable
- 2.2. Non-spreadable
-
3. Distribution Channel
- 3.1. Supermarkets/Hypermarkets
- 3.2. Convenience Stores
- 3.3. Online Retailers
- 3.4. Other Distribution Channels
Global Reduced Fat Butter Market Segmentation By Geography
-
1. North America
- 1.1. United States
- 1.2. Canada
- 1.3. Mexico
- 1.4. Rest of North America
-
2. Europe
- 2.1. Spain
- 2.2. United Kingdom
- 2.3. Germany
- 2.4. France
- 2.5. Italy
- 2.6. Russia
- 2.7. Rest of Europe
-
3. Asia Pacific
- 3.1. China
- 3.2. Japan
- 3.3. India
- 3.4. Australia
- 3.5. Rest of Asia Pacific
-
4. South America
- 4.1. Brazil
- 4.2. Argentina
- 4.3. Rest of South America
-
5. Middle East and Africa
- 5.1. South Africa
- 5.2. Saudi Arabia
- 5.3. Rest of Middle East and Africa
Global Reduced Fat Butter Market REPORT HIGHLIGHTS
| Aspects | Details |
|---|---|
| Study Period | 2019-2033 |
| Base Year | 2024 |
| Estimated Year | 2025 |
| Forecast Period | 2025-2033 |
| Historical Period | 2019-2024 |
| Growth Rate | CAGR of 6.73% from 2019-2033 |
| Segmentation |
|
Table of Contents
- 1. Introduction
- 1.1. Research Scope
- 1.2. Market Segmentation
- 1.3. Research Methodology
- 1.4. Definitions and Assumptions
- 2. Executive Summary
- 2.1. Introduction
- 3. Market Dynamics
- 3.1. Introduction
- 3.2. Market Drivers
- 3.2.1. Increasing application of Gelatin in healthcare and pharmaceutical sector
- 3.3. Market Restrains
- 3.3.1. Rising demand for clean label products
- 3.4. Market Trends
- 3.4.1. Surge in Demand for Low Fat and Low Calorie Food Products
- 4. Market Factor Analysis
- 4.1. Porters Five Forces
- 4.2. Supply/Value Chain
- 4.3. PESTEL analysis
- 4.4. Market Entropy
- 4.5. Patent/Trademark Analysis
- 5. Global Reduced Fat Butter Market Analysis, Insights and Forecast, 2019-2031
- 5.1. Market Analysis, Insights and Forecast - by Type
- 5.1.1. Salted
- 5.1.2. Unsalted
- 5.2. Market Analysis, Insights and Forecast - by Form
- 5.2.1. Spreadable
- 5.2.2. Non-spreadable
- 5.3. Market Analysis, Insights and Forecast - by Distribution Channel
- 5.3.1. Supermarkets/Hypermarkets
- 5.3.2. Convenience Stores
- 5.3.3. Online Retailers
- 5.3.4. Other Distribution Channels
- 5.4. Market Analysis, Insights and Forecast - by Region
- 5.4.1. North America
- 5.4.2. Europe
- 5.4.3. Asia Pacific
- 5.4.4. South America
- 5.4.5. Middle East and Africa
- 5.1. Market Analysis, Insights and Forecast - by Type
- 6. North America Global Reduced Fat Butter Market Analysis, Insights and Forecast, 2019-2031
- 6.1. Market Analysis, Insights and Forecast - by Type
- 6.1.1. Salted
- 6.1.2. Unsalted
- 6.2. Market Analysis, Insights and Forecast - by Form
- 6.2.1. Spreadable
- 6.2.2. Non-spreadable
- 6.3. Market Analysis, Insights and Forecast - by Distribution Channel
- 6.3.1. Supermarkets/Hypermarkets
- 6.3.2. Convenience Stores
- 6.3.3. Online Retailers
- 6.3.4. Other Distribution Channels
- 6.1. Market Analysis, Insights and Forecast - by Type
- 7. Europe Global Reduced Fat Butter Market Analysis, Insights and Forecast, 2019-2031
- 7.1. Market Analysis, Insights and Forecast - by Type
- 7.1.1. Salted
- 7.1.2. Unsalted
- 7.2. Market Analysis, Insights and Forecast - by Form
- 7.2.1. Spreadable
- 7.2.2. Non-spreadable
- 7.3. Market Analysis, Insights and Forecast - by Distribution Channel
- 7.3.1. Supermarkets/Hypermarkets
- 7.3.2. Convenience Stores
- 7.3.3. Online Retailers
- 7.3.4. Other Distribution Channels
- 7.1. Market Analysis, Insights and Forecast - by Type
- 8. Asia Pacific Global Reduced Fat Butter Market Analysis, Insights and Forecast, 2019-2031
- 8.1. Market Analysis, Insights and Forecast - by Type
- 8.1.1. Salted
- 8.1.2. Unsalted
- 8.2. Market Analysis, Insights and Forecast - by Form
- 8.2.1. Spreadable
- 8.2.2. Non-spreadable
- 8.3. Market Analysis, Insights and Forecast - by Distribution Channel
- 8.3.1. Supermarkets/Hypermarkets
- 8.3.2. Convenience Stores
- 8.3.3. Online Retailers
- 8.3.4. Other Distribution Channels
- 8.1. Market Analysis, Insights and Forecast - by Type
- 9. South America Global Reduced Fat Butter Market Analysis, Insights and Forecast, 2019-2031
- 9.1. Market Analysis, Insights and Forecast - by Type
- 9.1.1. Salted
- 9.1.2. Unsalted
- 9.2. Market Analysis, Insights and Forecast - by Form
- 9.2.1. Spreadable
- 9.2.2. Non-spreadable
- 9.3. Market Analysis, Insights and Forecast - by Distribution Channel
- 9.3.1. Supermarkets/Hypermarkets
- 9.3.2. Convenience Stores
- 9.3.3. Online Retailers
- 9.3.4. Other Distribution Channels
- 9.1. Market Analysis, Insights and Forecast - by Type
- 10. Middle East and Africa Global Reduced Fat Butter Market Analysis, Insights and Forecast, 2019-2031
- 10.1. Market Analysis, Insights and Forecast - by Type
- 10.1.1. Salted
- 10.1.2. Unsalted
- 10.2. Market Analysis, Insights and Forecast - by Form
- 10.2.1. Spreadable
- 10.2.2. Non-spreadable
- 10.3. Market Analysis, Insights and Forecast - by Distribution Channel
- 10.3.1. Supermarkets/Hypermarkets
- 10.3.2. Convenience Stores
- 10.3.3. Online Retailers
- 10.3.4. Other Distribution Channels
- 10.1. Market Analysis, Insights and Forecast - by Type
- 11. North America Global Reduced Fat Butter Market Analysis, Insights and Forecast, 2019-2031
- 11.1. Market Analysis, Insights and Forecast - By Country/Sub-region
- 11.1.1 United States
- 11.1.2 Canada
- 11.1.3 Mexico
- 11.1.4 Rest of North America
- 12. Europe Global Reduced Fat Butter Market Analysis, Insights and Forecast, 2019-2031
- 12.1. Market Analysis, Insights and Forecast - By Country/Sub-region
- 12.1.1 Spain
- 12.1.2 United Kingdom
- 12.1.3 Germany
- 12.1.4 France
- 12.1.5 Italy
- 12.1.6 Russia
- 12.1.7 Rest of Europe
- 13. Asia Pacific Global Reduced Fat Butter Market Analysis, Insights and Forecast, 2019-2031
- 13.1. Market Analysis, Insights and Forecast - By Country/Sub-region
- 13.1.1 China
- 13.1.2 Japan
- 13.1.3 India
- 13.1.4 Australia
- 13.1.5 Rest of Asia Pacific
- 14. South America Global Reduced Fat Butter Market Analysis, Insights and Forecast, 2019-2031
- 14.1. Market Analysis, Insights and Forecast - By Country/Sub-region
- 14.1.1 Brazil
- 14.1.2 Argentina
- 14.1.3 Rest of South America
- 15. Middle East and Africa Global Reduced Fat Butter Market Analysis, Insights and Forecast, 2019-2031
- 15.1. Market Analysis, Insights and Forecast - By Country/Sub-region
- 15.1.1 South Africa
- 15.1.2 Saudi Arabia
- 15.1.3 Rest of Middle East and Africa
- 16. Competitive Analysis
- 16.1. Market Share Analysis 2024
- 16.2. Company Profiles
- 16.2.1 Land O'Lakes Inc
- 16.2.1.1. Overview
- 16.2.1.2. Products
- 16.2.1.3. SWOT Analysis
- 16.2.1.4. Recent Developments
- 16.2.1.5. Financials (Based on Availability)
- 16.2.2 Arla Foods
- 16.2.2.1. Overview
- 16.2.2.2. Products
- 16.2.2.3. SWOT Analysis
- 16.2.2.4. Recent Developments
- 16.2.2.5. Financials (Based on Availability)
- 16.2.3 Finlandia Cheese Inc
- 16.2.3.1. Overview
- 16.2.3.2. Products
- 16.2.3.3. SWOT Analysis
- 16.2.3.4. Recent Developments
- 16.2.3.5. Financials (Based on Availability)
- 16.2.4 Rockview Farms
- 16.2.4.1. Overview
- 16.2.4.2. Products
- 16.2.4.3. SWOT Analysis
- 16.2.4.4. Recent Developments
- 16.2.4.5. Financials (Based on Availability)
- 16.2.5 GCMMF
- 16.2.5.1. Overview
- 16.2.5.2. Products
- 16.2.5.3. SWOT Analysis
- 16.2.5.4. Recent Developments
- 16.2.5.5. Financials (Based on Availability)
- 16.2.6 Ornua Co-operative Limited
- 16.2.6.1. Overview
- 16.2.6.2. Products
- 16.2.6.3. SWOT Analysis
- 16.2.6.4. Recent Developments
- 16.2.6.5. Financials (Based on Availability)
- 16.2.7 Raisio Group plc*List Not Exhaustive
- 16.2.7.1. Overview
- 16.2.7.2. Products
- 16.2.7.3. SWOT Analysis
- 16.2.7.4. Recent Developments
- 16.2.7.5. Financials (Based on Availability)
- 16.2.8 Unilever (Upfield)
- 16.2.8.1. Overview
- 16.2.8.2. Products
- 16.2.8.3. SWOT Analysis
- 16.2.8.4. Recent Developments
- 16.2.8.5. Financials (Based on Availability)
- 16.2.9 SAVENCIA SA
- 16.2.9.1. Overview
- 16.2.9.2. Products
- 16.2.9.3. SWOT Analysis
- 16.2.9.4. Recent Developments
- 16.2.9.5. Financials (Based on Availability)
- 16.2.10 Saputo Inc
- 16.2.10.1. Overview
- 16.2.10.2. Products
- 16.2.10.3. SWOT Analysis
- 16.2.10.4. Recent Developments
- 16.2.10.5. Financials (Based on Availability)
- 16.2.1 Land O'Lakes Inc
List of Figures
- Figure 1: Global Global Reduced Fat Butter Market Revenue Breakdown (Million, %) by Region 2024 & 2032
- Figure 2: Global Global Reduced Fat Butter Market Volume Breakdown (K Units, %) by Region 2024 & 2032
- Figure 3: North America Global Reduced Fat Butter Market Revenue (Million), by Country 2024 & 2032
- Figure 4: North America Global Reduced Fat Butter Market Volume (K Units), by Country 2024 & 2032
- Figure 5: North America Global Reduced Fat Butter Market Revenue Share (%), by Country 2024 & 2032
- Figure 6: North America Global Reduced Fat Butter Market Volume Share (%), by Country 2024 & 2032
- Figure 7: Europe Global Reduced Fat Butter Market Revenue (Million), by Country 2024 & 2032
- Figure 8: Europe Global Reduced Fat Butter Market Volume (K Units), by Country 2024 & 2032
- Figure 9: Europe Global Reduced Fat Butter Market Revenue Share (%), by Country 2024 & 2032
- Figure 10: Europe Global Reduced Fat Butter Market Volume Share (%), by Country 2024 & 2032
- Figure 11: Asia Pacific Global Reduced Fat Butter Market Revenue (Million), by Country 2024 & 2032
- Figure 12: Asia Pacific Global Reduced Fat Butter Market Volume (K Units), by Country 2024 & 2032
- Figure 13: Asia Pacific Global Reduced Fat Butter Market Revenue Share (%), by Country 2024 & 2032
- Figure 14: Asia Pacific Global Reduced Fat Butter Market Volume Share (%), by Country 2024 & 2032
- Figure 15: South America Global Reduced Fat Butter Market Revenue (Million), by Country 2024 & 2032
- Figure 16: South America Global Reduced Fat Butter Market Volume (K Units), by Country 2024 & 2032
- Figure 17: South America Global Reduced Fat Butter Market Revenue Share (%), by Country 2024 & 2032
- Figure 18: South America Global Reduced Fat Butter Market Volume Share (%), by Country 2024 & 2032
- Figure 19: Middle East and Africa Global Reduced Fat Butter Market Revenue (Million), by Country 2024 & 2032
- Figure 20: Middle East and Africa Global Reduced Fat Butter Market Volume (K Units), by Country 2024 & 2032
- Figure 21: Middle East and Africa Global Reduced Fat Butter Market Revenue Share (%), by Country 2024 & 2032
- Figure 22: Middle East and Africa Global Reduced Fat Butter Market Volume Share (%), by Country 2024 & 2032
- Figure 23: North America Global Reduced Fat Butter Market Revenue (Million), by Type 2024 & 2032
- Figure 24: North America Global Reduced Fat Butter Market Volume (K Units), by Type 2024 & 2032
- Figure 25: North America Global Reduced Fat Butter Market Revenue Share (%), by Type 2024 & 2032
- Figure 26: North America Global Reduced Fat Butter Market Volume Share (%), by Type 2024 & 2032
- Figure 27: North America Global Reduced Fat Butter Market Revenue (Million), by Form 2024 & 2032
- Figure 28: North America Global Reduced Fat Butter Market Volume (K Units), by Form 2024 & 2032
- Figure 29: North America Global Reduced Fat Butter Market Revenue Share (%), by Form 2024 & 2032
- Figure 30: North America Global Reduced Fat Butter Market Volume Share (%), by Form 2024 & 2032
- Figure 31: North America Global Reduced Fat Butter Market Revenue (Million), by Distribution Channel 2024 & 2032
- Figure 32: North America Global Reduced Fat Butter Market Volume (K Units), by Distribution Channel 2024 & 2032
- Figure 33: North America Global Reduced Fat Butter Market Revenue Share (%), by Distribution Channel 2024 & 2032
- Figure 34: North America Global Reduced Fat Butter Market Volume Share (%), by Distribution Channel 2024 & 2032
- Figure 35: North America Global Reduced Fat Butter Market Revenue (Million), by Country 2024 & 2032
- Figure 36: North America Global Reduced Fat Butter Market Volume (K Units), by Country 2024 & 2032
- Figure 37: North America Global Reduced Fat Butter Market Revenue Share (%), by Country 2024 & 2032
- Figure 38: North America Global Reduced Fat Butter Market Volume Share (%), by Country 2024 & 2032
- Figure 39: Europe Global Reduced Fat Butter Market Revenue (Million), by Type 2024 & 2032
- Figure 40: Europe Global Reduced Fat Butter Market Volume (K Units), by Type 2024 & 2032
- Figure 41: Europe Global Reduced Fat Butter Market Revenue Share (%), by Type 2024 & 2032
- Figure 42: Europe Global Reduced Fat Butter Market Volume Share (%), by Type 2024 & 2032
- Figure 43: Europe Global Reduced Fat Butter Market Revenue (Million), by Form 2024 & 2032
- Figure 44: Europe Global Reduced Fat Butter Market Volume (K Units), by Form 2024 & 2032
- Figure 45: Europe Global Reduced Fat Butter Market Revenue Share (%), by Form 2024 & 2032
- Figure 46: Europe Global Reduced Fat Butter Market Volume Share (%), by Form 2024 & 2032
- Figure 47: Europe Global Reduced Fat Butter Market Revenue (Million), by Distribution Channel 2024 & 2032
- Figure 48: Europe Global Reduced Fat Butter Market Volume (K Units), by Distribution Channel 2024 & 2032
- Figure 49: Europe Global Reduced Fat Butter Market Revenue Share (%), by Distribution Channel 2024 & 2032
- Figure 50: Europe Global Reduced Fat Butter Market Volume Share (%), by Distribution Channel 2024 & 2032
- Figure 51: Europe Global Reduced Fat Butter Market Revenue (Million), by Country 2024 & 2032
- Figure 52: Europe Global Reduced Fat Butter Market Volume (K Units), by Country 2024 & 2032
- Figure 53: Europe Global Reduced Fat Butter Market Revenue Share (%), by Country 2024 & 2032
- Figure 54: Europe Global Reduced Fat Butter Market Volume Share (%), by Country 2024 & 2032
- Figure 55: Asia Pacific Global Reduced Fat Butter Market Revenue (Million), by Type 2024 & 2032
- Figure 56: Asia Pacific Global Reduced Fat Butter Market Volume (K Units), by Type 2024 & 2032
- Figure 57: Asia Pacific Global Reduced Fat Butter Market Revenue Share (%), by Type 2024 & 2032
- Figure 58: Asia Pacific Global Reduced Fat Butter Market Volume Share (%), by Type 2024 & 2032
- Figure 59: Asia Pacific Global Reduced Fat Butter Market Revenue (Million), by Form 2024 & 2032
- Figure 60: Asia Pacific Global Reduced Fat Butter Market Volume (K Units), by Form 2024 & 2032
- Figure 61: Asia Pacific Global Reduced Fat Butter Market Revenue Share (%), by Form 2024 & 2032
- Figure 62: Asia Pacific Global Reduced Fat Butter Market Volume Share (%), by Form 2024 & 2032
- Figure 63: Asia Pacific Global Reduced Fat Butter Market Revenue (Million), by Distribution Channel 2024 & 2032
- Figure 64: Asia Pacific Global Reduced Fat Butter Market Volume (K Units), by Distribution Channel 2024 & 2032
- Figure 65: Asia Pacific Global Reduced Fat Butter Market Revenue Share (%), by Distribution Channel 2024 & 2032
- Figure 66: Asia Pacific Global Reduced Fat Butter Market Volume Share (%), by Distribution Channel 2024 & 2032
- Figure 67: Asia Pacific Global Reduced Fat Butter Market Revenue (Million), by Country 2024 & 2032
- Figure 68: Asia Pacific Global Reduced Fat Butter Market Volume (K Units), by Country 2024 & 2032
- Figure 69: Asia Pacific Global Reduced Fat Butter Market Revenue Share (%), by Country 2024 & 2032
- Figure 70: Asia Pacific Global Reduced Fat Butter Market Volume Share (%), by Country 2024 & 2032
- Figure 71: South America Global Reduced Fat Butter Market Revenue (Million), by Type 2024 & 2032
- Figure 72: South America Global Reduced Fat Butter Market Volume (K Units), by Type 2024 & 2032
- Figure 73: South America Global Reduced Fat Butter Market Revenue Share (%), by Type 2024 & 2032
- Figure 74: South America Global Reduced Fat Butter Market Volume Share (%), by Type 2024 & 2032
- Figure 75: South America Global Reduced Fat Butter Market Revenue (Million), by Form 2024 & 2032
- Figure 76: South America Global Reduced Fat Butter Market Volume (K Units), by Form 2024 & 2032
- Figure 77: South America Global Reduced Fat Butter Market Revenue Share (%), by Form 2024 & 2032
- Figure 78: South America Global Reduced Fat Butter Market Volume Share (%), by Form 2024 & 2032
- Figure 79: South America Global Reduced Fat Butter Market Revenue (Million), by Distribution Channel 2024 & 2032
- Figure 80: South America Global Reduced Fat Butter Market Volume (K Units), by Distribution Channel 2024 & 2032
- Figure 81: South America Global Reduced Fat Butter Market Revenue Share (%), by Distribution Channel 2024 & 2032
- Figure 82: South America Global Reduced Fat Butter Market Volume Share (%), by Distribution Channel 2024 & 2032
- Figure 83: South America Global Reduced Fat Butter Market Revenue (Million), by Country 2024 & 2032
- Figure 84: South America Global Reduced Fat Butter Market Volume (K Units), by Country 2024 & 2032
- Figure 85: South America Global Reduced Fat Butter Market Revenue Share (%), by Country 2024 & 2032
- Figure 86: South America Global Reduced Fat Butter Market Volume Share (%), by Country 2024 & 2032
- Figure 87: Middle East and Africa Global Reduced Fat Butter Market Revenue (Million), by Type 2024 & 2032
- Figure 88: Middle East and Africa Global Reduced Fat Butter Market Volume (K Units), by Type 2024 & 2032
- Figure 89: Middle East and Africa Global Reduced Fat Butter Market Revenue Share (%), by Type 2024 & 2032
- Figure 90: Middle East and Africa Global Reduced Fat Butter Market Volume Share (%), by Type 2024 & 2032
- Figure 91: Middle East and Africa Global Reduced Fat Butter Market Revenue (Million), by Form 2024 & 2032
- Figure 92: Middle East and Africa Global Reduced Fat Butter Market Volume (K Units), by Form 2024 & 2032
- Figure 93: Middle East and Africa Global Reduced Fat Butter Market Revenue Share (%), by Form 2024 & 2032
- Figure 94: Middle East and Africa Global Reduced Fat Butter Market Volume Share (%), by Form 2024 & 2032
- Figure 95: Middle East and Africa Global Reduced Fat Butter Market Revenue (Million), by Distribution Channel 2024 & 2032
- Figure 96: Middle East and Africa Global Reduced Fat Butter Market Volume (K Units), by Distribution Channel 2024 & 2032
- Figure 97: Middle East and Africa Global Reduced Fat Butter Market Revenue Share (%), by Distribution Channel 2024 & 2032
- Figure 98: Middle East and Africa Global Reduced Fat Butter Market Volume Share (%), by Distribution Channel 2024 & 2032
- Figure 99: Middle East and Africa Global Reduced Fat Butter Market Revenue (Million), by Country 2024 & 2032
- Figure 100: Middle East and Africa Global Reduced Fat Butter Market Volume (K Units), by Country 2024 & 2032
- Figure 101: Middle East and Africa Global Reduced Fat Butter Market Revenue Share (%), by Country 2024 & 2032
- Figure 102: Middle East and Africa Global Reduced Fat Butter Market Volume Share (%), by Country 2024 & 2032
List of Tables
- Table 1: Global Reduced Fat Butter Market Revenue Million Forecast, by Region 2019 & 2032
- Table 2: Global Reduced Fat Butter Market Volume K Units Forecast, by Region 2019 & 2032
- Table 3: Global Reduced Fat Butter Market Revenue Million Forecast, by Type 2019 & 2032
- Table 4: Global Reduced Fat Butter Market Volume K Units Forecast, by Type 2019 & 2032
- Table 5: Global Reduced Fat Butter Market Revenue Million Forecast, by Form 2019 & 2032
- Table 6: Global Reduced Fat Butter Market Volume K Units Forecast, by Form 2019 & 2032
- Table 7: Global Reduced Fat Butter Market Revenue Million Forecast, by Distribution Channel 2019 & 2032
- Table 8: Global Reduced Fat Butter Market Volume K Units Forecast, by Distribution Channel 2019 & 2032
- Table 9: Global Reduced Fat Butter Market Revenue Million Forecast, by Region 2019 & 2032
- Table 10: Global Reduced Fat Butter Market Volume K Units Forecast, by Region 2019 & 2032
- Table 11: Global Reduced Fat Butter Market Revenue Million Forecast, by Country 2019 & 2032
- Table 12: Global Reduced Fat Butter Market Volume K Units Forecast, by Country 2019 & 2032
- Table 13: United States Global Reduced Fat Butter Market Revenue (Million) Forecast, by Application 2019 & 2032
- Table 14: United States Global Reduced Fat Butter Market Volume (K Units) Forecast, by Application 2019 & 2032
- Table 15: Canada Global Reduced Fat Butter Market Revenue (Million) Forecast, by Application 2019 & 2032
- Table 16: Canada Global Reduced Fat Butter Market Volume (K Units) Forecast, by Application 2019 & 2032
- Table 17: Mexico Global Reduced Fat Butter Market Revenue (Million) Forecast, by Application 2019 & 2032
- Table 18: Mexico Global Reduced Fat Butter Market Volume (K Units) Forecast, by Application 2019 & 2032
- Table 19: Rest of North America Global Reduced Fat Butter Market Revenue (Million) Forecast, by Application 2019 & 2032
- Table 20: Rest of North America Global Reduced Fat Butter Market Volume (K Units) Forecast, by Application 2019 & 2032
- Table 21: Global Reduced Fat Butter Market Revenue Million Forecast, by Country 2019 & 2032
- Table 22: Global Reduced Fat Butter Market Volume K Units Forecast, by Country 2019 & 2032
- Table 23: Spain Global Reduced Fat Butter Market Revenue (Million) Forecast, by Application 2019 & 2032
- Table 24: Spain Global Reduced Fat Butter Market Volume (K Units) Forecast, by Application 2019 & 2032
- Table 25: United Kingdom Global Reduced Fat Butter Market Revenue (Million) Forecast, by Application 2019 & 2032
- Table 26: United Kingdom Global Reduced Fat Butter Market Volume (K Units) Forecast, by Application 2019 & 2032
- Table 27: Germany Global Reduced Fat Butter Market Revenue (Million) Forecast, by Application 2019 & 2032
- Table 28: Germany Global Reduced Fat Butter Market Volume (K Units) Forecast, by Application 2019 & 2032
- Table 29: France Global Reduced Fat Butter Market Revenue (Million) Forecast, by Application 2019 & 2032
- Table 30: France Global Reduced Fat Butter Market Volume (K Units) Forecast, by Application 2019 & 2032
- Table 31: Italy Global Reduced Fat Butter Market Revenue (Million) Forecast, by Application 2019 & 2032
- Table 32: Italy Global Reduced Fat Butter Market Volume (K Units) Forecast, by Application 2019 & 2032
- Table 33: Russia Global Reduced Fat Butter Market Revenue (Million) Forecast, by Application 2019 & 2032
- Table 34: Russia Global Reduced Fat Butter Market Volume (K Units) Forecast, by Application 2019 & 2032
- Table 35: Rest of Europe Global Reduced Fat Butter Market Revenue (Million) Forecast, by Application 2019 & 2032
- Table 36: Rest of Europe Global Reduced Fat Butter Market Volume (K Units) Forecast, by Application 2019 & 2032
- Table 37: Global Reduced Fat Butter Market Revenue Million Forecast, by Country 2019 & 2032
- Table 38: Global Reduced Fat Butter Market Volume K Units Forecast, by Country 2019 & 2032
- Table 39: China Global Reduced Fat Butter Market Revenue (Million) Forecast, by Application 2019 & 2032
- Table 40: China Global Reduced Fat Butter Market Volume (K Units) Forecast, by Application 2019 & 2032
- Table 41: Japan Global Reduced Fat Butter Market Revenue (Million) Forecast, by Application 2019 & 2032
- Table 42: Japan Global Reduced Fat Butter Market Volume (K Units) Forecast, by Application 2019 & 2032
- Table 43: India Global Reduced Fat Butter Market Revenue (Million) Forecast, by Application 2019 & 2032
- Table 44: India Global Reduced Fat Butter Market Volume (K Units) Forecast, by Application 2019 & 2032
- Table 45: Australia Global Reduced Fat Butter Market Revenue (Million) Forecast, by Application 2019 & 2032
- Table 46: Australia Global Reduced Fat Butter Market Volume (K Units) Forecast, by Application 2019 & 2032
- Table 47: Rest of Asia Pacific Global Reduced Fat Butter Market Revenue (Million) Forecast, by Application 2019 & 2032
- Table 48: Rest of Asia Pacific Global Reduced Fat Butter Market Volume (K Units) Forecast, by Application 2019 & 2032
- Table 49: Global Reduced Fat Butter Market Revenue Million Forecast, by Country 2019 & 2032
- Table 50: Global Reduced Fat Butter Market Volume K Units Forecast, by Country 2019 & 2032
- Table 51: Brazil Global Reduced Fat Butter Market Revenue (Million) Forecast, by Application 2019 & 2032
- Table 52: Brazil Global Reduced Fat Butter Market Volume (K Units) Forecast, by Application 2019 & 2032
- Table 53: Argentina Global Reduced Fat Butter Market Revenue (Million) Forecast, by Application 2019 & 2032
- Table 54: Argentina Global Reduced Fat Butter Market Volume (K Units) Forecast, by Application 2019 & 2032
- Table 55: Rest of South America Global Reduced Fat Butter Market Revenue (Million) Forecast, by Application 2019 & 2032
- Table 56: Rest of South America Global Reduced Fat Butter Market Volume (K Units) Forecast, by Application 2019 & 2032
- Table 57: Global Reduced Fat Butter Market Revenue Million Forecast, by Country 2019 & 2032
- Table 58: Global Reduced Fat Butter Market Volume K Units Forecast, by Country 2019 & 2032
- Table 59: South Africa Global Reduced Fat Butter Market Revenue (Million) Forecast, by Application 2019 & 2032
- Table 60: South Africa Global Reduced Fat Butter Market Volume (K Units) Forecast, by Application 2019 & 2032
- Table 61: Saudi Arabia Global Reduced Fat Butter Market Revenue (Million) Forecast, by Application 2019 & 2032
- Table 62: Saudi Arabia Global Reduced Fat Butter Market Volume (K Units) Forecast, by Application 2019 & 2032
- Table 63: Rest of Middle East and Africa Global Reduced Fat Butter Market Revenue (Million) Forecast, by Application 2019 & 2032
- Table 64: Rest of Middle East and Africa Global Reduced Fat Butter Market Volume (K Units) Forecast, by Application 2019 & 2032
- Table 65: Global Reduced Fat Butter Market Revenue Million Forecast, by Type 2019 & 2032
- Table 66: Global Reduced Fat Butter Market Volume K Units Forecast, by Type 2019 & 2032
- Table 67: Global Reduced Fat Butter Market Revenue Million Forecast, by Form 2019 & 2032
- Table 68: Global Reduced Fat Butter Market Volume K Units Forecast, by Form 2019 & 2032
- Table 69: Global Reduced Fat Butter Market Revenue Million Forecast, by Distribution Channel 2019 & 2032
- Table 70: Global Reduced Fat Butter Market Volume K Units Forecast, by Distribution Channel 2019 & 2032
- Table 71: Global Reduced Fat Butter Market Revenue Million Forecast, by Country 2019 & 2032
- Table 72: Global Reduced Fat Butter Market Volume K Units Forecast, by Country 2019 & 2032
- Table 73: United States Global Reduced Fat Butter Market Revenue (Million) Forecast, by Application 2019 & 2032
- Table 74: United States Global Reduced Fat Butter Market Volume (K Units) Forecast, by Application 2019 & 2032
- Table 75: Canada Global Reduced Fat Butter Market Revenue (Million) Forecast, by Application 2019 & 2032
- Table 76: Canada Global Reduced Fat Butter Market Volume (K Units) Forecast, by Application 2019 & 2032
- Table 77: Mexico Global Reduced Fat Butter Market Revenue (Million) Forecast, by Application 2019 & 2032
- Table 78: Mexico Global Reduced Fat Butter Market Volume (K Units) Forecast, by Application 2019 & 2032
- Table 79: Rest of North America Global Reduced Fat Butter Market Revenue (Million) Forecast, by Application 2019 & 2032
- Table 80: Rest of North America Global Reduced Fat Butter Market Volume (K Units) Forecast, by Application 2019 & 2032
- Table 81: Global Reduced Fat Butter Market Revenue Million Forecast, by Type 2019 & 2032
- Table 82: Global Reduced Fat Butter Market Volume K Units Forecast, by Type 2019 & 2032
- Table 83: Global Reduced Fat Butter Market Revenue Million Forecast, by Form 2019 & 2032
- Table 84: Global Reduced Fat Butter Market Volume K Units Forecast, by Form 2019 & 2032
- Table 85: Global Reduced Fat Butter Market Revenue Million Forecast, by Distribution Channel 2019 & 2032
- Table 86: Global Reduced Fat Butter Market Volume K Units Forecast, by Distribution Channel 2019 & 2032
- Table 87: Global Reduced Fat Butter Market Revenue Million Forecast, by Country 2019 & 2032
- Table 88: Global Reduced Fat Butter Market Volume K Units Forecast, by Country 2019 & 2032
- Table 89: Spain Global Reduced Fat Butter Market Revenue (Million) Forecast, by Application 2019 & 2032
- Table 90: Spain Global Reduced Fat Butter Market Volume (K Units) Forecast, by Application 2019 & 2032
- Table 91: United Kingdom Global Reduced Fat Butter Market Revenue (Million) Forecast, by Application 2019 & 2032
- Table 92: United Kingdom Global Reduced Fat Butter Market Volume (K Units) Forecast, by Application 2019 & 2032
- Table 93: Germany Global Reduced Fat Butter Market Revenue (Million) Forecast, by Application 2019 & 2032
- Table 94: Germany Global Reduced Fat Butter Market Volume (K Units) Forecast, by Application 2019 & 2032
- Table 95: France Global Reduced Fat Butter Market Revenue (Million) Forecast, by Application 2019 & 2032
- Table 96: France Global Reduced Fat Butter Market Volume (K Units) Forecast, by Application 2019 & 2032
- Table 97: Italy Global Reduced Fat Butter Market Revenue (Million) Forecast, by Application 2019 & 2032
- Table 98: Italy Global Reduced Fat Butter Market Volume (K Units) Forecast, by Application 2019 & 2032
- Table 99: Russia Global Reduced Fat Butter Market Revenue (Million) Forecast, by Application 2019 & 2032
- Table 100: Russia Global Reduced Fat Butter Market Volume (K Units) Forecast, by Application 2019 & 2032
- Table 101: Rest of Europe Global Reduced Fat Butter Market Revenue (Million) Forecast, by Application 2019 & 2032
- Table 102: Rest of Europe Global Reduced Fat Butter Market Volume (K Units) Forecast, by Application 2019 & 2032
- Table 103: Global Reduced Fat Butter Market Revenue Million Forecast, by Type 2019 & 2032
- Table 104: Global Reduced Fat Butter Market Volume K Units Forecast, by Type 2019 & 2032
- Table 105: Global Reduced Fat Butter Market Revenue Million Forecast, by Form 2019 & 2032
- Table 106: Global Reduced Fat Butter Market Volume K Units Forecast, by Form 2019 & 2032
- Table 107: Global Reduced Fat Butter Market Revenue Million Forecast, by Distribution Channel 2019 & 2032
- Table 108: Global Reduced Fat Butter Market Volume K Units Forecast, by Distribution Channel 2019 & 2032
- Table 109: Global Reduced Fat Butter Market Revenue Million Forecast, by Country 2019 & 2032
- Table 110: Global Reduced Fat Butter Market Volume K Units Forecast, by Country 2019 & 2032
- Table 111: China Global Reduced Fat Butter Market Revenue (Million) Forecast, by Application 2019 & 2032
- Table 112: China Global Reduced Fat Butter Market Volume (K Units) Forecast, by Application 2019 & 2032
- Table 113: Japan Global Reduced Fat Butter Market Revenue (Million) Forecast, by Application 2019 & 2032
- Table 114: Japan Global Reduced Fat Butter Market Volume (K Units) Forecast, by Application 2019 & 2032
- Table 115: India Global Reduced Fat Butter Market Revenue (Million) Forecast, by Application 2019 & 2032
- Table 116: India Global Reduced Fat Butter Market Volume (K Units) Forecast, by Application 2019 & 2032
- Table 117: Australia Global Reduced Fat Butter Market Revenue (Million) Forecast, by Application 2019 & 2032
- Table 118: Australia Global Reduced Fat Butter Market Volume (K Units) Forecast, by Application 2019 & 2032
- Table 119: Rest of Asia Pacific Global Reduced Fat Butter Market Revenue (Million) Forecast, by Application 2019 & 2032
- Table 120: Rest of Asia Pacific Global Reduced Fat Butter Market Volume (K Units) Forecast, by Application 2019 & 2032
- Table 121: Global Reduced Fat Butter Market Revenue Million Forecast, by Type 2019 & 2032
- Table 122: Global Reduced Fat Butter Market Volume K Units Forecast, by Type 2019 & 2032
- Table 123: Global Reduced Fat Butter Market Revenue Million Forecast, by Form 2019 & 2032
- Table 124: Global Reduced Fat Butter Market Volume K Units Forecast, by Form 2019 & 2032
- Table 125: Global Reduced Fat Butter Market Revenue Million Forecast, by Distribution Channel 2019 & 2032
- Table 126: Global Reduced Fat Butter Market Volume K Units Forecast, by Distribution Channel 2019 & 2032
- Table 127: Global Reduced Fat Butter Market Revenue Million Forecast, by Country 2019 & 2032
- Table 128: Global Reduced Fat Butter Market Volume K Units Forecast, by Country 2019 & 2032
- Table 129: Brazil Global Reduced Fat Butter Market Revenue (Million) Forecast, by Application 2019 & 2032
- Table 130: Brazil Global Reduced Fat Butter Market Volume (K Units) Forecast, by Application 2019 & 2032
- Table 131: Argentina Global Reduced Fat Butter Market Revenue (Million) Forecast, by Application 2019 & 2032
- Table 132: Argentina Global Reduced Fat Butter Market Volume (K Units) Forecast, by Application 2019 & 2032
- Table 133: Rest of South America Global Reduced Fat Butter Market Revenue (Million) Forecast, by Application 2019 & 2032
- Table 134: Rest of South America Global Reduced Fat Butter Market Volume (K Units) Forecast, by Application 2019 & 2032
- Table 135: Global Reduced Fat Butter Market Revenue Million Forecast, by Type 2019 & 2032
- Table 136: Global Reduced Fat Butter Market Volume K Units Forecast, by Type 2019 & 2032
- Table 137: Global Reduced Fat Butter Market Revenue Million Forecast, by Form 2019 & 2032
- Table 138: Global Reduced Fat Butter Market Volume K Units Forecast, by Form 2019 & 2032
- Table 139: Global Reduced Fat Butter Market Revenue Million Forecast, by Distribution Channel 2019 & 2032
- Table 140: Global Reduced Fat Butter Market Volume K Units Forecast, by Distribution Channel 2019 & 2032
- Table 141: Global Reduced Fat Butter Market Revenue Million Forecast, by Country 2019 & 2032
- Table 142: Global Reduced Fat Butter Market Volume K Units Forecast, by Country 2019 & 2032
- Table 143: South Africa Global Reduced Fat Butter Market Revenue (Million) Forecast, by Application 2019 & 2032
- Table 144: South Africa Global Reduced Fat Butter Market Volume (K Units) Forecast, by Application 2019 & 2032
- Table 145: Saudi Arabia Global Reduced Fat Butter Market Revenue (Million) Forecast, by Application 2019 & 2032
- Table 146: Saudi Arabia Global Reduced Fat Butter Market Volume (K Units) Forecast, by Application 2019 & 2032
- Table 147: Rest of Middle East and Africa Global Reduced Fat Butter Market Revenue (Million) Forecast, by Application 2019 & 2032
- Table 148: Rest of Middle East and Africa Global Reduced Fat Butter Market Volume (K Units) Forecast, by Application 2019 & 2032
Frequently Asked Questions
1. What is the projected Compound Annual Growth Rate (CAGR) of the Global Reduced Fat Butter Market?
The projected CAGR is approximately 6.73%.
2. Which companies are prominent players in the Global Reduced Fat Butter Market?
Key companies in the market include Land O'Lakes Inc, Arla Foods, Finlandia Cheese Inc, Rockview Farms, GCMMF, Ornua Co-operative Limited, Raisio Group plc*List Not Exhaustive, Unilever (Upfield), SAVENCIA SA, Saputo Inc.
3. What are the main segments of the Global Reduced Fat Butter Market?
The market segments include Type, Form, Distribution Channel.
4. Can you provide details about the market size?
The market size is estimated to be USD XX Million as of 2022.
5. What are some drivers contributing to market growth?
Increasing application of Gelatin in healthcare and pharmaceutical sector.
6. What are the notable trends driving market growth?
Surge in Demand for Low Fat and Low Calorie Food Products.
7. Are there any restraints impacting market growth?
Rising demand for clean label products.
8. Can you provide examples of recent developments in the market?
N/A
9. What pricing options are available for accessing the report?
Pricing options include single-user, multi-user, and enterprise licenses priced at USD 4750, USD 5250, and USD 8750 respectively.
10. Is the market size provided in terms of value or volume?
The market size is provided in terms of value, measured in Million and volume, measured in K Units.
11. Are there any specific market keywords associated with the report?
Yes, the market keyword associated with the report is "Global Reduced Fat Butter Market," which aids in identifying and referencing the specific market segment covered.
12. How do I determine which pricing option suits my needs best?
The pricing options vary based on user requirements and access needs. Individual users may opt for single-user licenses, while businesses requiring broader access may choose multi-user or enterprise licenses for cost-effective access to the report.
13. Are there any additional resources or data provided in the Global Reduced Fat Butter Market report?
While the report offers comprehensive insights, it's advisable to review the specific contents or supplementary materials provided to ascertain if additional resources or data are available.
14. How can I stay updated on further developments or reports in the Global Reduced Fat Butter Market?
To stay informed about further developments, trends, and reports in the Global Reduced Fat Butter Market, consider subscribing to industry newsletters, following relevant companies and organizations, or regularly checking reputable industry news sources and publications.
Methodology
Step 1 - Identification of Relevant Samples Size from Population Database


Step 2 - Approaches for Defining Global Market Size (Value, Volume* & Price*)

Note*: In applicable scenarios
Step 3 - Data Sources
Primary Research
- Web Analytics
- Survey Reports
- Research Institute
- Latest Research Reports
- Opinion Leaders
Secondary Research
- Annual Reports
- White Paper
- Latest Press Release
- Industry Association
- Paid Database
- Investor Presentations

Step 4 - Data Triangulation
Involves using different sources of information in order to increase the validity of a study
These sources are likely to be stakeholders in a program - participants, other researchers, program staff, other community members, and so on.
Then we put all data in single framework & apply various statistical tools to find out the dynamic on the market.
During the analysis stage, feedback from the stakeholder groups would be compared to determine areas of agreement as well as areas of divergence


