
Key Insights
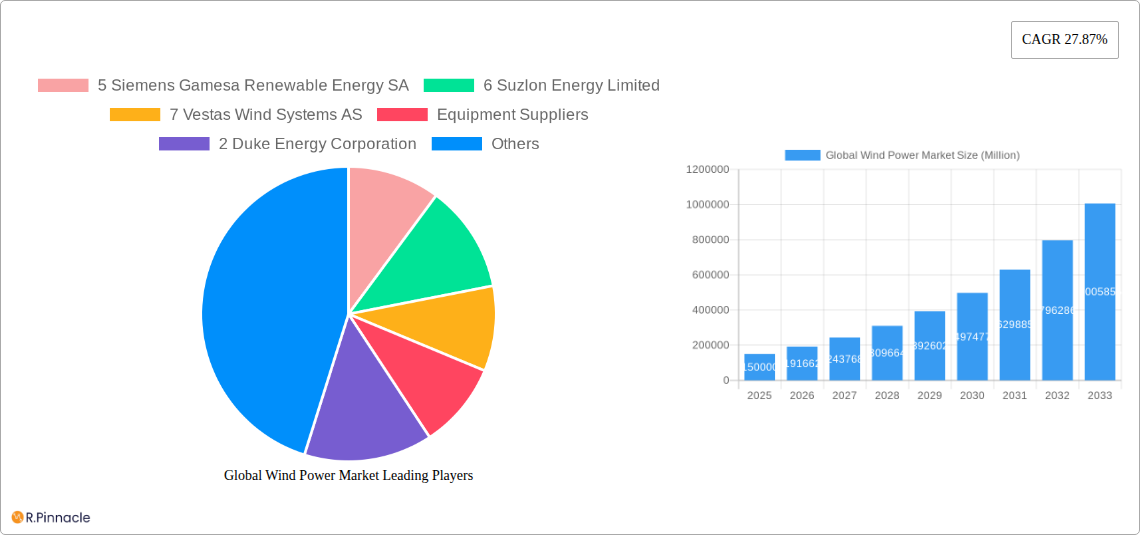
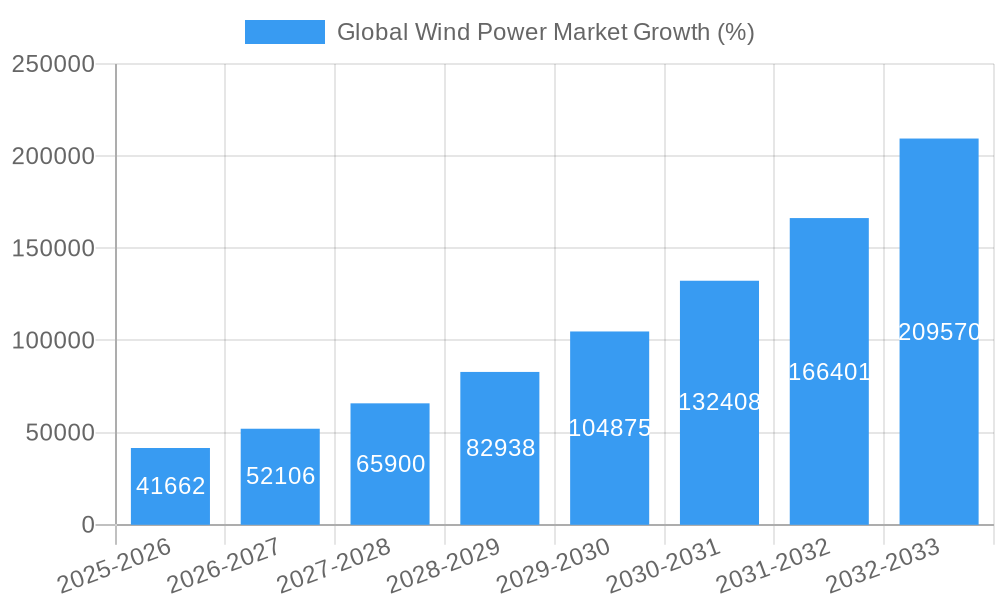
The global wind power market is experiencing robust growth, driven by increasing concerns about climate change, supportive government policies promoting renewable energy, and declining wind turbine costs. The market's Compound Annual Growth Rate (CAGR) of 27.87% from 2019 to 2024 suggests a significant expansion, which is expected to continue throughout the forecast period (2025-2033). This growth is fueled by several key trends, including the rising adoption of offshore wind farms, advancements in turbine technology leading to increased efficiency and capacity, and the integration of smart grids to better manage fluctuating renewable energy sources. Major market players, such as Siemens Gamesa, Vestas, and Goldwind, are investing heavily in research and development, expanding their manufacturing capabilities, and strategically acquiring smaller companies to maintain their competitive edge. While challenges such as grid infrastructure limitations and the intermittent nature of wind power remain, ongoing technological innovations and supportive regulatory frameworks are mitigating these hurdles. Geographic expansion into regions with high wind potential, particularly in Asia Pacific and other developing economies, is further contributing to the market's impressive growth trajectory.
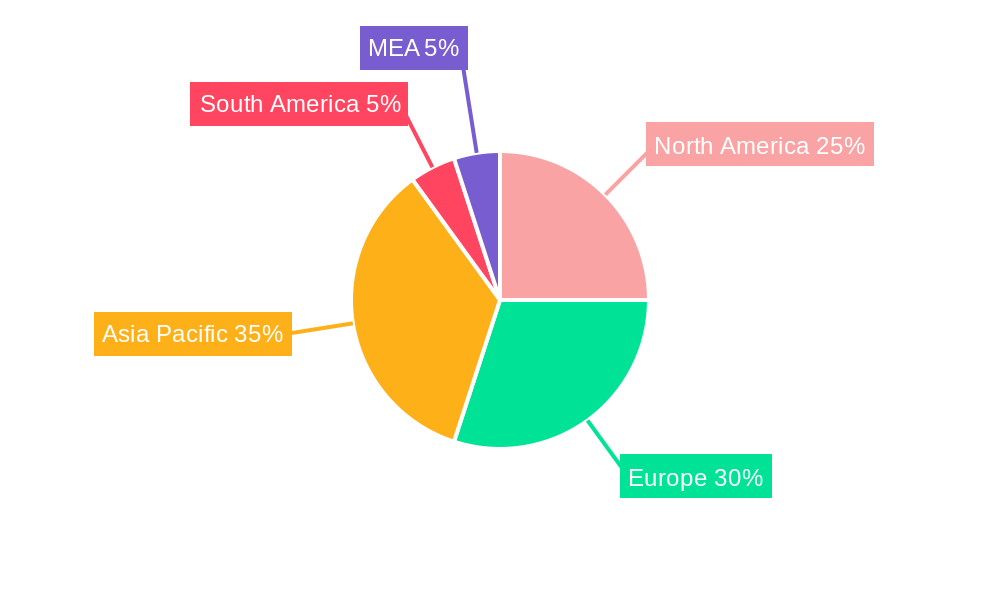
The market segmentation reveals a strong preference for onshore wind farms historically, due to lower initial investment costs and established infrastructure. However, the offshore segment is expected to demonstrate faster growth in the coming years due to its significantly higher capacity potential and less impact on land use. North America and Europe currently hold substantial market shares, driven by mature renewable energy policies and technological expertise. However, the Asia-Pacific region is poised for substantial growth, fueled by rapid economic development and significant government investment in renewable energy infrastructure. This shift in regional dominance highlights the market's dynamic nature and presents substantial opportunities for companies to expand into emerging markets. The competitive landscape is characterized by both large multinational corporations and smaller specialized companies, each focusing on specific segments of the value chain (turbine manufacturing, wind farm operations, and grid integration). This competitive dynamic is driving innovation and cost reductions, fostering a healthy and expanding market for wind power generation.
This comprehensive report provides an in-depth analysis of the global wind power market, offering valuable insights for industry professionals, investors, and stakeholders. Covering the period from 2019 to 2033, with a focus on 2025, this report examines market dynamics, technological advancements, and competitive landscapes to illuminate growth opportunities and potential challenges.
Global Wind Power Market Market Structure & Innovation Trends
This section analyzes the market structure, highlighting key players, their market share, and mergers & acquisitions (M&A) activities. The report examines the concentration of the market, identifying the top players and assessing their influence. Innovation drivers, such as government policies and technological advancements, are also discussed. The impact of regulatory frameworks and the existence of product substitutes are explored, along with an examination of end-user demographics and their influence on market demand.
- Market Concentration: The market exhibits a moderately concentrated structure with key players like Vestas Wind Systems AS, Siemens Gamesa Renewable Energy SA, and Goldwind holding significant market share (exact figures detailed within the report).
- M&A Activity: The report analyzes recent M&A deals, providing details on deal values and their impact on market consolidation. For example, xx Million in M&A deals were observed in the historical period.
- Innovation Drivers: Technological advancements in turbine design, energy storage solutions, and digitalization are driving innovation. Government support through subsidies and renewable energy mandates further stimulates market growth.
- Regulatory Frameworks: Varying regulatory landscapes across different regions influence market dynamics. The report analyzes the impact of specific regulations on market expansion.
- Product Substitutes: The report assesses the competitive threat posed by alternative energy sources such as solar power and evaluates their market penetration.
- End-User Demographics: Analysis of end-user demand from both onshore and offshore wind power sectors is included.
Global Wind Power Market Market Dynamics & Trends
This section delves into the key drivers and trends shaping the global wind power market. It explores market growth, analyzing historical data (2019-2024) and providing forecasts for the future (2025-2033). Technological disruptions, evolving consumer preferences, and the competitive dynamics within the industry are discussed. Specific metrics, such as the Compound Annual Growth Rate (CAGR) and market penetration rates, are provided to quantify market growth. The section includes analysis of supply chain dynamics, technological shifts and the impacts of the energy transition. This analysis provides a deep dive into the forces driving market expansion, potential challenges and the overall development trajectory. The CAGR for the forecast period is estimated at xx%. Market penetration is projected to reach xx% by 2033.
Dominant Regions & Segments in Global Wind Power Market
This section identifies the leading regions and segments within the global wind power market. Detailed analysis focuses on the key drivers of growth in the dominant regions and segments, including onshore and offshore wind power generation. Economic policies, infrastructure development, and favorable regulatory environments are examined as contributing factors.
Onshore Wind Power:
- Key Drivers: Government incentives, readily available land, and established grid infrastructure contribute to strong onshore wind power growth in specific regions.
- Dominant Regions: [Specific regions and countries with detailed analysis of their dominance]
Offshore Wind Power:
- Key Drivers: Abundant wind resources, technological advancements in offshore turbine technology, and increasing government support are driving growth in the offshore segment.
- Dominant Regions: [Specific regions and countries with detailed analysis of their dominance]
Global Wind Power Market Product Innovations
This section summarizes recent advancements in wind turbine technology, focusing on innovations that improve efficiency, reduce costs, and enhance performance. New applications and their competitive advantages are highlighted, examining how technological improvements impact market adoption and competitiveness. Examples of significant innovations and their market implications are discussed.
Report Scope & Segmentation Analysis
This report segments the global wind power market by location (onshore and offshore). Growth projections, market sizes, and competitive dynamics are detailed for each segment.
Onshore Wind Power: [Growth projections, market size, competitive dynamics]
Offshore Wind Power: [Growth projections, market size, competitive dynamics]
Key Drivers of Global Wind Power Market Growth
Several factors contribute to the growth of the global wind power market. These include:
- Technological advancements: Improved turbine designs, larger turbine capacities, and advanced energy storage solutions are key drivers.
- Government policies and incentives: Subsidies, renewable energy targets, and supportive regulatory frameworks are crucial.
- Falling costs: Decreasing costs of wind turbine technology are making wind power increasingly competitive with fossil fuels.
Challenges in the Global Wind Power Market Sector
The wind power market faces challenges, including:
- Intermittency: Wind power's dependence on weather patterns presents challenges for grid stability and reliability.
- Environmental impacts: The impact of wind farms on wildlife and landscapes remains a concern.
- Supply chain disruptions: Geopolitical factors and material shortages can impact the supply chain.
Emerging Opportunities in Global Wind Power Market
Emerging opportunities in the global wind power market include:
- Floating offshore wind: This technology enables wind power generation in deeper waters, unlocking significant untapped resources.
- Hybrid projects: Combining wind and solar power in hybrid projects enhances energy efficiency and reliability.
- Energy storage solutions: Integrating energy storage systems with wind farms addresses the intermittency challenge.
Leading Players in the Global Wind Power Market Market
- Siemens Gamesa Renewable Energy SA
- Suzlon Energy Limited
- Vestas Wind Systems AS
- Duke Energy Corporation
- E.ON SE
- NextEra Energy Inc
- Xinjiang Goldwind Science & Technology Co Ltd (Goldwind)
- Envision Energy
- Orsted AS
- EDF SA
- Dongfang Electric Corporation
- General Electric Company
- Aerodyn Energiesysteme GmbH
- Acciona Energia SA
Key Developments in Global Wind Power Market Industry
- November 2023: The UK government increased offshore wind farm subsidies by 66%, significantly boosting investment in the sector.
- April 2024: Mahindra Group invested USD 144 Million in solar and wind energy projects, highlighting growing private sector interest in renewable energy.
Future Outlook for Global Wind Power Market Market
The future of the global wind power market appears bright. Continued technological advancements, supportive government policies, and falling costs will drive significant market expansion. Strategic partnerships and investments in research and development will further accelerate growth, making wind power a key component of the global energy transition. The market is expected to experience robust growth in the coming years, driven by increasing demand for clean energy and supportive government policies.
Global Wind Power Market Segmentation
-
1. Location
- 1.1. Onshore
- 1.2. Offshore
Global Wind Power Market Segmentation By Geography
-
1. North America
- 1.1. United States
- 1.2. Canada
- 1.3. Rest of North America
-
2. Europe
- 2.1. United Kingdom
- 2.2. France
- 2.3. Norway
- 2.4. Germany
- 2.5. Spain
- 2.6. Turkey
- 2.7. Russia
- 2.8. NORDIC
- 2.9. Rest of Europe
-
3. Asia Pacific
- 3.1. China
- 3.2. India
- 3.3. Japan
- 3.4. Malaysia
- 3.5. Thailand
- 3.6. Indonesia
- 3.7. Vietnam
- 4. Rest of Asia Pacific
-
5. Middle East and Africa
- 5.1. United Arab Emirates
- 5.2. Egypt
- 5.3. Saudi Arabia
- 5.4. Nigeria
- 5.5. Qatar
- 6. Rest of Middle East and Africa
-
7. South America
- 7.1. Brazil
- 7.2. Chile
- 7.3. Argentina
- 7.4. Colombia
- 7.5. Rest of South America
Global Wind Power Market REPORT HIGHLIGHTS
| Aspects | Details |
|---|---|
| Study Period | 2019-2033 |
| Base Year | 2024 |
| Estimated Year | 2025 |
| Forecast Period | 2025-2033 |
| Historical Period | 2019-2024 |
| Growth Rate | CAGR of 27.87% from 2019-2033 |
| Segmentation |
|
Table of Contents
- 1. Introduction
- 1.1. Research Scope
- 1.2. Market Segmentation
- 1.3. Research Methodology
- 1.4. Definitions and Assumptions
- 2. Executive Summary
- 2.1. Introduction
- 3. Market Dynamics
- 3.1. Introduction
- 3.2. Market Drivers
- 3.2.1. 4.; Increasing Investments in Offshore Wind Power Projects4.; Supportive Government Policies
- 3.3. Market Restrains
- 3.3.1. 4.; Increasing Adopting of Alternative Clean Energy Sources (Ex
- 3.4. Market Trends
- 3.4.1. The Offshore Wind Power Sector is Expected to Witness Significant Growth
- 4. Market Factor Analysis
- 4.1. Porters Five Forces
- 4.2. Supply/Value Chain
- 4.3. PESTEL analysis
- 4.4. Market Entropy
- 4.5. Patent/Trademark Analysis
- 5. Global Wind Power Market Analysis, Insights and Forecast, 2019-2031
- 5.1. Market Analysis, Insights and Forecast - by Location
- 5.1.1. Onshore
- 5.1.2. Offshore
- 5.2. Market Analysis, Insights and Forecast - by Region
- 5.2.1. North America
- 5.2.2. Europe
- 5.2.3. Asia Pacific
- 5.2.4. Rest of Asia Pacific
- 5.2.5. Middle East and Africa
- 5.2.6. Rest of Middle East and Africa
- 5.2.7. South America
- 5.1. Market Analysis, Insights and Forecast - by Location
- 6. North America Global Wind Power Market Analysis, Insights and Forecast, 2019-2031
- 6.1. Market Analysis, Insights and Forecast - by Location
- 6.1.1. Onshore
- 6.1.2. Offshore
- 6.1. Market Analysis, Insights and Forecast - by Location
- 7. Europe Global Wind Power Market Analysis, Insights and Forecast, 2019-2031
- 7.1. Market Analysis, Insights and Forecast - by Location
- 7.1.1. Onshore
- 7.1.2. Offshore
- 7.1. Market Analysis, Insights and Forecast - by Location
- 8. Asia Pacific Global Wind Power Market Analysis, Insights and Forecast, 2019-2031
- 8.1. Market Analysis, Insights and Forecast - by Location
- 8.1.1. Onshore
- 8.1.2. Offshore
- 8.1. Market Analysis, Insights and Forecast - by Location
- 9. Rest of Asia Pacific Global Wind Power Market Analysis, Insights and Forecast, 2019-2031
- 9.1. Market Analysis, Insights and Forecast - by Location
- 9.1.1. Onshore
- 9.1.2. Offshore
- 9.1. Market Analysis, Insights and Forecast - by Location
- 10. Middle East and Africa Global Wind Power Market Analysis, Insights and Forecast, 2019-2031
- 10.1. Market Analysis, Insights and Forecast - by Location
- 10.1.1. Onshore
- 10.1.2. Offshore
- 10.1. Market Analysis, Insights and Forecast - by Location
- 11. Rest of Middle East and Africa Global Wind Power Market Analysis, Insights and Forecast, 2019-2031
- 11.1. Market Analysis, Insights and Forecast - by Location
- 11.1.1. Onshore
- 11.1.2. Offshore
- 11.1. Market Analysis, Insights and Forecast - by Location
- 12. South America Global Wind Power Market Analysis, Insights and Forecast, 2019-2031
- 12.1. Market Analysis, Insights and Forecast - by Location
- 12.1.1. Onshore
- 12.1.2. Offshore
- 12.1. Market Analysis, Insights and Forecast - by Location
- 13. North America Global Wind Power Market Analysis, Insights and Forecast, 2019-2031
- 13.1. Market Analysis, Insights and Forecast - By Country/Sub-region
- 13.1.1 United States
- 13.1.2 Canada
- 13.1.3 Mexico
- 14. Europe Global Wind Power Market Analysis, Insights and Forecast, 2019-2031
- 14.1. Market Analysis, Insights and Forecast - By Country/Sub-region
- 14.1.1 Germany
- 14.1.2 United Kingdom
- 14.1.3 France
- 14.1.4 Spain
- 14.1.5 Italy
- 14.1.6 Spain
- 14.1.7 Belgium
- 14.1.8 Netherland
- 14.1.9 Nordics
- 14.1.10 Rest of Europe
- 15. Asia Pacific Global Wind Power Market Analysis, Insights and Forecast, 2019-2031
- 15.1. Market Analysis, Insights and Forecast - By Country/Sub-region
- 15.1.1 China
- 15.1.2 Japan
- 15.1.3 India
- 15.1.4 South Korea
- 15.1.5 Southeast Asia
- 15.1.6 Australia
- 15.1.7 Indonesia
- 15.1.8 Phillipes
- 15.1.9 Singapore
- 15.1.10 Thailandc
- 15.1.11 Rest of Asia Pacific
- 16. South America Global Wind Power Market Analysis, Insights and Forecast, 2019-2031
- 16.1. Market Analysis, Insights and Forecast - By Country/Sub-region
- 16.1.1 Brazil
- 16.1.2 Argentina
- 16.1.3 Peru
- 16.1.4 Chile
- 16.1.5 Colombia
- 16.1.6 Ecuador
- 16.1.7 Venezuela
- 16.1.8 Rest of South America
- 17. North America Global Wind Power Market Analysis, Insights and Forecast, 2019-2031
- 17.1. Market Analysis, Insights and Forecast - By Country/Sub-region
- 17.1.1 United States
- 17.1.2 Canada
- 17.1.3 Mexico
- 18. MEA Global Wind Power Market Analysis, Insights and Forecast, 2019-2031
- 18.1. Market Analysis, Insights and Forecast - By Country/Sub-region
- 18.1.1 United Arab Emirates
- 18.1.2 Saudi Arabia
- 18.1.3 South Africa
- 18.1.4 Rest of Middle East and Africa
- 19. Competitive Analysis
- 19.1. Market Share Analysis 2024
- 19.2. Company Profiles
- 19.2.1 5 Siemens Gamesa Renewable Energy SA
- 19.2.1.1. Overview
- 19.2.1.2. Products
- 19.2.1.3. SWOT Analysis
- 19.2.1.4. Recent Developments
- 19.2.1.5. Financials (Based on Availability)
- 19.2.2 6 Suzlon Energy Limited
- 19.2.2.1. Overview
- 19.2.2.2. Products
- 19.2.2.3. SWOT Analysis
- 19.2.2.4. Recent Developments
- 19.2.2.5. Financials (Based on Availability)
- 19.2.3 7 Vestas Wind Systems AS
- 19.2.3.1. Overview
- 19.2.3.2. Products
- 19.2.3.3. SWOT Analysis
- 19.2.3.4. Recent Developments
- 19.2.3.5. Financials (Based on Availability)
- 19.2.4 Equipment Suppliers
- 19.2.4.1. Overview
- 19.2.4.2. Products
- 19.2.4.3. SWOT Analysis
- 19.2.4.4. Recent Developments
- 19.2.4.5. Financials (Based on Availability)
- 19.2.5 2 Duke Energy Corporation
- 19.2.5.1. Overview
- 19.2.5.2. Products
- 19.2.5.3. SWOT Analysis
- 19.2.5.4. Recent Developments
- 19.2.5.5. Financials (Based on Availability)
- 19.2.6 6 E ON SE
- 19.2.6.1. Overview
- 19.2.6.2. Products
- 19.2.6.3. SWOT Analysis
- 19.2.6.4. Recent Developments
- 19.2.6.5. Financials (Based on Availability)
- 19.2.7 5 NextEra Energy Inc
- 19.2.7.1. Overview
- 19.2.7.2. Products
- 19.2.7.3. SWOT Analysis
- 19.2.7.4. Recent Developments
- 19.2.7.5. Financials (Based on Availability)
- 19.2.8 4 Xinjiang Goldwind Science & Technology Co Ltd (Goldwind)
- 19.2.8.1. Overview
- 19.2.8.2. Products
- 19.2.8.3. SWOT Analysis
- 19.2.8.4. Recent Developments
- 19.2.8.5. Financials (Based on Availability)
- 19.2.9 2 Envision Energy
- 19.2.9.1. Overview
- 19.2.9.2. Products
- 19.2.9.3. SWOT Analysis
- 19.2.9.4. Recent Developments
- 19.2.9.5. Financials (Based on Availability)
- 19.2.10 4 Orsted AS
- 19.2.10.1. Overview
- 19.2.10.2. Products
- 19.2.10.3. SWOT Analysis
- 19.2.10.4. Recent Developments
- 19.2.10.5. Financials (Based on Availability)
- 19.2.11 Wind Farm Operators
- 19.2.11.1. Overview
- 19.2.11.2. Products
- 19.2.11.3. SWOT Analysis
- 19.2.11.4. Recent Developments
- 19.2.11.5. Financials (Based on Availability)
- 19.2.12 3 EDF SA
- 19.2.12.1. Overview
- 19.2.12.2. Products
- 19.2.12.3. SWOT Analysis
- 19.2.12.4. Recent Developments
- 19.2.12.5. Financials (Based on Availability)
- 19.2.13 8 Dongfang Electric Corporation*List Not Exhaustive 6 5 Market Share/Ranking Analysi
- 19.2.13.1. Overview
- 19.2.13.2. Products
- 19.2.13.3. SWOT Analysis
- 19.2.13.4. Recent Developments
- 19.2.13.5. Financials (Based on Availability)
- 19.2.14 3 General Electric Company
- 19.2.14.1. Overview
- 19.2.14.2. Products
- 19.2.14.3. SWOT Analysis
- 19.2.14.4. Recent Developments
- 19.2.14.5. Financials (Based on Availability)
- 19.2.15 1 Aerodyn Energiesysteme GmbH
- 19.2.15.1. Overview
- 19.2.15.2. Products
- 19.2.15.3. SWOT Analysis
- 19.2.15.4. Recent Developments
- 19.2.15.5. Financials (Based on Availability)
- 19.2.16 1 Acciona Energia SA
- 19.2.16.1. Overview
- 19.2.16.2. Products
- 19.2.16.3. SWOT Analysis
- 19.2.16.4. Recent Developments
- 19.2.16.5. Financials (Based on Availability)
- 19.2.1 5 Siemens Gamesa Renewable Energy SA
List of Figures
- Figure 1: Global Global Wind Power Market Revenue Breakdown (Million, %) by Region 2024 & 2032
- Figure 2: Global Global Wind Power Market Volume Breakdown (Thousand, %) by Region 2024 & 2032
- Figure 3: North America Global Wind Power Market Revenue (Million), by Country 2024 & 2032
- Figure 4: North America Global Wind Power Market Volume (Thousand), by Country 2024 & 2032
- Figure 5: North America Global Wind Power Market Revenue Share (%), by Country 2024 & 2032
- Figure 6: North America Global Wind Power Market Volume Share (%), by Country 2024 & 2032
- Figure 7: Europe Global Wind Power Market Revenue (Million), by Country 2024 & 2032
- Figure 8: Europe Global Wind Power Market Volume (Thousand), by Country 2024 & 2032
- Figure 9: Europe Global Wind Power Market Revenue Share (%), by Country 2024 & 2032
- Figure 10: Europe Global Wind Power Market Volume Share (%), by Country 2024 & 2032
- Figure 11: Asia Pacific Global Wind Power Market Revenue (Million), by Country 2024 & 2032
- Figure 12: Asia Pacific Global Wind Power Market Volume (Thousand), by Country 2024 & 2032
- Figure 13: Asia Pacific Global Wind Power Market Revenue Share (%), by Country 2024 & 2032
- Figure 14: Asia Pacific Global Wind Power Market Volume Share (%), by Country 2024 & 2032
- Figure 15: South America Global Wind Power Market Revenue (Million), by Country 2024 & 2032
- Figure 16: South America Global Wind Power Market Volume (Thousand), by Country 2024 & 2032
- Figure 17: South America Global Wind Power Market Revenue Share (%), by Country 2024 & 2032
- Figure 18: South America Global Wind Power Market Volume Share (%), by Country 2024 & 2032
- Figure 19: North America Global Wind Power Market Revenue (Million), by Country 2024 & 2032
- Figure 20: North America Global Wind Power Market Volume (Thousand), by Country 2024 & 2032
- Figure 21: North America Global Wind Power Market Revenue Share (%), by Country 2024 & 2032
- Figure 22: North America Global Wind Power Market Volume Share (%), by Country 2024 & 2032
- Figure 23: MEA Global Wind Power Market Revenue (Million), by Country 2024 & 2032
- Figure 24: MEA Global Wind Power Market Volume (Thousand), by Country 2024 & 2032
- Figure 25: MEA Global Wind Power Market Revenue Share (%), by Country 2024 & 2032
- Figure 26: MEA Global Wind Power Market Volume Share (%), by Country 2024 & 2032
- Figure 27: North America Global Wind Power Market Revenue (Million), by Location 2024 & 2032
- Figure 28: North America Global Wind Power Market Volume (Thousand), by Location 2024 & 2032
- Figure 29: North America Global Wind Power Market Revenue Share (%), by Location 2024 & 2032
- Figure 30: North America Global Wind Power Market Volume Share (%), by Location 2024 & 2032
- Figure 31: North America Global Wind Power Market Revenue (Million), by Country 2024 & 2032
- Figure 32: North America Global Wind Power Market Volume (Thousand), by Country 2024 & 2032
- Figure 33: North America Global Wind Power Market Revenue Share (%), by Country 2024 & 2032
- Figure 34: North America Global Wind Power Market Volume Share (%), by Country 2024 & 2032
- Figure 35: Europe Global Wind Power Market Revenue (Million), by Location 2024 & 2032
- Figure 36: Europe Global Wind Power Market Volume (Thousand), by Location 2024 & 2032
- Figure 37: Europe Global Wind Power Market Revenue Share (%), by Location 2024 & 2032
- Figure 38: Europe Global Wind Power Market Volume Share (%), by Location 2024 & 2032
- Figure 39: Europe Global Wind Power Market Revenue (Million), by Country 2024 & 2032
- Figure 40: Europe Global Wind Power Market Volume (Thousand), by Country 2024 & 2032
- Figure 41: Europe Global Wind Power Market Revenue Share (%), by Country 2024 & 2032
- Figure 42: Europe Global Wind Power Market Volume Share (%), by Country 2024 & 2032
- Figure 43: Asia Pacific Global Wind Power Market Revenue (Million), by Location 2024 & 2032
- Figure 44: Asia Pacific Global Wind Power Market Volume (Thousand), by Location 2024 & 2032
- Figure 45: Asia Pacific Global Wind Power Market Revenue Share (%), by Location 2024 & 2032
- Figure 46: Asia Pacific Global Wind Power Market Volume Share (%), by Location 2024 & 2032
- Figure 47: Asia Pacific Global Wind Power Market Revenue (Million), by Country 2024 & 2032
- Figure 48: Asia Pacific Global Wind Power Market Volume (Thousand), by Country 2024 & 2032
- Figure 49: Asia Pacific Global Wind Power Market Revenue Share (%), by Country 2024 & 2032
- Figure 50: Asia Pacific Global Wind Power Market Volume Share (%), by Country 2024 & 2032
- Figure 51: Rest of Asia Pacific Global Wind Power Market Revenue (Million), by Location 2024 & 2032
- Figure 52: Rest of Asia Pacific Global Wind Power Market Volume (Thousand), by Location 2024 & 2032
- Figure 53: Rest of Asia Pacific Global Wind Power Market Revenue Share (%), by Location 2024 & 2032
- Figure 54: Rest of Asia Pacific Global Wind Power Market Volume Share (%), by Location 2024 & 2032
- Figure 55: Rest of Asia Pacific Global Wind Power Market Revenue (Million), by Country 2024 & 2032
- Figure 56: Rest of Asia Pacific Global Wind Power Market Volume (Thousand), by Country 2024 & 2032
- Figure 57: Rest of Asia Pacific Global Wind Power Market Revenue Share (%), by Country 2024 & 2032
- Figure 58: Rest of Asia Pacific Global Wind Power Market Volume Share (%), by Country 2024 & 2032
- Figure 59: Middle East and Africa Global Wind Power Market Revenue (Million), by Location 2024 & 2032
- Figure 60: Middle East and Africa Global Wind Power Market Volume (Thousand), by Location 2024 & 2032
- Figure 61: Middle East and Africa Global Wind Power Market Revenue Share (%), by Location 2024 & 2032
- Figure 62: Middle East and Africa Global Wind Power Market Volume Share (%), by Location 2024 & 2032
- Figure 63: Middle East and Africa Global Wind Power Market Revenue (Million), by Country 2024 & 2032
- Figure 64: Middle East and Africa Global Wind Power Market Volume (Thousand), by Country 2024 & 2032
- Figure 65: Middle East and Africa Global Wind Power Market Revenue Share (%), by Country 2024 & 2032
- Figure 66: Middle East and Africa Global Wind Power Market Volume Share (%), by Country 2024 & 2032
- Figure 67: Rest of Middle East and Africa Global Wind Power Market Revenue (Million), by Location 2024 & 2032
- Figure 68: Rest of Middle East and Africa Global Wind Power Market Volume (Thousand), by Location 2024 & 2032
- Figure 69: Rest of Middle East and Africa Global Wind Power Market Revenue Share (%), by Location 2024 & 2032
- Figure 70: Rest of Middle East and Africa Global Wind Power Market Volume Share (%), by Location 2024 & 2032
- Figure 71: Rest of Middle East and Africa Global Wind Power Market Revenue (Million), by Country 2024 & 2032
- Figure 72: Rest of Middle East and Africa Global Wind Power Market Volume (Thousand), by Country 2024 & 2032
- Figure 73: Rest of Middle East and Africa Global Wind Power Market Revenue Share (%), by Country 2024 & 2032
- Figure 74: Rest of Middle East and Africa Global Wind Power Market Volume Share (%), by Country 2024 & 2032
- Figure 75: South America Global Wind Power Market Revenue (Million), by Location 2024 & 2032
- Figure 76: South America Global Wind Power Market Volume (Thousand), by Location 2024 & 2032
- Figure 77: South America Global Wind Power Market Revenue Share (%), by Location 2024 & 2032
- Figure 78: South America Global Wind Power Market Volume Share (%), by Location 2024 & 2032
- Figure 79: South America Global Wind Power Market Revenue (Million), by Country 2024 & 2032
- Figure 80: South America Global Wind Power Market Volume (Thousand), by Country 2024 & 2032
- Figure 81: South America Global Wind Power Market Revenue Share (%), by Country 2024 & 2032
- Figure 82: South America Global Wind Power Market Volume Share (%), by Country 2024 & 2032
List of Tables
- Table 1: Global Wind Power Market Revenue Million Forecast, by Region 2019 & 2032
- Table 2: Global Wind Power Market Volume Thousand Forecast, by Region 2019 & 2032
- Table 3: Global Wind Power Market Revenue Million Forecast, by Location 2019 & 2032
- Table 4: Global Wind Power Market Volume Thousand Forecast, by Location 2019 & 2032
- Table 5: Global Wind Power Market Revenue Million Forecast, by Region 2019 & 2032
- Table 6: Global Wind Power Market Volume Thousand Forecast, by Region 2019 & 2032
- Table 7: Global Wind Power Market Revenue Million Forecast, by Country 2019 & 2032
- Table 8: Global Wind Power Market Volume Thousand Forecast, by Country 2019 & 2032
- Table 9: United States Global Wind Power Market Revenue (Million) Forecast, by Application 2019 & 2032
- Table 10: United States Global Wind Power Market Volume (Thousand) Forecast, by Application 2019 & 2032
- Table 11: Canada Global Wind Power Market Revenue (Million) Forecast, by Application 2019 & 2032
- Table 12: Canada Global Wind Power Market Volume (Thousand) Forecast, by Application 2019 & 2032
- Table 13: Mexico Global Wind Power Market Revenue (Million) Forecast, by Application 2019 & 2032
- Table 14: Mexico Global Wind Power Market Volume (Thousand) Forecast, by Application 2019 & 2032
- Table 15: Global Wind Power Market Revenue Million Forecast, by Country 2019 & 2032
- Table 16: Global Wind Power Market Volume Thousand Forecast, by Country 2019 & 2032
- Table 17: Germany Global Wind Power Market Revenue (Million) Forecast, by Application 2019 & 2032
- Table 18: Germany Global Wind Power Market Volume (Thousand) Forecast, by Application 2019 & 2032
- Table 19: United Kingdom Global Wind Power Market Revenue (Million) Forecast, by Application 2019 & 2032
- Table 20: United Kingdom Global Wind Power Market Volume (Thousand) Forecast, by Application 2019 & 2032
- Table 21: France Global Wind Power Market Revenue (Million) Forecast, by Application 2019 & 2032
- Table 22: France Global Wind Power Market Volume (Thousand) Forecast, by Application 2019 & 2032
- Table 23: Spain Global Wind Power Market Revenue (Million) Forecast, by Application 2019 & 2032
- Table 24: Spain Global Wind Power Market Volume (Thousand) Forecast, by Application 2019 & 2032
- Table 25: Italy Global Wind Power Market Revenue (Million) Forecast, by Application 2019 & 2032
- Table 26: Italy Global Wind Power Market Volume (Thousand) Forecast, by Application 2019 & 2032
- Table 27: Spain Global Wind Power Market Revenue (Million) Forecast, by Application 2019 & 2032
- Table 28: Spain Global Wind Power Market Volume (Thousand) Forecast, by Application 2019 & 2032
- Table 29: Belgium Global Wind Power Market Revenue (Million) Forecast, by Application 2019 & 2032
- Table 30: Belgium Global Wind Power Market Volume (Thousand) Forecast, by Application 2019 & 2032
- Table 31: Netherland Global Wind Power Market Revenue (Million) Forecast, by Application 2019 & 2032
- Table 32: Netherland Global Wind Power Market Volume (Thousand) Forecast, by Application 2019 & 2032
- Table 33: Nordics Global Wind Power Market Revenue (Million) Forecast, by Application 2019 & 2032
- Table 34: Nordics Global Wind Power Market Volume (Thousand) Forecast, by Application 2019 & 2032
- Table 35: Rest of Europe Global Wind Power Market Revenue (Million) Forecast, by Application 2019 & 2032
- Table 36: Rest of Europe Global Wind Power Market Volume (Thousand) Forecast, by Application 2019 & 2032
- Table 37: Global Wind Power Market Revenue Million Forecast, by Country 2019 & 2032
- Table 38: Global Wind Power Market Volume Thousand Forecast, by Country 2019 & 2032
- Table 39: China Global Wind Power Market Revenue (Million) Forecast, by Application 2019 & 2032
- Table 40: China Global Wind Power Market Volume (Thousand) Forecast, by Application 2019 & 2032
- Table 41: Japan Global Wind Power Market Revenue (Million) Forecast, by Application 2019 & 2032
- Table 42: Japan Global Wind Power Market Volume (Thousand) Forecast, by Application 2019 & 2032
- Table 43: India Global Wind Power Market Revenue (Million) Forecast, by Application 2019 & 2032
- Table 44: India Global Wind Power Market Volume (Thousand) Forecast, by Application 2019 & 2032
- Table 45: South Korea Global Wind Power Market Revenue (Million) Forecast, by Application 2019 & 2032
- Table 46: South Korea Global Wind Power Market Volume (Thousand) Forecast, by Application 2019 & 2032
- Table 47: Southeast Asia Global Wind Power Market Revenue (Million) Forecast, by Application 2019 & 2032
- Table 48: Southeast Asia Global Wind Power Market Volume (Thousand) Forecast, by Application 2019 & 2032
- Table 49: Australia Global Wind Power Market Revenue (Million) Forecast, by Application 2019 & 2032
- Table 50: Australia Global Wind Power Market Volume (Thousand) Forecast, by Application 2019 & 2032
- Table 51: Indonesia Global Wind Power Market Revenue (Million) Forecast, by Application 2019 & 2032
- Table 52: Indonesia Global Wind Power Market Volume (Thousand) Forecast, by Application 2019 & 2032
- Table 53: Phillipes Global Wind Power Market Revenue (Million) Forecast, by Application 2019 & 2032
- Table 54: Phillipes Global Wind Power Market Volume (Thousand) Forecast, by Application 2019 & 2032
- Table 55: Singapore Global Wind Power Market Revenue (Million) Forecast, by Application 2019 & 2032
- Table 56: Singapore Global Wind Power Market Volume (Thousand) Forecast, by Application 2019 & 2032
- Table 57: Thailandc Global Wind Power Market Revenue (Million) Forecast, by Application 2019 & 2032
- Table 58: Thailandc Global Wind Power Market Volume (Thousand) Forecast, by Application 2019 & 2032
- Table 59: Rest of Asia Pacific Global Wind Power Market Revenue (Million) Forecast, by Application 2019 & 2032
- Table 60: Rest of Asia Pacific Global Wind Power Market Volume (Thousand) Forecast, by Application 2019 & 2032
- Table 61: Global Wind Power Market Revenue Million Forecast, by Country 2019 & 2032
- Table 62: Global Wind Power Market Volume Thousand Forecast, by Country 2019 & 2032
- Table 63: Brazil Global Wind Power Market Revenue (Million) Forecast, by Application 2019 & 2032
- Table 64: Brazil Global Wind Power Market Volume (Thousand) Forecast, by Application 2019 & 2032
- Table 65: Argentina Global Wind Power Market Revenue (Million) Forecast, by Application 2019 & 2032
- Table 66: Argentina Global Wind Power Market Volume (Thousand) Forecast, by Application 2019 & 2032
- Table 67: Peru Global Wind Power Market Revenue (Million) Forecast, by Application 2019 & 2032
- Table 68: Peru Global Wind Power Market Volume (Thousand) Forecast, by Application 2019 & 2032
- Table 69: Chile Global Wind Power Market Revenue (Million) Forecast, by Application 2019 & 2032
- Table 70: Chile Global Wind Power Market Volume (Thousand) Forecast, by Application 2019 & 2032
- Table 71: Colombia Global Wind Power Market Revenue (Million) Forecast, by Application 2019 & 2032
- Table 72: Colombia Global Wind Power Market Volume (Thousand) Forecast, by Application 2019 & 2032
- Table 73: Ecuador Global Wind Power Market Revenue (Million) Forecast, by Application 2019 & 2032
- Table 74: Ecuador Global Wind Power Market Volume (Thousand) Forecast, by Application 2019 & 2032
- Table 75: Venezuela Global Wind Power Market Revenue (Million) Forecast, by Application 2019 & 2032
- Table 76: Venezuela Global Wind Power Market Volume (Thousand) Forecast, by Application 2019 & 2032
- Table 77: Rest of South America Global Wind Power Market Revenue (Million) Forecast, by Application 2019 & 2032
- Table 78: Rest of South America Global Wind Power Market Volume (Thousand) Forecast, by Application 2019 & 2032
- Table 79: Global Wind Power Market Revenue Million Forecast, by Country 2019 & 2032
- Table 80: Global Wind Power Market Volume Thousand Forecast, by Country 2019 & 2032
- Table 81: United States Global Wind Power Market Revenue (Million) Forecast, by Application 2019 & 2032
- Table 82: United States Global Wind Power Market Volume (Thousand) Forecast, by Application 2019 & 2032
- Table 83: Canada Global Wind Power Market Revenue (Million) Forecast, by Application 2019 & 2032
- Table 84: Canada Global Wind Power Market Volume (Thousand) Forecast, by Application 2019 & 2032
- Table 85: Mexico Global Wind Power Market Revenue (Million) Forecast, by Application 2019 & 2032
- Table 86: Mexico Global Wind Power Market Volume (Thousand) Forecast, by Application 2019 & 2032
- Table 87: Global Wind Power Market Revenue Million Forecast, by Country 2019 & 2032
- Table 88: Global Wind Power Market Volume Thousand Forecast, by Country 2019 & 2032
- Table 89: United Arab Emirates Global Wind Power Market Revenue (Million) Forecast, by Application 2019 & 2032
- Table 90: United Arab Emirates Global Wind Power Market Volume (Thousand) Forecast, by Application 2019 & 2032
- Table 91: Saudi Arabia Global Wind Power Market Revenue (Million) Forecast, by Application 2019 & 2032
- Table 92: Saudi Arabia Global Wind Power Market Volume (Thousand) Forecast, by Application 2019 & 2032
- Table 93: South Africa Global Wind Power Market Revenue (Million) Forecast, by Application 2019 & 2032
- Table 94: South Africa Global Wind Power Market Volume (Thousand) Forecast, by Application 2019 & 2032
- Table 95: Rest of Middle East and Africa Global Wind Power Market Revenue (Million) Forecast, by Application 2019 & 2032
- Table 96: Rest of Middle East and Africa Global Wind Power Market Volume (Thousand) Forecast, by Application 2019 & 2032
- Table 97: Global Wind Power Market Revenue Million Forecast, by Location 2019 & 2032
- Table 98: Global Wind Power Market Volume Thousand Forecast, by Location 2019 & 2032
- Table 99: Global Wind Power Market Revenue Million Forecast, by Country 2019 & 2032
- Table 100: Global Wind Power Market Volume Thousand Forecast, by Country 2019 & 2032
- Table 101: United States Global Wind Power Market Revenue (Million) Forecast, by Application 2019 & 2032
- Table 102: United States Global Wind Power Market Volume (Thousand) Forecast, by Application 2019 & 2032
- Table 103: Canada Global Wind Power Market Revenue (Million) Forecast, by Application 2019 & 2032
- Table 104: Canada Global Wind Power Market Volume (Thousand) Forecast, by Application 2019 & 2032
- Table 105: Rest of North America Global Wind Power Market Revenue (Million) Forecast, by Application 2019 & 2032
- Table 106: Rest of North America Global Wind Power Market Volume (Thousand) Forecast, by Application 2019 & 2032
- Table 107: Global Wind Power Market Revenue Million Forecast, by Location 2019 & 2032
- Table 108: Global Wind Power Market Volume Thousand Forecast, by Location 2019 & 2032
- Table 109: Global Wind Power Market Revenue Million Forecast, by Country 2019 & 2032
- Table 110: Global Wind Power Market Volume Thousand Forecast, by Country 2019 & 2032
- Table 111: United Kingdom Global Wind Power Market Revenue (Million) Forecast, by Application 2019 & 2032
- Table 112: United Kingdom Global Wind Power Market Volume (Thousand) Forecast, by Application 2019 & 2032
- Table 113: France Global Wind Power Market Revenue (Million) Forecast, by Application 2019 & 2032
- Table 114: France Global Wind Power Market Volume (Thousand) Forecast, by Application 2019 & 2032
- Table 115: Norway Global Wind Power Market Revenue (Million) Forecast, by Application 2019 & 2032
- Table 116: Norway Global Wind Power Market Volume (Thousand) Forecast, by Application 2019 & 2032
- Table 117: Germany Global Wind Power Market Revenue (Million) Forecast, by Application 2019 & 2032
- Table 118: Germany Global Wind Power Market Volume (Thousand) Forecast, by Application 2019 & 2032
- Table 119: Spain Global Wind Power Market Revenue (Million) Forecast, by Application 2019 & 2032
- Table 120: Spain Global Wind Power Market Volume (Thousand) Forecast, by Application 2019 & 2032
- Table 121: Turkey Global Wind Power Market Revenue (Million) Forecast, by Application 2019 & 2032
- Table 122: Turkey Global Wind Power Market Volume (Thousand) Forecast, by Application 2019 & 2032
- Table 123: Russia Global Wind Power Market Revenue (Million) Forecast, by Application 2019 & 2032
- Table 124: Russia Global Wind Power Market Volume (Thousand) Forecast, by Application 2019 & 2032
- Table 125: NORDIC Global Wind Power Market Revenue (Million) Forecast, by Application 2019 & 2032
- Table 126: NORDIC Global Wind Power Market Volume (Thousand) Forecast, by Application 2019 & 2032
- Table 127: Rest of Europe Global Wind Power Market Revenue (Million) Forecast, by Application 2019 & 2032
- Table 128: Rest of Europe Global Wind Power Market Volume (Thousand) Forecast, by Application 2019 & 2032
- Table 129: Global Wind Power Market Revenue Million Forecast, by Location 2019 & 2032
- Table 130: Global Wind Power Market Volume Thousand Forecast, by Location 2019 & 2032
- Table 131: Global Wind Power Market Revenue Million Forecast, by Country 2019 & 2032
- Table 132: Global Wind Power Market Volume Thousand Forecast, by Country 2019 & 2032
- Table 133: China Global Wind Power Market Revenue (Million) Forecast, by Application 2019 & 2032
- Table 134: China Global Wind Power Market Volume (Thousand) Forecast, by Application 2019 & 2032
- Table 135: India Global Wind Power Market Revenue (Million) Forecast, by Application 2019 & 2032
- Table 136: India Global Wind Power Market Volume (Thousand) Forecast, by Application 2019 & 2032
- Table 137: Japan Global Wind Power Market Revenue (Million) Forecast, by Application 2019 & 2032
- Table 138: Japan Global Wind Power Market Volume (Thousand) Forecast, by Application 2019 & 2032
- Table 139: Malaysia Global Wind Power Market Revenue (Million) Forecast, by Application 2019 & 2032
- Table 140: Malaysia Global Wind Power Market Volume (Thousand) Forecast, by Application 2019 & 2032
- Table 141: Thailand Global Wind Power Market Revenue (Million) Forecast, by Application 2019 & 2032
- Table 142: Thailand Global Wind Power Market Volume (Thousand) Forecast, by Application 2019 & 2032
- Table 143: Indonesia Global Wind Power Market Revenue (Million) Forecast, by Application 2019 & 2032
- Table 144: Indonesia Global Wind Power Market Volume (Thousand) Forecast, by Application 2019 & 2032
- Table 145: Vietnam Global Wind Power Market Revenue (Million) Forecast, by Application 2019 & 2032
- Table 146: Vietnam Global Wind Power Market Volume (Thousand) Forecast, by Application 2019 & 2032
- Table 147: Global Wind Power Market Revenue Million Forecast, by Location 2019 & 2032
- Table 148: Global Wind Power Market Volume Thousand Forecast, by Location 2019 & 2032
- Table 149: Global Wind Power Market Revenue Million Forecast, by Country 2019 & 2032
- Table 150: Global Wind Power Market Volume Thousand Forecast, by Country 2019 & 2032
- Table 151: Global Wind Power Market Revenue Million Forecast, by Location 2019 & 2032
- Table 152: Global Wind Power Market Volume Thousand Forecast, by Location 2019 & 2032
- Table 153: Global Wind Power Market Revenue Million Forecast, by Country 2019 & 2032
- Table 154: Global Wind Power Market Volume Thousand Forecast, by Country 2019 & 2032
- Table 155: United Arab Emirates Global Wind Power Market Revenue (Million) Forecast, by Application 2019 & 2032
- Table 156: United Arab Emirates Global Wind Power Market Volume (Thousand) Forecast, by Application 2019 & 2032
- Table 157: Egypt Global Wind Power Market Revenue (Million) Forecast, by Application 2019 & 2032
- Table 158: Egypt Global Wind Power Market Volume (Thousand) Forecast, by Application 2019 & 2032
- Table 159: Saudi Arabia Global Wind Power Market Revenue (Million) Forecast, by Application 2019 & 2032
- Table 160: Saudi Arabia Global Wind Power Market Volume (Thousand) Forecast, by Application 2019 & 2032
- Table 161: Nigeria Global Wind Power Market Revenue (Million) Forecast, by Application 2019 & 2032
- Table 162: Nigeria Global Wind Power Market Volume (Thousand) Forecast, by Application 2019 & 2032
- Table 163: Qatar Global Wind Power Market Revenue (Million) Forecast, by Application 2019 & 2032
- Table 164: Qatar Global Wind Power Market Volume (Thousand) Forecast, by Application 2019 & 2032
- Table 165: Global Wind Power Market Revenue Million Forecast, by Location 2019 & 2032
- Table 166: Global Wind Power Market Volume Thousand Forecast, by Location 2019 & 2032
- Table 167: Global Wind Power Market Revenue Million Forecast, by Country 2019 & 2032
- Table 168: Global Wind Power Market Volume Thousand Forecast, by Country 2019 & 2032
- Table 169: Global Wind Power Market Revenue Million Forecast, by Location 2019 & 2032
- Table 170: Global Wind Power Market Volume Thousand Forecast, by Location 2019 & 2032
- Table 171: Global Wind Power Market Revenue Million Forecast, by Country 2019 & 2032
- Table 172: Global Wind Power Market Volume Thousand Forecast, by Country 2019 & 2032
- Table 173: Brazil Global Wind Power Market Revenue (Million) Forecast, by Application 2019 & 2032
- Table 174: Brazil Global Wind Power Market Volume (Thousand) Forecast, by Application 2019 & 2032
- Table 175: Chile Global Wind Power Market Revenue (Million) Forecast, by Application 2019 & 2032
- Table 176: Chile Global Wind Power Market Volume (Thousand) Forecast, by Application 2019 & 2032
- Table 177: Argentina Global Wind Power Market Revenue (Million) Forecast, by Application 2019 & 2032
- Table 178: Argentina Global Wind Power Market Volume (Thousand) Forecast, by Application 2019 & 2032
- Table 179: Colombia Global Wind Power Market Revenue (Million) Forecast, by Application 2019 & 2032
- Table 180: Colombia Global Wind Power Market Volume (Thousand) Forecast, by Application 2019 & 2032
- Table 181: Rest of South America Global Wind Power Market Revenue (Million) Forecast, by Application 2019 & 2032
- Table 182: Rest of South America Global Wind Power Market Volume (Thousand) Forecast, by Application 2019 & 2032
Frequently Asked Questions
1. What is the projected Compound Annual Growth Rate (CAGR) of the Global Wind Power Market?
The projected CAGR is approximately 27.87%.
2. Which companies are prominent players in the Global Wind Power Market?
Key companies in the market include 5 Siemens Gamesa Renewable Energy SA, 6 Suzlon Energy Limited, 7 Vestas Wind Systems AS, Equipment Suppliers, 2 Duke Energy Corporation, 6 E ON SE, 5 NextEra Energy Inc, 4 Xinjiang Goldwind Science & Technology Co Ltd (Goldwind), 2 Envision Energy, 4 Orsted AS, Wind Farm Operators, 3 EDF SA, 8 Dongfang Electric Corporation*List Not Exhaustive 6 5 Market Share/Ranking Analysi, 3 General Electric Company, 1 Aerodyn Energiesysteme GmbH, 1 Acciona Energia SA.
3. What are the main segments of the Global Wind Power Market?
The market segments include Location.
4. Can you provide details about the market size?
The market size is estimated to be USD XX Million as of 2022.
5. What are some drivers contributing to market growth?
4.; Increasing Investments in Offshore Wind Power Projects4.; Supportive Government Policies.
6. What are the notable trends driving market growth?
The Offshore Wind Power Sector is Expected to Witness Significant Growth.
7. Are there any restraints impacting market growth?
4.; Increasing Adopting of Alternative Clean Energy Sources (Ex: Solar. Hydro).
8. Can you provide examples of recent developments in the market?
April 2024: Mahindra Group, a conglomerate that spans technology to tractor manufacture, announced an investment of INR 12 billion (USD 144 million) in the establishment of solar and wind energy projects. The renewable projects are likely to be developed by Mahindra Susten, the group's renewable, with a hybrid capacity of 150 megawatts (MW).
9. What pricing options are available for accessing the report?
Pricing options include single-user, multi-user, and enterprise licenses priced at USD 4750, USD 5250, and USD 8750 respectively.
10. Is the market size provided in terms of value or volume?
The market size is provided in terms of value, measured in Million and volume, measured in Thousand.
11. Are there any specific market keywords associated with the report?
Yes, the market keyword associated with the report is "Global Wind Power Market," which aids in identifying and referencing the specific market segment covered.
12. How do I determine which pricing option suits my needs best?
The pricing options vary based on user requirements and access needs. Individual users may opt for single-user licenses, while businesses requiring broader access may choose multi-user or enterprise licenses for cost-effective access to the report.
13. Are there any additional resources or data provided in the Global Wind Power Market report?
While the report offers comprehensive insights, it's advisable to review the specific contents or supplementary materials provided to ascertain if additional resources or data are available.
14. How can I stay updated on further developments or reports in the Global Wind Power Market?
To stay informed about further developments, trends, and reports in the Global Wind Power Market, consider subscribing to industry newsletters, following relevant companies and organizations, or regularly checking reputable industry news sources and publications.
Methodology
Step 1 - Identification of Relevant Samples Size from Population Database


Step 2 - Approaches for Defining Global Market Size (Value, Volume* & Price*)

Note*: In applicable scenarios
Step 3 - Data Sources
Primary Research
- Web Analytics
- Survey Reports
- Research Institute
- Latest Research Reports
- Opinion Leaders
Secondary Research
- Annual Reports
- White Paper
- Latest Press Release
- Industry Association
- Paid Database
- Investor Presentations

Step 4 - Data Triangulation
Involves using different sources of information in order to increase the validity of a study
These sources are likely to be stakeholders in a program - participants, other researchers, program staff, other community members, and so on.
Then we put all data in single framework & apply various statistical tools to find out the dynamic on the market.
During the analysis stage, feedback from the stakeholder groups would be compared to determine areas of agreement as well as areas of divergence


