
Key Insights
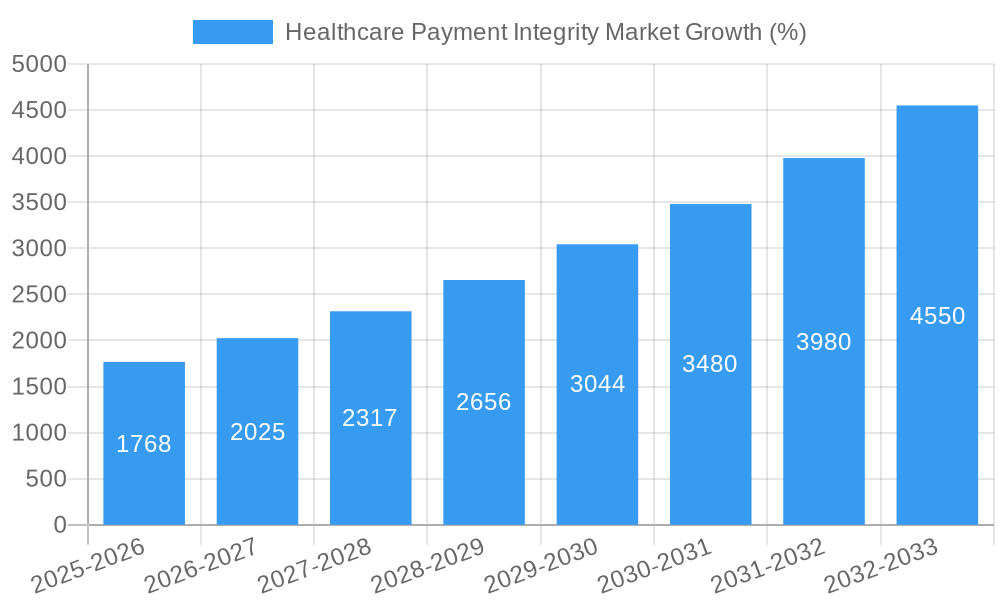
The Healthcare Payment Integrity market is experiencing robust growth, projected to reach $13.36 billion in 2025 and maintain a Compound Annual Growth Rate (CAGR) of 13.14% from 2025 to 2033. This expansion is driven by several key factors. Increasing healthcare expenditures globally necessitate stringent measures to prevent fraud, waste, and abuse within payment systems. The rising adoption of advanced analytics and artificial intelligence (AI) technologies enables more efficient detection of anomalies and improper billing practices, further fueling market growth. Furthermore, government regulations aimed at improving healthcare transparency and accountability are compelling healthcare providers and payers to invest heavily in payment integrity solutions. The increasing prevalence of data breaches and the need for robust cybersecurity measures also contribute to market expansion. This market is segmented by solution type (e.g., fraud detection, claims auditing, provider screening), deployment mode (cloud-based, on-premise), and end-user (payers, providers). Leading players, such as Alivia Analytics LLC, Apixio, and Conduent Inc., are driving innovation through the development of sophisticated software and services.
The competitive landscape is marked by a mix of established players and emerging technology companies. The market's future growth trajectory is influenced by several factors. Continued advancements in AI and machine learning will lead to more accurate and efficient fraud detection. However, the high cost of implementation and maintenance of these advanced technologies, coupled with the complexity of integrating these solutions into existing healthcare IT infrastructure, presents challenges. Data privacy regulations and concerns about data security also pose potential restraints. The ongoing shift towards value-based care models may necessitate further refinement of payment integrity solutions to accommodate the nuances of these reimbursement structures. Despite these challenges, the market is poised for sustained growth, driven by the inherent need for efficient and transparent healthcare payment systems.

Healthcare Payment Integrity Market Report: 2019-2033
This comprehensive report provides an in-depth analysis of the Healthcare Payment Integrity Market, offering invaluable insights for industry professionals, investors, and strategic decision-makers. Covering the period from 2019 to 2033 (Study Period), with a base year of 2025 and a forecast period of 2025-2033, this report illuminates market dynamics, key players, and future trends. The report utilizes data from the historical period (2019-2024) and includes detailed market sizing and growth projections in Millions.
Healthcare Payment Integrity Market Structure & Innovation Trends
The Healthcare Payment Integrity Market is characterized by a moderately concentrated landscape, with several major players holding significant market share. However, the market also exhibits a high degree of innovation, driven by advancements in artificial intelligence (AI), machine learning (ML), and big data analytics. Regulatory frameworks, such as HIPAA in the US and GDPR in Europe, play a crucial role in shaping market practices and influencing the adoption of new technologies. The market witnesses continuous product substitution as newer, more sophisticated solutions emerge, replacing older, less efficient methods. The end-user demographics primarily comprise healthcare payers (both commercial and governmental), healthcare providers, and government agencies. Mergers and acquisitions (M&A) are frequent, with deal values ranging from tens to hundreds of Millions, reflecting the consolidation trend within the sector.
- Market Concentration: Moderately concentrated, with top 5 players holding an estimated xx% market share in 2025.
- Innovation Drivers: AI, ML, Big Data analytics, cloud computing.
- Regulatory Frameworks: HIPAA, GDPR, other regional regulations.
- M&A Activity: Significant M&A activity observed, with deal values averaging xx Million in 2024. Examples include Alivia Analytics' acquisition of SourcEdge.
Healthcare Payment Integrity Market Dynamics & Trends
The Healthcare Payment Integrity Market is experiencing robust growth, driven by several key factors. The increasing prevalence of healthcare fraud, waste, and abuse (FWA) is a major catalyst, pushing payers to invest heavily in advanced detection and prevention technologies. Technological disruptions, such as the rise of AI-powered solutions, are revolutionizing how FWA is identified and managed. Consumer preferences are shifting towards greater transparency and accountability in healthcare payments. Intense competitive dynamics, with companies vying for market share through innovation and strategic partnerships, are further shaping the market landscape. The CAGR for the forecast period (2025-2033) is estimated at xx%, with market penetration expected to reach xx% by 2033.
Dominant Regions & Segments in Healthcare Payment Integrity Market
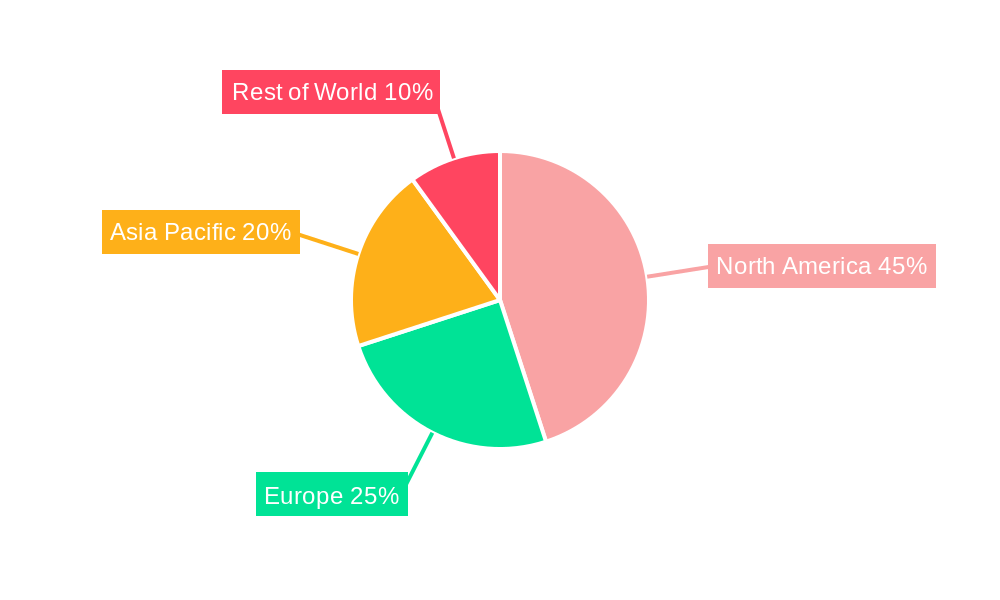
The North American region currently dominates the Healthcare Payment Integrity Market, driven by factors such as high healthcare expenditure, stringent regulatory requirements, and the early adoption of advanced technologies. Within North America, the United States holds the largest market share. Key drivers include:
- Strong Regulatory Environment: Stringent regulations promoting the adoption of payment integrity solutions.
- High Healthcare Expenditure: High spending necessitates robust payment integrity measures.
- Technological Advancement: Early adoption of AI, ML, and big data analytics.
The dominance of North America is expected to continue throughout the forecast period, albeit with growing contributions from other regions like Europe and Asia-Pacific. Specific segments within the market, such as claims processing and provider screening, are showing accelerated growth rates, outpacing the overall market average.
Healthcare Payment Integrity Market Product Innovations
Recent product innovations focus on leveraging AI and ML to improve the accuracy and efficiency of FWA detection. New solutions offer real-time fraud detection, predictive analytics for identifying high-risk claims, and automated workflows to streamline investigations. These innovations enhance the speed and effectiveness of payment integrity processes, providing a competitive advantage to companies that adopt them. The market is moving towards integrated, end-to-end solutions that combine multiple functionalities within a single platform.
Report Scope & Segmentation Analysis
This report segments the Healthcare Payment Integrity Market based on several factors: by solution (claims auditing, provider screening, etc.), by deployment (cloud, on-premise), by end-user (payers, providers, government agencies), and by geography (North America, Europe, Asia Pacific, etc.). Each segment's growth trajectory, market size, and competitive landscape are analyzed individually, providing a granular understanding of the market's structure. Detailed growth projections are included for each segment.
Key Drivers of Healthcare Payment Integrity Market Growth
Several factors are driving the growth of this market: increasing healthcare costs, rising fraud rates, stringent government regulations, and advancements in analytics technologies. The need to optimize healthcare spending and improve the efficiency of payment systems fuels the demand for sophisticated payment integrity solutions.
Challenges in the Healthcare Payment Integrity Market Sector
Challenges include the high cost of implementation, the complexity of integrating new technologies with existing systems, and the evolving nature of fraud schemes. Data security and privacy concerns, as well as regulatory compliance requirements, also pose significant hurdles. These challenges impact market penetration and the adoption of new solutions. The average implementation cost for a mid-sized payer is estimated at xx Million.
Emerging Opportunities in Healthcare Payment Integrity Market
Emerging opportunities lie in the expansion of AI and ML applications, the development of blockchain-based solutions for enhanced data security, and the integration of payment integrity with other healthcare IT systems. New market segments, such as telehealth and value-based care, are also creating new opportunities for payment integrity solutions.
Leading Players in the Healthcare Payment Integrity Market Market
- Alivia Analytics LLC
- Apixio
- Codoxo
- Conduent Inc
- Cotiviti Inc
- ExlService Holdings Inc
- Gainwell Technologies LLC
- NTT DATA Inc
- Integrity Advantage
- SAS Institute Inc
- List Not Exhaustive
Key Developments in Healthcare Payment Integrity Market Industry
- February 2024: Alivia Analytics acquired SourcEdge, significantly expanding its capabilities in claims system modernization and FWA detection.
- January 2024: Healthcare Fraud Shield (HCFS) launched FWA360Leads, a groundbreaking new product designed to revolutionize FWA detection and management.
Future Outlook for Healthcare Payment Integrity Market Market
The future of the Healthcare Payment Integrity Market is bright, driven by continued advancements in technology and the persistent need to combat fraud, waste, and abuse. The market is poised for sustained growth, with significant opportunities for companies that can develop innovative, cost-effective, and scalable solutions. Strategic partnerships and acquisitions will likely continue to shape the competitive landscape.
Healthcare Payment Integrity Market Segmentation
-
1. Solution Type
- 1.1. Fraud Detection
- 1.2. Claims Analytics
- 1.3. Payment Accuracy
- 1.4. Others
-
2. Deployment Model
- 2.1. On-Premises
- 2.2. Cloud-Based
-
3. End User
- 3.1. Healthcare Payers
- 3.2. Healthcare Providers
- 3.3. Government Agencies
Healthcare Payment Integrity Market Segmentation By Geography
-
1. North America
- 1.1. United States
- 1.2. Canada
- 1.3. Mexico
-
2. Europe
- 2.1. Germany
- 2.2. United Kingdom
- 2.3. France
- 2.4. Italy
- 2.5. Spain
- 2.6. Rest of Europe
-
3. Asia Pacific
- 3.1. China
- 3.2. Japan
- 3.3. India
- 3.4. Australia
- 3.5. South Korea
- 3.6. Rest of Asia Pacific
-
4. Middle East and Africa
- 4.1. GCC
- 4.2. South Africa
- 4.3. Rest of Middle East and Africa
-
5. South America
- 5.1. Brazil
- 5.2. Argentina
- 5.3. Rest of South America
Healthcare Payment Integrity Market REPORT HIGHLIGHTS
| Aspects | Details |
|---|---|
| Study Period | 2019-2033 |
| Base Year | 2024 |
| Estimated Year | 2025 |
| Forecast Period | 2025-2033 |
| Historical Period | 2019-2024 |
| Growth Rate | CAGR of 13.14% from 2019-2033 |
| Segmentation |
|
Table of Contents
- 1. Introduction
- 1.1. Research Scope
- 1.2. Market Segmentation
- 1.3. Research Methodology
- 1.4. Definitions and Assumptions
- 2. Executive Summary
- 2.1. Introduction
- 3. Market Dynamics
- 3.1. Introduction
- 3.2. Market Drivers
- 3.2.1. Regulatory Changes and Compliance; Innovations in Payment Integrity; Rising Focus on Fraud Prevention
- 3.3. Market Restrains
- 3.3.1. Regulatory Changes and Compliance; Innovations in Payment Integrity; Rising Focus on Fraud Prevention
- 3.4. Market Trends
- 3.4.1. The Fraud Detection Segment is Expected to Witness Significant Growth Over the Forecast Period
- 4. Market Factor Analysis
- 4.1. Porters Five Forces
- 4.2. Supply/Value Chain
- 4.3. PESTEL analysis
- 4.4. Market Entropy
- 4.5. Patent/Trademark Analysis
- 5. Global Healthcare Payment Integrity Market Analysis, Insights and Forecast, 2019-2031
- 5.1. Market Analysis, Insights and Forecast - by Solution Type
- 5.1.1. Fraud Detection
- 5.1.2. Claims Analytics
- 5.1.3. Payment Accuracy
- 5.1.4. Others
- 5.2. Market Analysis, Insights and Forecast - by Deployment Model
- 5.2.1. On-Premises
- 5.2.2. Cloud-Based
- 5.3. Market Analysis, Insights and Forecast - by End User
- 5.3.1. Healthcare Payers
- 5.3.2. Healthcare Providers
- 5.3.3. Government Agencies
- 5.4. Market Analysis, Insights and Forecast - by Region
- 5.4.1. North America
- 5.4.2. Europe
- 5.4.3. Asia Pacific
- 5.4.4. Middle East and Africa
- 5.4.5. South America
- 5.1. Market Analysis, Insights and Forecast - by Solution Type
- 6. North America Healthcare Payment Integrity Market Analysis, Insights and Forecast, 2019-2031
- 6.1. Market Analysis, Insights and Forecast - by Solution Type
- 6.1.1. Fraud Detection
- 6.1.2. Claims Analytics
- 6.1.3. Payment Accuracy
- 6.1.4. Others
- 6.2. Market Analysis, Insights and Forecast - by Deployment Model
- 6.2.1. On-Premises
- 6.2.2. Cloud-Based
- 6.3. Market Analysis, Insights and Forecast - by End User
- 6.3.1. Healthcare Payers
- 6.3.2. Healthcare Providers
- 6.3.3. Government Agencies
- 6.1. Market Analysis, Insights and Forecast - by Solution Type
- 7. Europe Healthcare Payment Integrity Market Analysis, Insights and Forecast, 2019-2031
- 7.1. Market Analysis, Insights and Forecast - by Solution Type
- 7.1.1. Fraud Detection
- 7.1.2. Claims Analytics
- 7.1.3. Payment Accuracy
- 7.1.4. Others
- 7.2. Market Analysis, Insights and Forecast - by Deployment Model
- 7.2.1. On-Premises
- 7.2.2. Cloud-Based
- 7.3. Market Analysis, Insights and Forecast - by End User
- 7.3.1. Healthcare Payers
- 7.3.2. Healthcare Providers
- 7.3.3. Government Agencies
- 7.1. Market Analysis, Insights and Forecast - by Solution Type
- 8. Asia Pacific Healthcare Payment Integrity Market Analysis, Insights and Forecast, 2019-2031
- 8.1. Market Analysis, Insights and Forecast - by Solution Type
- 8.1.1. Fraud Detection
- 8.1.2. Claims Analytics
- 8.1.3. Payment Accuracy
- 8.1.4. Others
- 8.2. Market Analysis, Insights and Forecast - by Deployment Model
- 8.2.1. On-Premises
- 8.2.2. Cloud-Based
- 8.3. Market Analysis, Insights and Forecast - by End User
- 8.3.1. Healthcare Payers
- 8.3.2. Healthcare Providers
- 8.3.3. Government Agencies
- 8.1. Market Analysis, Insights and Forecast - by Solution Type
- 9. Middle East and Africa Healthcare Payment Integrity Market Analysis, Insights and Forecast, 2019-2031
- 9.1. Market Analysis, Insights and Forecast - by Solution Type
- 9.1.1. Fraud Detection
- 9.1.2. Claims Analytics
- 9.1.3. Payment Accuracy
- 9.1.4. Others
- 9.2. Market Analysis, Insights and Forecast - by Deployment Model
- 9.2.1. On-Premises
- 9.2.2. Cloud-Based
- 9.3. Market Analysis, Insights and Forecast - by End User
- 9.3.1. Healthcare Payers
- 9.3.2. Healthcare Providers
- 9.3.3. Government Agencies
- 9.1. Market Analysis, Insights and Forecast - by Solution Type
- 10. South America Healthcare Payment Integrity Market Analysis, Insights and Forecast, 2019-2031
- 10.1. Market Analysis, Insights and Forecast - by Solution Type
- 10.1.1. Fraud Detection
- 10.1.2. Claims Analytics
- 10.1.3. Payment Accuracy
- 10.1.4. Others
- 10.2. Market Analysis, Insights and Forecast - by Deployment Model
- 10.2.1. On-Premises
- 10.2.2. Cloud-Based
- 10.3. Market Analysis, Insights and Forecast - by End User
- 10.3.1. Healthcare Payers
- 10.3.2. Healthcare Providers
- 10.3.3. Government Agencies
- 10.1. Market Analysis, Insights and Forecast - by Solution Type
- 11. Competitive Analysis
- 11.1. Global Market Share Analysis 2024
- 11.2. Company Profiles
- 11.2.1 Alivia Analytics LLC
- 11.2.1.1. Overview
- 11.2.1.2. Products
- 11.2.1.3. SWOT Analysis
- 11.2.1.4. Recent Developments
- 11.2.1.5. Financials (Based on Availability)
- 11.2.2 Apixio
- 11.2.2.1. Overview
- 11.2.2.2. Products
- 11.2.2.3. SWOT Analysis
- 11.2.2.4. Recent Developments
- 11.2.2.5. Financials (Based on Availability)
- 11.2.3 Codoxo
- 11.2.3.1. Overview
- 11.2.3.2. Products
- 11.2.3.3. SWOT Analysis
- 11.2.3.4. Recent Developments
- 11.2.3.5. Financials (Based on Availability)
- 11.2.4 Conduent Inc
- 11.2.4.1. Overview
- 11.2.4.2. Products
- 11.2.4.3. SWOT Analysis
- 11.2.4.4. Recent Developments
- 11.2.4.5. Financials (Based on Availability)
- 11.2.5 Cotiviti Inc
- 11.2.5.1. Overview
- 11.2.5.2. Products
- 11.2.5.3. SWOT Analysis
- 11.2.5.4. Recent Developments
- 11.2.5.5. Financials (Based on Availability)
- 11.2.6 ExlService Holdings Inc
- 11.2.6.1. Overview
- 11.2.6.2. Products
- 11.2.6.3. SWOT Analysis
- 11.2.6.4. Recent Developments
- 11.2.6.5. Financials (Based on Availability)
- 11.2.7 Gainwell Technologies LLC
- 11.2.7.1. Overview
- 11.2.7.2. Products
- 11.2.7.3. SWOT Analysis
- 11.2.7.4. Recent Developments
- 11.2.7.5. Financials (Based on Availability)
- 11.2.8 NTT DATA Inc
- 11.2.8.1. Overview
- 11.2.8.2. Products
- 11.2.8.3. SWOT Analysis
- 11.2.8.4. Recent Developments
- 11.2.8.5. Financials (Based on Availability)
- 11.2.9 Integrity Advantage
- 11.2.9.1. Overview
- 11.2.9.2. Products
- 11.2.9.3. SWOT Analysis
- 11.2.9.4. Recent Developments
- 11.2.9.5. Financials (Based on Availability)
- 11.2.10 SAS Institute Inc *List Not Exhaustive
- 11.2.10.1. Overview
- 11.2.10.2. Products
- 11.2.10.3. SWOT Analysis
- 11.2.10.4. Recent Developments
- 11.2.10.5. Financials (Based on Availability)
- 11.2.1 Alivia Analytics LLC
List of Figures
- Figure 1: Global Healthcare Payment Integrity Market Revenue Breakdown (Million, %) by Region 2024 & 2032
- Figure 2: Global Healthcare Payment Integrity Market Volume Breakdown (Billion, %) by Region 2024 & 2032
- Figure 3: North America Healthcare Payment Integrity Market Revenue (Million), by Solution Type 2024 & 2032
- Figure 4: North America Healthcare Payment Integrity Market Volume (Billion), by Solution Type 2024 & 2032
- Figure 5: North America Healthcare Payment Integrity Market Revenue Share (%), by Solution Type 2024 & 2032
- Figure 6: North America Healthcare Payment Integrity Market Volume Share (%), by Solution Type 2024 & 2032
- Figure 7: North America Healthcare Payment Integrity Market Revenue (Million), by Deployment Model 2024 & 2032
- Figure 8: North America Healthcare Payment Integrity Market Volume (Billion), by Deployment Model 2024 & 2032
- Figure 9: North America Healthcare Payment Integrity Market Revenue Share (%), by Deployment Model 2024 & 2032
- Figure 10: North America Healthcare Payment Integrity Market Volume Share (%), by Deployment Model 2024 & 2032
- Figure 11: North America Healthcare Payment Integrity Market Revenue (Million), by End User 2024 & 2032
- Figure 12: North America Healthcare Payment Integrity Market Volume (Billion), by End User 2024 & 2032
- Figure 13: North America Healthcare Payment Integrity Market Revenue Share (%), by End User 2024 & 2032
- Figure 14: North America Healthcare Payment Integrity Market Volume Share (%), by End User 2024 & 2032
- Figure 15: North America Healthcare Payment Integrity Market Revenue (Million), by Country 2024 & 2032
- Figure 16: North America Healthcare Payment Integrity Market Volume (Billion), by Country 2024 & 2032
- Figure 17: North America Healthcare Payment Integrity Market Revenue Share (%), by Country 2024 & 2032
- Figure 18: North America Healthcare Payment Integrity Market Volume Share (%), by Country 2024 & 2032
- Figure 19: Europe Healthcare Payment Integrity Market Revenue (Million), by Solution Type 2024 & 2032
- Figure 20: Europe Healthcare Payment Integrity Market Volume (Billion), by Solution Type 2024 & 2032
- Figure 21: Europe Healthcare Payment Integrity Market Revenue Share (%), by Solution Type 2024 & 2032
- Figure 22: Europe Healthcare Payment Integrity Market Volume Share (%), by Solution Type 2024 & 2032
- Figure 23: Europe Healthcare Payment Integrity Market Revenue (Million), by Deployment Model 2024 & 2032
- Figure 24: Europe Healthcare Payment Integrity Market Volume (Billion), by Deployment Model 2024 & 2032
- Figure 25: Europe Healthcare Payment Integrity Market Revenue Share (%), by Deployment Model 2024 & 2032
- Figure 26: Europe Healthcare Payment Integrity Market Volume Share (%), by Deployment Model 2024 & 2032
- Figure 27: Europe Healthcare Payment Integrity Market Revenue (Million), by End User 2024 & 2032
- Figure 28: Europe Healthcare Payment Integrity Market Volume (Billion), by End User 2024 & 2032
- Figure 29: Europe Healthcare Payment Integrity Market Revenue Share (%), by End User 2024 & 2032
- Figure 30: Europe Healthcare Payment Integrity Market Volume Share (%), by End User 2024 & 2032
- Figure 31: Europe Healthcare Payment Integrity Market Revenue (Million), by Country 2024 & 2032
- Figure 32: Europe Healthcare Payment Integrity Market Volume (Billion), by Country 2024 & 2032
- Figure 33: Europe Healthcare Payment Integrity Market Revenue Share (%), by Country 2024 & 2032
- Figure 34: Europe Healthcare Payment Integrity Market Volume Share (%), by Country 2024 & 2032
- Figure 35: Asia Pacific Healthcare Payment Integrity Market Revenue (Million), by Solution Type 2024 & 2032
- Figure 36: Asia Pacific Healthcare Payment Integrity Market Volume (Billion), by Solution Type 2024 & 2032
- Figure 37: Asia Pacific Healthcare Payment Integrity Market Revenue Share (%), by Solution Type 2024 & 2032
- Figure 38: Asia Pacific Healthcare Payment Integrity Market Volume Share (%), by Solution Type 2024 & 2032
- Figure 39: Asia Pacific Healthcare Payment Integrity Market Revenue (Million), by Deployment Model 2024 & 2032
- Figure 40: Asia Pacific Healthcare Payment Integrity Market Volume (Billion), by Deployment Model 2024 & 2032
- Figure 41: Asia Pacific Healthcare Payment Integrity Market Revenue Share (%), by Deployment Model 2024 & 2032
- Figure 42: Asia Pacific Healthcare Payment Integrity Market Volume Share (%), by Deployment Model 2024 & 2032
- Figure 43: Asia Pacific Healthcare Payment Integrity Market Revenue (Million), by End User 2024 & 2032
- Figure 44: Asia Pacific Healthcare Payment Integrity Market Volume (Billion), by End User 2024 & 2032
- Figure 45: Asia Pacific Healthcare Payment Integrity Market Revenue Share (%), by End User 2024 & 2032
- Figure 46: Asia Pacific Healthcare Payment Integrity Market Volume Share (%), by End User 2024 & 2032
- Figure 47: Asia Pacific Healthcare Payment Integrity Market Revenue (Million), by Country 2024 & 2032
- Figure 48: Asia Pacific Healthcare Payment Integrity Market Volume (Billion), by Country 2024 & 2032
- Figure 49: Asia Pacific Healthcare Payment Integrity Market Revenue Share (%), by Country 2024 & 2032
- Figure 50: Asia Pacific Healthcare Payment Integrity Market Volume Share (%), by Country 2024 & 2032
- Figure 51: Middle East and Africa Healthcare Payment Integrity Market Revenue (Million), by Solution Type 2024 & 2032
- Figure 52: Middle East and Africa Healthcare Payment Integrity Market Volume (Billion), by Solution Type 2024 & 2032
- Figure 53: Middle East and Africa Healthcare Payment Integrity Market Revenue Share (%), by Solution Type 2024 & 2032
- Figure 54: Middle East and Africa Healthcare Payment Integrity Market Volume Share (%), by Solution Type 2024 & 2032
- Figure 55: Middle East and Africa Healthcare Payment Integrity Market Revenue (Million), by Deployment Model 2024 & 2032
- Figure 56: Middle East and Africa Healthcare Payment Integrity Market Volume (Billion), by Deployment Model 2024 & 2032
- Figure 57: Middle East and Africa Healthcare Payment Integrity Market Revenue Share (%), by Deployment Model 2024 & 2032
- Figure 58: Middle East and Africa Healthcare Payment Integrity Market Volume Share (%), by Deployment Model 2024 & 2032
- Figure 59: Middle East and Africa Healthcare Payment Integrity Market Revenue (Million), by End User 2024 & 2032
- Figure 60: Middle East and Africa Healthcare Payment Integrity Market Volume (Billion), by End User 2024 & 2032
- Figure 61: Middle East and Africa Healthcare Payment Integrity Market Revenue Share (%), by End User 2024 & 2032
- Figure 62: Middle East and Africa Healthcare Payment Integrity Market Volume Share (%), by End User 2024 & 2032
- Figure 63: Middle East and Africa Healthcare Payment Integrity Market Revenue (Million), by Country 2024 & 2032
- Figure 64: Middle East and Africa Healthcare Payment Integrity Market Volume (Billion), by Country 2024 & 2032
- Figure 65: Middle East and Africa Healthcare Payment Integrity Market Revenue Share (%), by Country 2024 & 2032
- Figure 66: Middle East and Africa Healthcare Payment Integrity Market Volume Share (%), by Country 2024 & 2032
- Figure 67: South America Healthcare Payment Integrity Market Revenue (Million), by Solution Type 2024 & 2032
- Figure 68: South America Healthcare Payment Integrity Market Volume (Billion), by Solution Type 2024 & 2032
- Figure 69: South America Healthcare Payment Integrity Market Revenue Share (%), by Solution Type 2024 & 2032
- Figure 70: South America Healthcare Payment Integrity Market Volume Share (%), by Solution Type 2024 & 2032
- Figure 71: South America Healthcare Payment Integrity Market Revenue (Million), by Deployment Model 2024 & 2032
- Figure 72: South America Healthcare Payment Integrity Market Volume (Billion), by Deployment Model 2024 & 2032
- Figure 73: South America Healthcare Payment Integrity Market Revenue Share (%), by Deployment Model 2024 & 2032
- Figure 74: South America Healthcare Payment Integrity Market Volume Share (%), by Deployment Model 2024 & 2032
- Figure 75: South America Healthcare Payment Integrity Market Revenue (Million), by End User 2024 & 2032
- Figure 76: South America Healthcare Payment Integrity Market Volume (Billion), by End User 2024 & 2032
- Figure 77: South America Healthcare Payment Integrity Market Revenue Share (%), by End User 2024 & 2032
- Figure 78: South America Healthcare Payment Integrity Market Volume Share (%), by End User 2024 & 2032
- Figure 79: South America Healthcare Payment Integrity Market Revenue (Million), by Country 2024 & 2032
- Figure 80: South America Healthcare Payment Integrity Market Volume (Billion), by Country 2024 & 2032
- Figure 81: South America Healthcare Payment Integrity Market Revenue Share (%), by Country 2024 & 2032
- Figure 82: South America Healthcare Payment Integrity Market Volume Share (%), by Country 2024 & 2032
List of Tables
- Table 1: Global Healthcare Payment Integrity Market Revenue Million Forecast, by Region 2019 & 2032
- Table 2: Global Healthcare Payment Integrity Market Volume Billion Forecast, by Region 2019 & 2032
- Table 3: Global Healthcare Payment Integrity Market Revenue Million Forecast, by Solution Type 2019 & 2032
- Table 4: Global Healthcare Payment Integrity Market Volume Billion Forecast, by Solution Type 2019 & 2032
- Table 5: Global Healthcare Payment Integrity Market Revenue Million Forecast, by Deployment Model 2019 & 2032
- Table 6: Global Healthcare Payment Integrity Market Volume Billion Forecast, by Deployment Model 2019 & 2032
- Table 7: Global Healthcare Payment Integrity Market Revenue Million Forecast, by End User 2019 & 2032
- Table 8: Global Healthcare Payment Integrity Market Volume Billion Forecast, by End User 2019 & 2032
- Table 9: Global Healthcare Payment Integrity Market Revenue Million Forecast, by Region 2019 & 2032
- Table 10: Global Healthcare Payment Integrity Market Volume Billion Forecast, by Region 2019 & 2032
- Table 11: Global Healthcare Payment Integrity Market Revenue Million Forecast, by Solution Type 2019 & 2032
- Table 12: Global Healthcare Payment Integrity Market Volume Billion Forecast, by Solution Type 2019 & 2032
- Table 13: Global Healthcare Payment Integrity Market Revenue Million Forecast, by Deployment Model 2019 & 2032
- Table 14: Global Healthcare Payment Integrity Market Volume Billion Forecast, by Deployment Model 2019 & 2032
- Table 15: Global Healthcare Payment Integrity Market Revenue Million Forecast, by End User 2019 & 2032
- Table 16: Global Healthcare Payment Integrity Market Volume Billion Forecast, by End User 2019 & 2032
- Table 17: Global Healthcare Payment Integrity Market Revenue Million Forecast, by Country 2019 & 2032
- Table 18: Global Healthcare Payment Integrity Market Volume Billion Forecast, by Country 2019 & 2032
- Table 19: United States Healthcare Payment Integrity Market Revenue (Million) Forecast, by Application 2019 & 2032
- Table 20: United States Healthcare Payment Integrity Market Volume (Billion) Forecast, by Application 2019 & 2032
- Table 21: Canada Healthcare Payment Integrity Market Revenue (Million) Forecast, by Application 2019 & 2032
- Table 22: Canada Healthcare Payment Integrity Market Volume (Billion) Forecast, by Application 2019 & 2032
- Table 23: Mexico Healthcare Payment Integrity Market Revenue (Million) Forecast, by Application 2019 & 2032
- Table 24: Mexico Healthcare Payment Integrity Market Volume (Billion) Forecast, by Application 2019 & 2032
- Table 25: Global Healthcare Payment Integrity Market Revenue Million Forecast, by Solution Type 2019 & 2032
- Table 26: Global Healthcare Payment Integrity Market Volume Billion Forecast, by Solution Type 2019 & 2032
- Table 27: Global Healthcare Payment Integrity Market Revenue Million Forecast, by Deployment Model 2019 & 2032
- Table 28: Global Healthcare Payment Integrity Market Volume Billion Forecast, by Deployment Model 2019 & 2032
- Table 29: Global Healthcare Payment Integrity Market Revenue Million Forecast, by End User 2019 & 2032
- Table 30: Global Healthcare Payment Integrity Market Volume Billion Forecast, by End User 2019 & 2032
- Table 31: Global Healthcare Payment Integrity Market Revenue Million Forecast, by Country 2019 & 2032
- Table 32: Global Healthcare Payment Integrity Market Volume Billion Forecast, by Country 2019 & 2032
- Table 33: Germany Healthcare Payment Integrity Market Revenue (Million) Forecast, by Application 2019 & 2032
- Table 34: Germany Healthcare Payment Integrity Market Volume (Billion) Forecast, by Application 2019 & 2032
- Table 35: United Kingdom Healthcare Payment Integrity Market Revenue (Million) Forecast, by Application 2019 & 2032
- Table 36: United Kingdom Healthcare Payment Integrity Market Volume (Billion) Forecast, by Application 2019 & 2032
- Table 37: France Healthcare Payment Integrity Market Revenue (Million) Forecast, by Application 2019 & 2032
- Table 38: France Healthcare Payment Integrity Market Volume (Billion) Forecast, by Application 2019 & 2032
- Table 39: Italy Healthcare Payment Integrity Market Revenue (Million) Forecast, by Application 2019 & 2032
- Table 40: Italy Healthcare Payment Integrity Market Volume (Billion) Forecast, by Application 2019 & 2032
- Table 41: Spain Healthcare Payment Integrity Market Revenue (Million) Forecast, by Application 2019 & 2032
- Table 42: Spain Healthcare Payment Integrity Market Volume (Billion) Forecast, by Application 2019 & 2032
- Table 43: Rest of Europe Healthcare Payment Integrity Market Revenue (Million) Forecast, by Application 2019 & 2032
- Table 44: Rest of Europe Healthcare Payment Integrity Market Volume (Billion) Forecast, by Application 2019 & 2032
- Table 45: Global Healthcare Payment Integrity Market Revenue Million Forecast, by Solution Type 2019 & 2032
- Table 46: Global Healthcare Payment Integrity Market Volume Billion Forecast, by Solution Type 2019 & 2032
- Table 47: Global Healthcare Payment Integrity Market Revenue Million Forecast, by Deployment Model 2019 & 2032
- Table 48: Global Healthcare Payment Integrity Market Volume Billion Forecast, by Deployment Model 2019 & 2032
- Table 49: Global Healthcare Payment Integrity Market Revenue Million Forecast, by End User 2019 & 2032
- Table 50: Global Healthcare Payment Integrity Market Volume Billion Forecast, by End User 2019 & 2032
- Table 51: Global Healthcare Payment Integrity Market Revenue Million Forecast, by Country 2019 & 2032
- Table 52: Global Healthcare Payment Integrity Market Volume Billion Forecast, by Country 2019 & 2032
- Table 53: China Healthcare Payment Integrity Market Revenue (Million) Forecast, by Application 2019 & 2032
- Table 54: China Healthcare Payment Integrity Market Volume (Billion) Forecast, by Application 2019 & 2032
- Table 55: Japan Healthcare Payment Integrity Market Revenue (Million) Forecast, by Application 2019 & 2032
- Table 56: Japan Healthcare Payment Integrity Market Volume (Billion) Forecast, by Application 2019 & 2032
- Table 57: India Healthcare Payment Integrity Market Revenue (Million) Forecast, by Application 2019 & 2032
- Table 58: India Healthcare Payment Integrity Market Volume (Billion) Forecast, by Application 2019 & 2032
- Table 59: Australia Healthcare Payment Integrity Market Revenue (Million) Forecast, by Application 2019 & 2032
- Table 60: Australia Healthcare Payment Integrity Market Volume (Billion) Forecast, by Application 2019 & 2032
- Table 61: South Korea Healthcare Payment Integrity Market Revenue (Million) Forecast, by Application 2019 & 2032
- Table 62: South Korea Healthcare Payment Integrity Market Volume (Billion) Forecast, by Application 2019 & 2032
- Table 63: Rest of Asia Pacific Healthcare Payment Integrity Market Revenue (Million) Forecast, by Application 2019 & 2032
- Table 64: Rest of Asia Pacific Healthcare Payment Integrity Market Volume (Billion) Forecast, by Application 2019 & 2032
- Table 65: Global Healthcare Payment Integrity Market Revenue Million Forecast, by Solution Type 2019 & 2032
- Table 66: Global Healthcare Payment Integrity Market Volume Billion Forecast, by Solution Type 2019 & 2032
- Table 67: Global Healthcare Payment Integrity Market Revenue Million Forecast, by Deployment Model 2019 & 2032
- Table 68: Global Healthcare Payment Integrity Market Volume Billion Forecast, by Deployment Model 2019 & 2032
- Table 69: Global Healthcare Payment Integrity Market Revenue Million Forecast, by End User 2019 & 2032
- Table 70: Global Healthcare Payment Integrity Market Volume Billion Forecast, by End User 2019 & 2032
- Table 71: Global Healthcare Payment Integrity Market Revenue Million Forecast, by Country 2019 & 2032
- Table 72: Global Healthcare Payment Integrity Market Volume Billion Forecast, by Country 2019 & 2032
- Table 73: GCC Healthcare Payment Integrity Market Revenue (Million) Forecast, by Application 2019 & 2032
- Table 74: GCC Healthcare Payment Integrity Market Volume (Billion) Forecast, by Application 2019 & 2032
- Table 75: South Africa Healthcare Payment Integrity Market Revenue (Million) Forecast, by Application 2019 & 2032
- Table 76: South Africa Healthcare Payment Integrity Market Volume (Billion) Forecast, by Application 2019 & 2032
- Table 77: Rest of Middle East and Africa Healthcare Payment Integrity Market Revenue (Million) Forecast, by Application 2019 & 2032
- Table 78: Rest of Middle East and Africa Healthcare Payment Integrity Market Volume (Billion) Forecast, by Application 2019 & 2032
- Table 79: Global Healthcare Payment Integrity Market Revenue Million Forecast, by Solution Type 2019 & 2032
- Table 80: Global Healthcare Payment Integrity Market Volume Billion Forecast, by Solution Type 2019 & 2032
- Table 81: Global Healthcare Payment Integrity Market Revenue Million Forecast, by Deployment Model 2019 & 2032
- Table 82: Global Healthcare Payment Integrity Market Volume Billion Forecast, by Deployment Model 2019 & 2032
- Table 83: Global Healthcare Payment Integrity Market Revenue Million Forecast, by End User 2019 & 2032
- Table 84: Global Healthcare Payment Integrity Market Volume Billion Forecast, by End User 2019 & 2032
- Table 85: Global Healthcare Payment Integrity Market Revenue Million Forecast, by Country 2019 & 2032
- Table 86: Global Healthcare Payment Integrity Market Volume Billion Forecast, by Country 2019 & 2032
- Table 87: Brazil Healthcare Payment Integrity Market Revenue (Million) Forecast, by Application 2019 & 2032
- Table 88: Brazil Healthcare Payment Integrity Market Volume (Billion) Forecast, by Application 2019 & 2032
- Table 89: Argentina Healthcare Payment Integrity Market Revenue (Million) Forecast, by Application 2019 & 2032
- Table 90: Argentina Healthcare Payment Integrity Market Volume (Billion) Forecast, by Application 2019 & 2032
- Table 91: Rest of South America Healthcare Payment Integrity Market Revenue (Million) Forecast, by Application 2019 & 2032
- Table 92: Rest of South America Healthcare Payment Integrity Market Volume (Billion) Forecast, by Application 2019 & 2032
Frequently Asked Questions
1. What is the projected Compound Annual Growth Rate (CAGR) of the Healthcare Payment Integrity Market?
The projected CAGR is approximately 13.14%.
2. Which companies are prominent players in the Healthcare Payment Integrity Market?
Key companies in the market include Alivia Analytics LLC, Apixio, Codoxo, Conduent Inc, Cotiviti Inc, ExlService Holdings Inc, Gainwell Technologies LLC, NTT DATA Inc, Integrity Advantage, SAS Institute Inc *List Not Exhaustive.
3. What are the main segments of the Healthcare Payment Integrity Market?
The market segments include Solution Type, Deployment Model, End User.
4. Can you provide details about the market size?
The market size is estimated to be USD 13.36 Million as of 2022.
5. What are some drivers contributing to market growth?
Regulatory Changes and Compliance; Innovations in Payment Integrity; Rising Focus on Fraud Prevention.
6. What are the notable trends driving market growth?
The Fraud Detection Segment is Expected to Witness Significant Growth Over the Forecast Period.
7. Are there any restraints impacting market growth?
Regulatory Changes and Compliance; Innovations in Payment Integrity; Rising Focus on Fraud Prevention.
8. Can you provide examples of recent developments in the market?
February 2024: Alivia Analytics acquired SourcEdge, a national provider of claims system modernization services. This strategic acquisition united SourcEdge's expertise in optimizing claims system technology with Alivia's advanced platform for detecting fraud, waste, and abuse (FWA). The combined capabilities will empower commercial and governmental healthcare payers with a comprehensive, end-to-end claims solution. This development marked a significant expansion of Alivia's offerings, positioning the company as a more robust partner for over 25 health plans nationwide.
9. What pricing options are available for accessing the report?
Pricing options include single-user, multi-user, and enterprise licenses priced at USD 4750, USD 5250, and USD 8750 respectively.
10. Is the market size provided in terms of value or volume?
The market size is provided in terms of value, measured in Million and volume, measured in Billion.
11. Are there any specific market keywords associated with the report?
Yes, the market keyword associated with the report is "Healthcare Payment Integrity Market," which aids in identifying and referencing the specific market segment covered.
12. How do I determine which pricing option suits my needs best?
The pricing options vary based on user requirements and access needs. Individual users may opt for single-user licenses, while businesses requiring broader access may choose multi-user or enterprise licenses for cost-effective access to the report.
13. Are there any additional resources or data provided in the Healthcare Payment Integrity Market report?
While the report offers comprehensive insights, it's advisable to review the specific contents or supplementary materials provided to ascertain if additional resources or data are available.
14. How can I stay updated on further developments or reports in the Healthcare Payment Integrity Market?
To stay informed about further developments, trends, and reports in the Healthcare Payment Integrity Market, consider subscribing to industry newsletters, following relevant companies and organizations, or regularly checking reputable industry news sources and publications.
Methodology
Step 1 - Identification of Relevant Samples Size from Population Database


Step 2 - Approaches for Defining Global Market Size (Value, Volume* & Price*)

Note*: In applicable scenarios
Step 3 - Data Sources
Primary Research
- Web Analytics
- Survey Reports
- Research Institute
- Latest Research Reports
- Opinion Leaders
Secondary Research
- Annual Reports
- White Paper
- Latest Press Release
- Industry Association
- Paid Database
- Investor Presentations

Step 4 - Data Triangulation
Involves using different sources of information in order to increase the validity of a study
These sources are likely to be stakeholders in a program - participants, other researchers, program staff, other community members, and so on.
Then we put all data in single framework & apply various statistical tools to find out the dynamic on the market.
During the analysis stage, feedback from the stakeholder groups would be compared to determine areas of agreement as well as areas of divergence


