
Key Insights
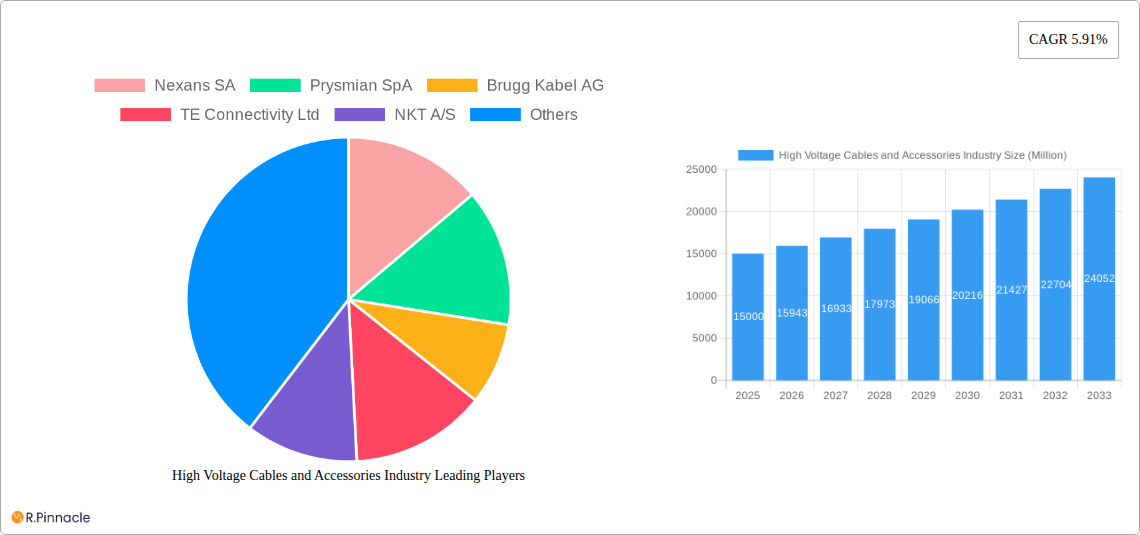
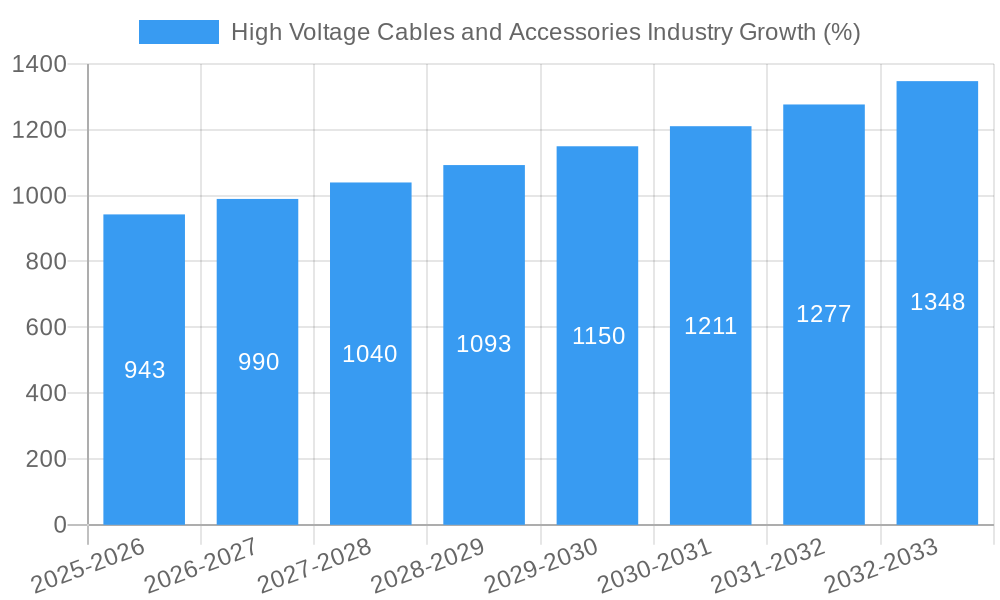
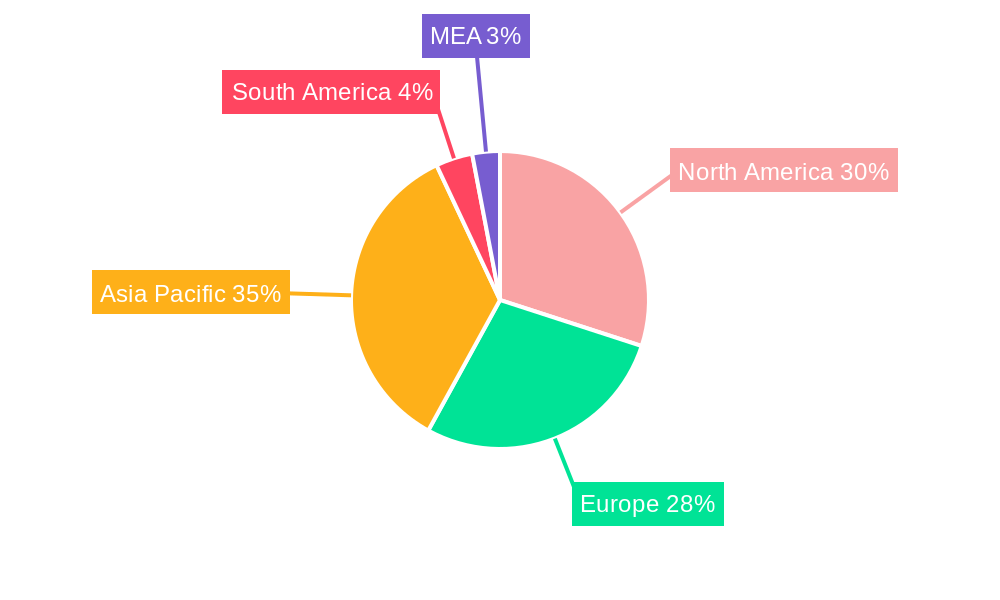
The high-voltage cables and accessories market is experiencing robust growth, driven by the global expansion of electricity grids, the increasing demand for renewable energy sources, and the electrification of transportation. The market's Compound Annual Growth Rate (CAGR) of 5.91% from 2019-2024 suggests a continuously expanding market, projected to reach significant value by 2033. Key market segments include overhead, underground, and submarine deployment locations, along with high, extra-high, and ultra-high voltage levels. The geographical distribution showcases strong performance across North America (particularly the US), Europe (Germany and the UK leading), and the Asia-Pacific region (China and India as major contributors), reflecting the significant infrastructure development and energy transition initiatives underway in these regions. Leading market players like Nexans SA, Prysmian SpA, and Sumitomo Electric Industries Ltd. are strategically investing in research and development to enhance cable technology, focusing on improved efficiency, durability, and sustainability. The market's growth trajectory is further fueled by government investments in smart grids and the increasing adoption of advanced cable materials to handle higher power transmission capacities.
However, the market faces certain restraints, including the high initial investment costs associated with high-voltage cable infrastructure projects and potential supply chain disruptions. Strict regulatory compliance requirements and the need for specialized installation expertise also pose challenges. Despite these restraints, the long-term outlook for the high-voltage cables and accessories market remains positive, driven by the global energy transition and the continuous expansion of electricity networks to meet growing energy demands. The strategic focus on sustainable and efficient cable solutions will be crucial for companies seeking market leadership in the coming years. The increasing integration of renewable energy sources into the grid is anticipated to drive significant demand for high-voltage cables, particularly in offshore wind power projects and large-scale solar farms.
High Voltage Cables and Accessories Industry Market Report: 2019-2033
This comprehensive report provides a detailed analysis of the High Voltage Cables and Accessories industry, offering valuable insights for industry professionals, investors, and stakeholders. The report covers the period 2019-2033, with a focus on the forecast period 2025-2033 and a base year of 2025. The report projects a market valued at xx Million by 2033, driven by robust growth in renewable energy and infrastructure development.
High Voltage Cables and Accessories Industry Market Structure & Innovation Trends
The High Voltage Cables and Accessories market is moderately concentrated, with key players like Nexans SA, Prysmian SpA, Brugg Kabel AG, TE Connectivity Ltd, NKT A/S, LS Cable & System Limited, and Sumitomo Electric Industries Ltd holding significant market share. Precise market share data for each company is unavailable for this report, but Nexans SA and Prysmian SpA are considered to be among the largest players globally. Innovation in the sector is driven by the need for higher voltage transmission capabilities, improved cable materials (e.g., superconducting cables), and enhanced reliability. Regulatory frameworks, particularly concerning safety and environmental standards, significantly impact industry operations. Product substitutes, such as wireless power transmission technologies, are emerging, although their market penetration remains limited as of 2025. The industry has witnessed several M&A activities in recent years, although precise deal values are not publicly available for this report. These activities are primarily aimed at expanding geographical reach and technological capabilities.
High Voltage Cables and Accessories Industry Market Dynamics & Trends
The High Voltage Cables and Accessories market exhibits a positive growth trajectory, fueled by the global expansion of renewable energy sources (solar, wind), electrification of transportation, and growing demand for improved power grids. Technological advancements, such as the development of high-temperature superconducting cables and improved insulation materials, are driving efficiency gains and reducing transmission losses. The increasing adoption of HVDC (High Voltage Direct Current) technology is another significant trend, facilitating long-distance power transmission with enhanced efficiency. Consumer preference is shifting towards environmentally friendly and sustainable cable solutions, promoting the development of recycled and recyclable materials. The competitive landscape is characterized by intense competition among established players and emerging market entrants. The Compound Annual Growth Rate (CAGR) for the period 2025-2033 is projected to be xx%, with market penetration in developing economies expected to increase substantially.
Dominant Regions & Segments in High Voltage Cables and Accessories Industry
The Asia-Pacific region is currently the dominant market for high-voltage cables and accessories, driven by rapid industrialization, urbanization, and significant investments in renewable energy infrastructure. Europe and North America also hold substantial market shares.
Key Drivers for Asia-Pacific Dominance:
- Massive investments in renewable energy projects (solar and wind farms).
- Expanding electricity grids to meet rising energy demand.
- Government initiatives promoting infrastructure development.
Segment Dominance:
- Location of Deployment: The underground segment holds a larger market share due to increased urbanization and the need for reliable power transmission in densely populated areas. Submarine cable deployments are growing rapidly due to the increase in offshore wind farms.
- Voltage Level: The demand for Extra High Voltage (EHV) and Ultra High Voltage (UHV) cables is rising significantly due to the increasing need to transmit large amounts of power over long distances.
The dominance analysis reveals that although other regions show strong growth potential, Asia-Pacific's existing infrastructure development and aggressive investment in renewable energy currently positions it as the market leader.
High Voltage Cables and Accessories Industry Product Innovations
Recent product innovations focus on enhancing cable performance, lifespan, and sustainability. Advancements include the use of advanced polymer insulation materials for improved dielectric strength and heat resistance, as well as the development of lighter weight cables for easier installation and transportation. Furthermore, manufacturers are emphasizing environmentally friendly materials and manufacturing processes to meet increasing sustainability demands. These innovations deliver competitive advantages through improved efficiency, reduced operational costs, and enhanced environmental performance.
Report Scope & Segmentation Analysis
This report segments the High Voltage Cables and Accessories market by location of deployment (overhead, underground, submarine) and voltage level (high voltage, extra high voltage, ultra high voltage). Each segment’s growth is analyzed based on historical data, current market size, and future projections. Competitive dynamics within each segment, including market share and strategies of key players, are also discussed. Detailed growth projections for each segment are provided within the full report.
Key Drivers of High Voltage Cables and Accessories Industry Growth
The industry's growth is primarily driven by several key factors:
- Expanding Renewable Energy Capacity: The global shift towards renewable energy necessitates robust high-voltage transmission infrastructure.
- Infrastructure Development: Investments in upgrading and expanding power grids across the globe fuel demand.
- Technological Advancements: Innovations in cable materials and designs are improving efficiency and reliability.
- Government Regulations: Stringent environmental regulations are promoting the development of sustainable cable technologies.
Challenges in the High Voltage Cables and Accessories Industry Sector
The industry faces several challenges:
- Fluctuating Raw Material Prices: The cost of raw materials significantly impacts production costs.
- Intense Competition: The market is characterized by fierce competition among established players and new entrants.
- Supply Chain Disruptions: Global supply chain vulnerabilities can impact production and delivery timelines.
- Stringent Safety and Environmental Regulations: Compliance with various regulations adds to operational costs.
Emerging Opportunities in High Voltage Cables and Accessories Industry
Emerging opportunities include:
- Growth of Offshore Wind Farms: The expansion of offshore wind energy projects requires specialized submarine cables.
- Smart Grid Technologies: Integration of smart grid technologies increases the demand for advanced monitoring and control systems.
- Development of High-Temperature Superconducting Cables: These cables offer significantly higher transmission capacity and efficiency.
Leading Players in the High Voltage Cables and Accessories Industry Market
- Nexans SA
- Prysmian SpA
- Brugg Kabel AG
- TE Connectivity Ltd
- NKT A/S
- LS Cable & System Limited
- Sumitomo Electric Industries Ltd
Key Developments in High Voltage Cables and Accessories Industry
- June 2023: NKT secures a USD 128.3 Million contract for the Baltic Power offshore wind farm in Poland, encompassing the design and production of approximately 130 kilometers of 240 kV high-voltage power cables. Commissioning is anticipated for 2026.
- May 2023: NKT announces plans to invest approximately USD 1.2 Billion in a new factory in Karlskrona, Sweden, including a third extrusion tower, to meet the growing demand for high-voltage power cables, with projected operation commencement in 2027.
Future Outlook for High Voltage Cables and Accessories Industry Market
The High Voltage Cables and Accessories market is poised for continued growth, driven by the global transition to renewable energy, increased investments in grid infrastructure, and advancements in cable technology. Strategic partnerships, technological innovations, and expansion into emerging markets present significant opportunities for industry players. The market is expected to see increased adoption of sustainable and environmentally friendly cable solutions.
High Voltage Cables and Accessories Industry Segmentation
-
1. Location of Deployment
- 1.1. Overhead
- 1.2. Underground
- 1.3. Submarine
-
2. Voltage Level
- 2.1. High Voltage
- 2.2. Extra High Voltage
- 2.3. Ultra High Voltage
High Voltage Cables and Accessories Industry Segmentation By Geography
- 1. North America
- 2. Asia Pacific
- 3. Europe
- 4. South America
- 5. Middle East and Africa
High Voltage Cables and Accessories Industry REPORT HIGHLIGHTS
| Aspects | Details |
|---|---|
| Study Period | 2019-2033 |
| Base Year | 2024 |
| Estimated Year | 2025 |
| Forecast Period | 2025-2033 |
| Historical Period | 2019-2024 |
| Growth Rate | CAGR of 5.91% from 2019-2033 |
| Segmentation |
|
Table of Contents
- 1. Introduction
- 1.1. Research Scope
- 1.2. Market Segmentation
- 1.3. Research Methodology
- 1.4. Definitions and Assumptions
- 2. Executive Summary
- 2.1. Introduction
- 3. Market Dynamics
- 3.1. Introduction
- 3.2. Market Drivers
- 3.2.1. 4.; Increasing Integration Of Renewable Energy Generation4.; Aging Power Grids And Investments In Transmission And Distribution Infrastructure
- 3.3. Market Restrains
- 3.3.1. 4.; Increasing Raw Material Prices And Investment In Distributed Renewable Energy Generation Affect The Growth
- 3.4. Market Trends
- 3.4.1. Underground Segment to be the Fastest Growing Market
- 4. Market Factor Analysis
- 4.1. Porters Five Forces
- 4.2. Supply/Value Chain
- 4.3. PESTEL analysis
- 4.4. Market Entropy
- 4.5. Patent/Trademark Analysis
- 5. Global High Voltage Cables and Accessories Industry Analysis, Insights and Forecast, 2019-2031
- 5.1. Market Analysis, Insights and Forecast - by Location of Deployment
- 5.1.1. Overhead
- 5.1.2. Underground
- 5.1.3. Submarine
- 5.2. Market Analysis, Insights and Forecast - by Voltage Level
- 5.2.1. High Voltage
- 5.2.2. Extra High Voltage
- 5.2.3. Ultra High Voltage
- 5.3. Market Analysis, Insights and Forecast - by Region
- 5.3.1. North America
- 5.3.2. Asia Pacific
- 5.3.3. Europe
- 5.3.4. South America
- 5.3.5. Middle East and Africa
- 5.1. Market Analysis, Insights and Forecast - by Location of Deployment
- 6. North America High Voltage Cables and Accessories Industry Analysis, Insights and Forecast, 2019-2031
- 6.1. Market Analysis, Insights and Forecast - by Location of Deployment
- 6.1.1. Overhead
- 6.1.2. Underground
- 6.1.3. Submarine
- 6.2. Market Analysis, Insights and Forecast - by Voltage Level
- 6.2.1. High Voltage
- 6.2.2. Extra High Voltage
- 6.2.3. Ultra High Voltage
- 6.1. Market Analysis, Insights and Forecast - by Location of Deployment
- 7. Asia Pacific High Voltage Cables and Accessories Industry Analysis, Insights and Forecast, 2019-2031
- 7.1. Market Analysis, Insights and Forecast - by Location of Deployment
- 7.1.1. Overhead
- 7.1.2. Underground
- 7.1.3. Submarine
- 7.2. Market Analysis, Insights and Forecast - by Voltage Level
- 7.2.1. High Voltage
- 7.2.2. Extra High Voltage
- 7.2.3. Ultra High Voltage
- 7.1. Market Analysis, Insights and Forecast - by Location of Deployment
- 8. Europe High Voltage Cables and Accessories Industry Analysis, Insights and Forecast, 2019-2031
- 8.1. Market Analysis, Insights and Forecast - by Location of Deployment
- 8.1.1. Overhead
- 8.1.2. Underground
- 8.1.3. Submarine
- 8.2. Market Analysis, Insights and Forecast - by Voltage Level
- 8.2.1. High Voltage
- 8.2.2. Extra High Voltage
- 8.2.3. Ultra High Voltage
- 8.1. Market Analysis, Insights and Forecast - by Location of Deployment
- 9. South America High Voltage Cables and Accessories Industry Analysis, Insights and Forecast, 2019-2031
- 9.1. Market Analysis, Insights and Forecast - by Location of Deployment
- 9.1.1. Overhead
- 9.1.2. Underground
- 9.1.3. Submarine
- 9.2. Market Analysis, Insights and Forecast - by Voltage Level
- 9.2.1. High Voltage
- 9.2.2. Extra High Voltage
- 9.2.3. Ultra High Voltage
- 9.1. Market Analysis, Insights and Forecast - by Location of Deployment
- 10. Middle East and Africa High Voltage Cables and Accessories Industry Analysis, Insights and Forecast, 2019-2031
- 10.1. Market Analysis, Insights and Forecast - by Location of Deployment
- 10.1.1. Overhead
- 10.1.2. Underground
- 10.1.3. Submarine
- 10.2. Market Analysis, Insights and Forecast - by Voltage Level
- 10.2.1. High Voltage
- 10.2.2. Extra High Voltage
- 10.2.3. Ultra High Voltage
- 10.1. Market Analysis, Insights and Forecast - by Location of Deployment
- 11. North America High Voltage Cables and Accessories Industry Analysis, Insights and Forecast, 2019-2031
- 11.1. Market Analysis, Insights and Forecast - By Country/Sub-region
- 11.1.1 United States
- 11.1.2 Canada
- 11.1.3 Mexico
- 12. Europe High Voltage Cables and Accessories Industry Analysis, Insights and Forecast, 2019-2031
- 12.1. Market Analysis, Insights and Forecast - By Country/Sub-region
- 12.1.1 Germany
- 12.1.2 United Kingdom
- 12.1.3 France
- 12.1.4 Spain
- 12.1.5 Italy
- 12.1.6 Spain
- 12.1.7 Belgium
- 12.1.8 Netherland
- 12.1.9 Nordics
- 12.1.10 Rest of Europe
- 13. Asia Pacific High Voltage Cables and Accessories Industry Analysis, Insights and Forecast, 2019-2031
- 13.1. Market Analysis, Insights and Forecast - By Country/Sub-region
- 13.1.1 China
- 13.1.2 Japan
- 13.1.3 India
- 13.1.4 South Korea
- 13.1.5 Southeast Asia
- 13.1.6 Australia
- 13.1.7 Indonesia
- 13.1.8 Phillipes
- 13.1.9 Singapore
- 13.1.10 Thailandc
- 13.1.11 Rest of Asia Pacific
- 14. South America High Voltage Cables and Accessories Industry Analysis, Insights and Forecast, 2019-2031
- 14.1. Market Analysis, Insights and Forecast - By Country/Sub-region
- 14.1.1 Brazil
- 14.1.2 Argentina
- 14.1.3 Peru
- 14.1.4 Chile
- 14.1.5 Colombia
- 14.1.6 Ecuador
- 14.1.7 Venezuela
- 14.1.8 Rest of South America
- 15. MEA High Voltage Cables and Accessories Industry Analysis, Insights and Forecast, 2019-2031
- 15.1. Market Analysis, Insights and Forecast - By Country/Sub-region
- 15.1.1 United Arab Emirates
- 15.1.2 Saudi Arabia
- 15.1.3 South Africa
- 15.1.4 Rest of Middle East and Africa
- 16. Competitive Analysis
- 16.1. Global Market Share Analysis 2024
- 16.2. Company Profiles
- 16.2.1 Nexans SA
- 16.2.1.1. Overview
- 16.2.1.2. Products
- 16.2.1.3. SWOT Analysis
- 16.2.1.4. Recent Developments
- 16.2.1.5. Financials (Based on Availability)
- 16.2.2 Prysmian SpA
- 16.2.2.1. Overview
- 16.2.2.2. Products
- 16.2.2.3. SWOT Analysis
- 16.2.2.4. Recent Developments
- 16.2.2.5. Financials (Based on Availability)
- 16.2.3 Brugg Kabel AG
- 16.2.3.1. Overview
- 16.2.3.2. Products
- 16.2.3.3. SWOT Analysis
- 16.2.3.4. Recent Developments
- 16.2.3.5. Financials (Based on Availability)
- 16.2.4 TE Connectivity Ltd
- 16.2.4.1. Overview
- 16.2.4.2. Products
- 16.2.4.3. SWOT Analysis
- 16.2.4.4. Recent Developments
- 16.2.4.5. Financials (Based on Availability)
- 16.2.5 NKT A/S
- 16.2.5.1. Overview
- 16.2.5.2. Products
- 16.2.5.3. SWOT Analysis
- 16.2.5.4. Recent Developments
- 16.2.5.5. Financials (Based on Availability)
- 16.2.6 LS Cable & System Limited
- 16.2.6.1. Overview
- 16.2.6.2. Products
- 16.2.6.3. SWOT Analysis
- 16.2.6.4. Recent Developments
- 16.2.6.5. Financials (Based on Availability)
- 16.2.7 Sumitomo Electric Industries Ltd
- 16.2.7.1. Overview
- 16.2.7.2. Products
- 16.2.7.3. SWOT Analysis
- 16.2.7.4. Recent Developments
- 16.2.7.5. Financials (Based on Availability)
- 16.2.1 Nexans SA
List of Figures
- Figure 1: Global High Voltage Cables and Accessories Industry Revenue Breakdown (Million, %) by Region 2024 & 2032
- Figure 2: Global High Voltage Cables and Accessories Industry Volume Breakdown (K Unit, %) by Region 2024 & 2032
- Figure 3: North America High Voltage Cables and Accessories Industry Revenue (Million), by Country 2024 & 2032
- Figure 4: North America High Voltage Cables and Accessories Industry Volume (K Unit), by Country 2024 & 2032
- Figure 5: North America High Voltage Cables and Accessories Industry Revenue Share (%), by Country 2024 & 2032
- Figure 6: North America High Voltage Cables and Accessories Industry Volume Share (%), by Country 2024 & 2032
- Figure 7: Europe High Voltage Cables and Accessories Industry Revenue (Million), by Country 2024 & 2032
- Figure 8: Europe High Voltage Cables and Accessories Industry Volume (K Unit), by Country 2024 & 2032
- Figure 9: Europe High Voltage Cables and Accessories Industry Revenue Share (%), by Country 2024 & 2032
- Figure 10: Europe High Voltage Cables and Accessories Industry Volume Share (%), by Country 2024 & 2032
- Figure 11: Asia Pacific High Voltage Cables and Accessories Industry Revenue (Million), by Country 2024 & 2032
- Figure 12: Asia Pacific High Voltage Cables and Accessories Industry Volume (K Unit), by Country 2024 & 2032
- Figure 13: Asia Pacific High Voltage Cables and Accessories Industry Revenue Share (%), by Country 2024 & 2032
- Figure 14: Asia Pacific High Voltage Cables and Accessories Industry Volume Share (%), by Country 2024 & 2032
- Figure 15: South America High Voltage Cables and Accessories Industry Revenue (Million), by Country 2024 & 2032
- Figure 16: South America High Voltage Cables and Accessories Industry Volume (K Unit), by Country 2024 & 2032
- Figure 17: South America High Voltage Cables and Accessories Industry Revenue Share (%), by Country 2024 & 2032
- Figure 18: South America High Voltage Cables and Accessories Industry Volume Share (%), by Country 2024 & 2032
- Figure 19: MEA High Voltage Cables and Accessories Industry Revenue (Million), by Country 2024 & 2032
- Figure 20: MEA High Voltage Cables and Accessories Industry Volume (K Unit), by Country 2024 & 2032
- Figure 21: MEA High Voltage Cables and Accessories Industry Revenue Share (%), by Country 2024 & 2032
- Figure 22: MEA High Voltage Cables and Accessories Industry Volume Share (%), by Country 2024 & 2032
- Figure 23: North America High Voltage Cables and Accessories Industry Revenue (Million), by Location of Deployment 2024 & 2032
- Figure 24: North America High Voltage Cables and Accessories Industry Volume (K Unit), by Location of Deployment 2024 & 2032
- Figure 25: North America High Voltage Cables and Accessories Industry Revenue Share (%), by Location of Deployment 2024 & 2032
- Figure 26: North America High Voltage Cables and Accessories Industry Volume Share (%), by Location of Deployment 2024 & 2032
- Figure 27: North America High Voltage Cables and Accessories Industry Revenue (Million), by Voltage Level 2024 & 2032
- Figure 28: North America High Voltage Cables and Accessories Industry Volume (K Unit), by Voltage Level 2024 & 2032
- Figure 29: North America High Voltage Cables and Accessories Industry Revenue Share (%), by Voltage Level 2024 & 2032
- Figure 30: North America High Voltage Cables and Accessories Industry Volume Share (%), by Voltage Level 2024 & 2032
- Figure 31: North America High Voltage Cables and Accessories Industry Revenue (Million), by Country 2024 & 2032
- Figure 32: North America High Voltage Cables and Accessories Industry Volume (K Unit), by Country 2024 & 2032
- Figure 33: North America High Voltage Cables and Accessories Industry Revenue Share (%), by Country 2024 & 2032
- Figure 34: North America High Voltage Cables and Accessories Industry Volume Share (%), by Country 2024 & 2032
- Figure 35: Asia Pacific High Voltage Cables and Accessories Industry Revenue (Million), by Location of Deployment 2024 & 2032
- Figure 36: Asia Pacific High Voltage Cables and Accessories Industry Volume (K Unit), by Location of Deployment 2024 & 2032
- Figure 37: Asia Pacific High Voltage Cables and Accessories Industry Revenue Share (%), by Location of Deployment 2024 & 2032
- Figure 38: Asia Pacific High Voltage Cables and Accessories Industry Volume Share (%), by Location of Deployment 2024 & 2032
- Figure 39: Asia Pacific High Voltage Cables and Accessories Industry Revenue (Million), by Voltage Level 2024 & 2032
- Figure 40: Asia Pacific High Voltage Cables and Accessories Industry Volume (K Unit), by Voltage Level 2024 & 2032
- Figure 41: Asia Pacific High Voltage Cables and Accessories Industry Revenue Share (%), by Voltage Level 2024 & 2032
- Figure 42: Asia Pacific High Voltage Cables and Accessories Industry Volume Share (%), by Voltage Level 2024 & 2032
- Figure 43: Asia Pacific High Voltage Cables and Accessories Industry Revenue (Million), by Country 2024 & 2032
- Figure 44: Asia Pacific High Voltage Cables and Accessories Industry Volume (K Unit), by Country 2024 & 2032
- Figure 45: Asia Pacific High Voltage Cables and Accessories Industry Revenue Share (%), by Country 2024 & 2032
- Figure 46: Asia Pacific High Voltage Cables and Accessories Industry Volume Share (%), by Country 2024 & 2032
- Figure 47: Europe High Voltage Cables and Accessories Industry Revenue (Million), by Location of Deployment 2024 & 2032
- Figure 48: Europe High Voltage Cables and Accessories Industry Volume (K Unit), by Location of Deployment 2024 & 2032
- Figure 49: Europe High Voltage Cables and Accessories Industry Revenue Share (%), by Location of Deployment 2024 & 2032
- Figure 50: Europe High Voltage Cables and Accessories Industry Volume Share (%), by Location of Deployment 2024 & 2032
- Figure 51: Europe High Voltage Cables and Accessories Industry Revenue (Million), by Voltage Level 2024 & 2032
- Figure 52: Europe High Voltage Cables and Accessories Industry Volume (K Unit), by Voltage Level 2024 & 2032
- Figure 53: Europe High Voltage Cables and Accessories Industry Revenue Share (%), by Voltage Level 2024 & 2032
- Figure 54: Europe High Voltage Cables and Accessories Industry Volume Share (%), by Voltage Level 2024 & 2032
- Figure 55: Europe High Voltage Cables and Accessories Industry Revenue (Million), by Country 2024 & 2032
- Figure 56: Europe High Voltage Cables and Accessories Industry Volume (K Unit), by Country 2024 & 2032
- Figure 57: Europe High Voltage Cables and Accessories Industry Revenue Share (%), by Country 2024 & 2032
- Figure 58: Europe High Voltage Cables and Accessories Industry Volume Share (%), by Country 2024 & 2032
- Figure 59: South America High Voltage Cables and Accessories Industry Revenue (Million), by Location of Deployment 2024 & 2032
- Figure 60: South America High Voltage Cables and Accessories Industry Volume (K Unit), by Location of Deployment 2024 & 2032
- Figure 61: South America High Voltage Cables and Accessories Industry Revenue Share (%), by Location of Deployment 2024 & 2032
- Figure 62: South America High Voltage Cables and Accessories Industry Volume Share (%), by Location of Deployment 2024 & 2032
- Figure 63: South America High Voltage Cables and Accessories Industry Revenue (Million), by Voltage Level 2024 & 2032
- Figure 64: South America High Voltage Cables and Accessories Industry Volume (K Unit), by Voltage Level 2024 & 2032
- Figure 65: South America High Voltage Cables and Accessories Industry Revenue Share (%), by Voltage Level 2024 & 2032
- Figure 66: South America High Voltage Cables and Accessories Industry Volume Share (%), by Voltage Level 2024 & 2032
- Figure 67: South America High Voltage Cables and Accessories Industry Revenue (Million), by Country 2024 & 2032
- Figure 68: South America High Voltage Cables and Accessories Industry Volume (K Unit), by Country 2024 & 2032
- Figure 69: South America High Voltage Cables and Accessories Industry Revenue Share (%), by Country 2024 & 2032
- Figure 70: South America High Voltage Cables and Accessories Industry Volume Share (%), by Country 2024 & 2032
- Figure 71: Middle East and Africa High Voltage Cables and Accessories Industry Revenue (Million), by Location of Deployment 2024 & 2032
- Figure 72: Middle East and Africa High Voltage Cables and Accessories Industry Volume (K Unit), by Location of Deployment 2024 & 2032
- Figure 73: Middle East and Africa High Voltage Cables and Accessories Industry Revenue Share (%), by Location of Deployment 2024 & 2032
- Figure 74: Middle East and Africa High Voltage Cables and Accessories Industry Volume Share (%), by Location of Deployment 2024 & 2032
- Figure 75: Middle East and Africa High Voltage Cables and Accessories Industry Revenue (Million), by Voltage Level 2024 & 2032
- Figure 76: Middle East and Africa High Voltage Cables and Accessories Industry Volume (K Unit), by Voltage Level 2024 & 2032
- Figure 77: Middle East and Africa High Voltage Cables and Accessories Industry Revenue Share (%), by Voltage Level 2024 & 2032
- Figure 78: Middle East and Africa High Voltage Cables and Accessories Industry Volume Share (%), by Voltage Level 2024 & 2032
- Figure 79: Middle East and Africa High Voltage Cables and Accessories Industry Revenue (Million), by Country 2024 & 2032
- Figure 80: Middle East and Africa High Voltage Cables and Accessories Industry Volume (K Unit), by Country 2024 & 2032
- Figure 81: Middle East and Africa High Voltage Cables and Accessories Industry Revenue Share (%), by Country 2024 & 2032
- Figure 82: Middle East and Africa High Voltage Cables and Accessories Industry Volume Share (%), by Country 2024 & 2032
List of Tables
- Table 1: Global High Voltage Cables and Accessories Industry Revenue Million Forecast, by Region 2019 & 2032
- Table 2: Global High Voltage Cables and Accessories Industry Volume K Unit Forecast, by Region 2019 & 2032
- Table 3: Global High Voltage Cables and Accessories Industry Revenue Million Forecast, by Location of Deployment 2019 & 2032
- Table 4: Global High Voltage Cables and Accessories Industry Volume K Unit Forecast, by Location of Deployment 2019 & 2032
- Table 5: Global High Voltage Cables and Accessories Industry Revenue Million Forecast, by Voltage Level 2019 & 2032
- Table 6: Global High Voltage Cables and Accessories Industry Volume K Unit Forecast, by Voltage Level 2019 & 2032
- Table 7: Global High Voltage Cables and Accessories Industry Revenue Million Forecast, by Region 2019 & 2032
- Table 8: Global High Voltage Cables and Accessories Industry Volume K Unit Forecast, by Region 2019 & 2032
- Table 9: Global High Voltage Cables and Accessories Industry Revenue Million Forecast, by Country 2019 & 2032
- Table 10: Global High Voltage Cables and Accessories Industry Volume K Unit Forecast, by Country 2019 & 2032
- Table 11: United States High Voltage Cables and Accessories Industry Revenue (Million) Forecast, by Application 2019 & 2032
- Table 12: United States High Voltage Cables and Accessories Industry Volume (K Unit) Forecast, by Application 2019 & 2032
- Table 13: Canada High Voltage Cables and Accessories Industry Revenue (Million) Forecast, by Application 2019 & 2032
- Table 14: Canada High Voltage Cables and Accessories Industry Volume (K Unit) Forecast, by Application 2019 & 2032
- Table 15: Mexico High Voltage Cables and Accessories Industry Revenue (Million) Forecast, by Application 2019 & 2032
- Table 16: Mexico High Voltage Cables and Accessories Industry Volume (K Unit) Forecast, by Application 2019 & 2032
- Table 17: Global High Voltage Cables and Accessories Industry Revenue Million Forecast, by Country 2019 & 2032
- Table 18: Global High Voltage Cables and Accessories Industry Volume K Unit Forecast, by Country 2019 & 2032
- Table 19: Germany High Voltage Cables and Accessories Industry Revenue (Million) Forecast, by Application 2019 & 2032
- Table 20: Germany High Voltage Cables and Accessories Industry Volume (K Unit) Forecast, by Application 2019 & 2032
- Table 21: United Kingdom High Voltage Cables and Accessories Industry Revenue (Million) Forecast, by Application 2019 & 2032
- Table 22: United Kingdom High Voltage Cables and Accessories Industry Volume (K Unit) Forecast, by Application 2019 & 2032
- Table 23: France High Voltage Cables and Accessories Industry Revenue (Million) Forecast, by Application 2019 & 2032
- Table 24: France High Voltage Cables and Accessories Industry Volume (K Unit) Forecast, by Application 2019 & 2032
- Table 25: Spain High Voltage Cables and Accessories Industry Revenue (Million) Forecast, by Application 2019 & 2032
- Table 26: Spain High Voltage Cables and Accessories Industry Volume (K Unit) Forecast, by Application 2019 & 2032
- Table 27: Italy High Voltage Cables and Accessories Industry Revenue (Million) Forecast, by Application 2019 & 2032
- Table 28: Italy High Voltage Cables and Accessories Industry Volume (K Unit) Forecast, by Application 2019 & 2032
- Table 29: Spain High Voltage Cables and Accessories Industry Revenue (Million) Forecast, by Application 2019 & 2032
- Table 30: Spain High Voltage Cables and Accessories Industry Volume (K Unit) Forecast, by Application 2019 & 2032
- Table 31: Belgium High Voltage Cables and Accessories Industry Revenue (Million) Forecast, by Application 2019 & 2032
- Table 32: Belgium High Voltage Cables and Accessories Industry Volume (K Unit) Forecast, by Application 2019 & 2032
- Table 33: Netherland High Voltage Cables and Accessories Industry Revenue (Million) Forecast, by Application 2019 & 2032
- Table 34: Netherland High Voltage Cables and Accessories Industry Volume (K Unit) Forecast, by Application 2019 & 2032
- Table 35: Nordics High Voltage Cables and Accessories Industry Revenue (Million) Forecast, by Application 2019 & 2032
- Table 36: Nordics High Voltage Cables and Accessories Industry Volume (K Unit) Forecast, by Application 2019 & 2032
- Table 37: Rest of Europe High Voltage Cables and Accessories Industry Revenue (Million) Forecast, by Application 2019 & 2032
- Table 38: Rest of Europe High Voltage Cables and Accessories Industry Volume (K Unit) Forecast, by Application 2019 & 2032
- Table 39: Global High Voltage Cables and Accessories Industry Revenue Million Forecast, by Country 2019 & 2032
- Table 40: Global High Voltage Cables and Accessories Industry Volume K Unit Forecast, by Country 2019 & 2032
- Table 41: China High Voltage Cables and Accessories Industry Revenue (Million) Forecast, by Application 2019 & 2032
- Table 42: China High Voltage Cables and Accessories Industry Volume (K Unit) Forecast, by Application 2019 & 2032
- Table 43: Japan High Voltage Cables and Accessories Industry Revenue (Million) Forecast, by Application 2019 & 2032
- Table 44: Japan High Voltage Cables and Accessories Industry Volume (K Unit) Forecast, by Application 2019 & 2032
- Table 45: India High Voltage Cables and Accessories Industry Revenue (Million) Forecast, by Application 2019 & 2032
- Table 46: India High Voltage Cables and Accessories Industry Volume (K Unit) Forecast, by Application 2019 & 2032
- Table 47: South Korea High Voltage Cables and Accessories Industry Revenue (Million) Forecast, by Application 2019 & 2032
- Table 48: South Korea High Voltage Cables and Accessories Industry Volume (K Unit) Forecast, by Application 2019 & 2032
- Table 49: Southeast Asia High Voltage Cables and Accessories Industry Revenue (Million) Forecast, by Application 2019 & 2032
- Table 50: Southeast Asia High Voltage Cables and Accessories Industry Volume (K Unit) Forecast, by Application 2019 & 2032
- Table 51: Australia High Voltage Cables and Accessories Industry Revenue (Million) Forecast, by Application 2019 & 2032
- Table 52: Australia High Voltage Cables and Accessories Industry Volume (K Unit) Forecast, by Application 2019 & 2032
- Table 53: Indonesia High Voltage Cables and Accessories Industry Revenue (Million) Forecast, by Application 2019 & 2032
- Table 54: Indonesia High Voltage Cables and Accessories Industry Volume (K Unit) Forecast, by Application 2019 & 2032
- Table 55: Phillipes High Voltage Cables and Accessories Industry Revenue (Million) Forecast, by Application 2019 & 2032
- Table 56: Phillipes High Voltage Cables and Accessories Industry Volume (K Unit) Forecast, by Application 2019 & 2032
- Table 57: Singapore High Voltage Cables and Accessories Industry Revenue (Million) Forecast, by Application 2019 & 2032
- Table 58: Singapore High Voltage Cables and Accessories Industry Volume (K Unit) Forecast, by Application 2019 & 2032
- Table 59: Thailandc High Voltage Cables and Accessories Industry Revenue (Million) Forecast, by Application 2019 & 2032
- Table 60: Thailandc High Voltage Cables and Accessories Industry Volume (K Unit) Forecast, by Application 2019 & 2032
- Table 61: Rest of Asia Pacific High Voltage Cables and Accessories Industry Revenue (Million) Forecast, by Application 2019 & 2032
- Table 62: Rest of Asia Pacific High Voltage Cables and Accessories Industry Volume (K Unit) Forecast, by Application 2019 & 2032
- Table 63: Global High Voltage Cables and Accessories Industry Revenue Million Forecast, by Country 2019 & 2032
- Table 64: Global High Voltage Cables and Accessories Industry Volume K Unit Forecast, by Country 2019 & 2032
- Table 65: Brazil High Voltage Cables and Accessories Industry Revenue (Million) Forecast, by Application 2019 & 2032
- Table 66: Brazil High Voltage Cables and Accessories Industry Volume (K Unit) Forecast, by Application 2019 & 2032
- Table 67: Argentina High Voltage Cables and Accessories Industry Revenue (Million) Forecast, by Application 2019 & 2032
- Table 68: Argentina High Voltage Cables and Accessories Industry Volume (K Unit) Forecast, by Application 2019 & 2032
- Table 69: Peru High Voltage Cables and Accessories Industry Revenue (Million) Forecast, by Application 2019 & 2032
- Table 70: Peru High Voltage Cables and Accessories Industry Volume (K Unit) Forecast, by Application 2019 & 2032
- Table 71: Chile High Voltage Cables and Accessories Industry Revenue (Million) Forecast, by Application 2019 & 2032
- Table 72: Chile High Voltage Cables and Accessories Industry Volume (K Unit) Forecast, by Application 2019 & 2032
- Table 73: Colombia High Voltage Cables and Accessories Industry Revenue (Million) Forecast, by Application 2019 & 2032
- Table 74: Colombia High Voltage Cables and Accessories Industry Volume (K Unit) Forecast, by Application 2019 & 2032
- Table 75: Ecuador High Voltage Cables and Accessories Industry Revenue (Million) Forecast, by Application 2019 & 2032
- Table 76: Ecuador High Voltage Cables and Accessories Industry Volume (K Unit) Forecast, by Application 2019 & 2032
- Table 77: Venezuela High Voltage Cables and Accessories Industry Revenue (Million) Forecast, by Application 2019 & 2032
- Table 78: Venezuela High Voltage Cables and Accessories Industry Volume (K Unit) Forecast, by Application 2019 & 2032
- Table 79: Rest of South America High Voltage Cables and Accessories Industry Revenue (Million) Forecast, by Application 2019 & 2032
- Table 80: Rest of South America High Voltage Cables and Accessories Industry Volume (K Unit) Forecast, by Application 2019 & 2032
- Table 81: Global High Voltage Cables and Accessories Industry Revenue Million Forecast, by Country 2019 & 2032
- Table 82: Global High Voltage Cables and Accessories Industry Volume K Unit Forecast, by Country 2019 & 2032
- Table 83: United Arab Emirates High Voltage Cables and Accessories Industry Revenue (Million) Forecast, by Application 2019 & 2032
- Table 84: United Arab Emirates High Voltage Cables and Accessories Industry Volume (K Unit) Forecast, by Application 2019 & 2032
- Table 85: Saudi Arabia High Voltage Cables and Accessories Industry Revenue (Million) Forecast, by Application 2019 & 2032
- Table 86: Saudi Arabia High Voltage Cables and Accessories Industry Volume (K Unit) Forecast, by Application 2019 & 2032
- Table 87: South Africa High Voltage Cables and Accessories Industry Revenue (Million) Forecast, by Application 2019 & 2032
- Table 88: South Africa High Voltage Cables and Accessories Industry Volume (K Unit) Forecast, by Application 2019 & 2032
- Table 89: Rest of Middle East and Africa High Voltage Cables and Accessories Industry Revenue (Million) Forecast, by Application 2019 & 2032
- Table 90: Rest of Middle East and Africa High Voltage Cables and Accessories Industry Volume (K Unit) Forecast, by Application 2019 & 2032
- Table 91: Global High Voltage Cables and Accessories Industry Revenue Million Forecast, by Location of Deployment 2019 & 2032
- Table 92: Global High Voltage Cables and Accessories Industry Volume K Unit Forecast, by Location of Deployment 2019 & 2032
- Table 93: Global High Voltage Cables and Accessories Industry Revenue Million Forecast, by Voltage Level 2019 & 2032
- Table 94: Global High Voltage Cables and Accessories Industry Volume K Unit Forecast, by Voltage Level 2019 & 2032
- Table 95: Global High Voltage Cables and Accessories Industry Revenue Million Forecast, by Country 2019 & 2032
- Table 96: Global High Voltage Cables and Accessories Industry Volume K Unit Forecast, by Country 2019 & 2032
- Table 97: Global High Voltage Cables and Accessories Industry Revenue Million Forecast, by Location of Deployment 2019 & 2032
- Table 98: Global High Voltage Cables and Accessories Industry Volume K Unit Forecast, by Location of Deployment 2019 & 2032
- Table 99: Global High Voltage Cables and Accessories Industry Revenue Million Forecast, by Voltage Level 2019 & 2032
- Table 100: Global High Voltage Cables and Accessories Industry Volume K Unit Forecast, by Voltage Level 2019 & 2032
- Table 101: Global High Voltage Cables and Accessories Industry Revenue Million Forecast, by Country 2019 & 2032
- Table 102: Global High Voltage Cables and Accessories Industry Volume K Unit Forecast, by Country 2019 & 2032
- Table 103: Global High Voltage Cables and Accessories Industry Revenue Million Forecast, by Location of Deployment 2019 & 2032
- Table 104: Global High Voltage Cables and Accessories Industry Volume K Unit Forecast, by Location of Deployment 2019 & 2032
- Table 105: Global High Voltage Cables and Accessories Industry Revenue Million Forecast, by Voltage Level 2019 & 2032
- Table 106: Global High Voltage Cables and Accessories Industry Volume K Unit Forecast, by Voltage Level 2019 & 2032
- Table 107: Global High Voltage Cables and Accessories Industry Revenue Million Forecast, by Country 2019 & 2032
- Table 108: Global High Voltage Cables and Accessories Industry Volume K Unit Forecast, by Country 2019 & 2032
- Table 109: Global High Voltage Cables and Accessories Industry Revenue Million Forecast, by Location of Deployment 2019 & 2032
- Table 110: Global High Voltage Cables and Accessories Industry Volume K Unit Forecast, by Location of Deployment 2019 & 2032
- Table 111: Global High Voltage Cables and Accessories Industry Revenue Million Forecast, by Voltage Level 2019 & 2032
- Table 112: Global High Voltage Cables and Accessories Industry Volume K Unit Forecast, by Voltage Level 2019 & 2032
- Table 113: Global High Voltage Cables and Accessories Industry Revenue Million Forecast, by Country 2019 & 2032
- Table 114: Global High Voltage Cables and Accessories Industry Volume K Unit Forecast, by Country 2019 & 2032
- Table 115: Global High Voltage Cables and Accessories Industry Revenue Million Forecast, by Location of Deployment 2019 & 2032
- Table 116: Global High Voltage Cables and Accessories Industry Volume K Unit Forecast, by Location of Deployment 2019 & 2032
- Table 117: Global High Voltage Cables and Accessories Industry Revenue Million Forecast, by Voltage Level 2019 & 2032
- Table 118: Global High Voltage Cables and Accessories Industry Volume K Unit Forecast, by Voltage Level 2019 & 2032
- Table 119: Global High Voltage Cables and Accessories Industry Revenue Million Forecast, by Country 2019 & 2032
- Table 120: Global High Voltage Cables and Accessories Industry Volume K Unit Forecast, by Country 2019 & 2032
Frequently Asked Questions
1. What is the projected Compound Annual Growth Rate (CAGR) of the High Voltage Cables and Accessories Industry?
The projected CAGR is approximately 5.91%.
2. Which companies are prominent players in the High Voltage Cables and Accessories Industry?
Key companies in the market include Nexans SA, Prysmian SpA, Brugg Kabel AG, TE Connectivity Ltd, NKT A/S, LS Cable & System Limited, Sumitomo Electric Industries Ltd.
3. What are the main segments of the High Voltage Cables and Accessories Industry?
The market segments include Location of Deployment, Voltage Level.
4. Can you provide details about the market size?
The market size is estimated to be USD XX Million as of 2022.
5. What are some drivers contributing to market growth?
4.; Increasing Integration Of Renewable Energy Generation4.; Aging Power Grids And Investments In Transmission And Distribution Infrastructure.
6. What are the notable trends driving market growth?
Underground Segment to be the Fastest Growing Market.
7. Are there any restraints impacting market growth?
4.; Increasing Raw Material Prices And Investment In Distributed Renewable Energy Generation Affect The Growth.
8. Can you provide examples of recent developments in the market?
In June 2023, NKT announced that it is finalizing the power cable contract for Poland's 1.2 GW Baltic Power offshore wind farm. The USD 128.3 million contract will design and produce approximately 130 kilometers of 240 kV high-voltage power cables for the Baltic Power offshore wind project. The Baltic Power offshore wind park is one of the first in Poland. The export power cables will be produced at the NKT factory in Cologne, with the anticipated commissioning of the total project in 2026. It will supply more than 1.5 million Polish households with renewable energy annually for about 25 years.
9. What pricing options are available for accessing the report?
Pricing options include single-user, multi-user, and enterprise licenses priced at USD 4750, USD 5250, and USD 8750 respectively.
10. Is the market size provided in terms of value or volume?
The market size is provided in terms of value, measured in Million and volume, measured in K Unit.
11. Are there any specific market keywords associated with the report?
Yes, the market keyword associated with the report is "High Voltage Cables and Accessories Industry," which aids in identifying and referencing the specific market segment covered.
12. How do I determine which pricing option suits my needs best?
The pricing options vary based on user requirements and access needs. Individual users may opt for single-user licenses, while businesses requiring broader access may choose multi-user or enterprise licenses for cost-effective access to the report.
13. Are there any additional resources or data provided in the High Voltage Cables and Accessories Industry report?
While the report offers comprehensive insights, it's advisable to review the specific contents or supplementary materials provided to ascertain if additional resources or data are available.
14. How can I stay updated on further developments or reports in the High Voltage Cables and Accessories Industry?
To stay informed about further developments, trends, and reports in the High Voltage Cables and Accessories Industry, consider subscribing to industry newsletters, following relevant companies and organizations, or regularly checking reputable industry news sources and publications.
Methodology
Step 1 - Identification of Relevant Samples Size from Population Database


Step 2 - Approaches for Defining Global Market Size (Value, Volume* & Price*)

Note*: In applicable scenarios
Step 3 - Data Sources
Primary Research
- Web Analytics
- Survey Reports
- Research Institute
- Latest Research Reports
- Opinion Leaders
Secondary Research
- Annual Reports
- White Paper
- Latest Press Release
- Industry Association
- Paid Database
- Investor Presentations

Step 4 - Data Triangulation
Involves using different sources of information in order to increase the validity of a study
These sources are likely to be stakeholders in a program - participants, other researchers, program staff, other community members, and so on.
Then we put all data in single framework & apply various statistical tools to find out the dynamic on the market.
During the analysis stage, feedback from the stakeholder groups would be compared to determine areas of agreement as well as areas of divergence


