
Key Insights
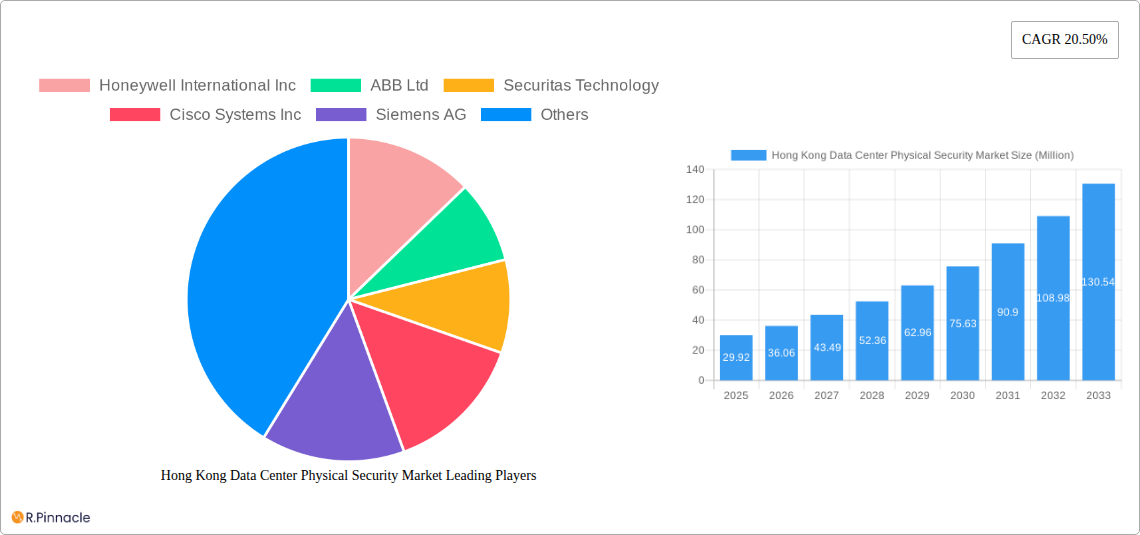
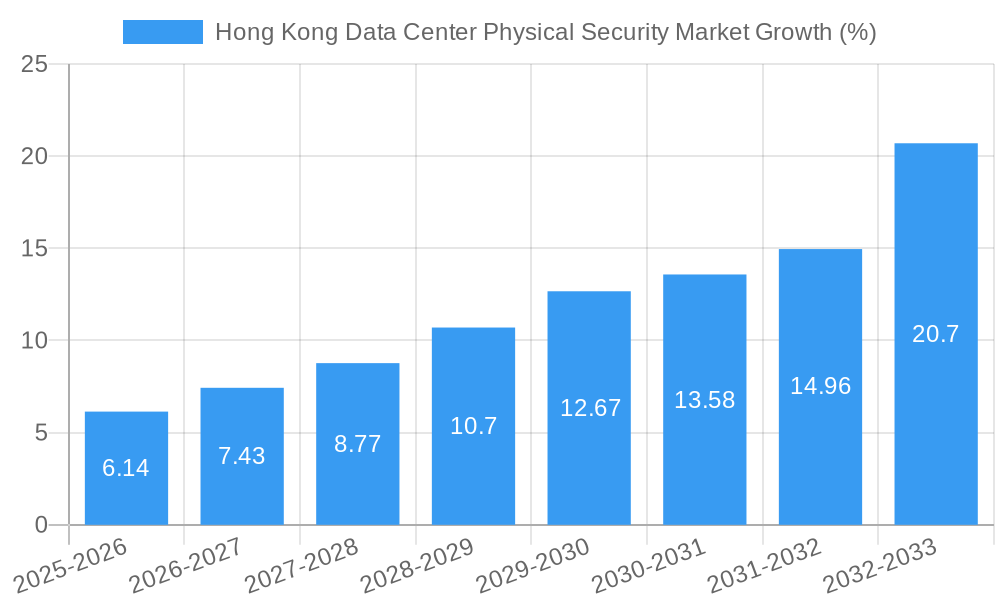
The Hong Kong data center physical security market is experiencing robust growth, projected to reach $29.92 million in 2025 and maintain a Compound Annual Growth Rate (CAGR) of 20.50% from 2025 to 2033. This expansion is driven by several key factors. Firstly, the increasing reliance on data centers by various sectors, including IT & Telecommunications, BFSI (Banking, Financial Services, and Insurance), and the Government, necessitates robust security measures to protect sensitive information and critical infrastructure. Secondly, the rising adoption of advanced technologies like video surveillance, access control solutions, and integrated monitoring systems is fueling market growth. These solutions offer enhanced security capabilities, enabling early threat detection and rapid response times. Furthermore, the growing awareness of cybersecurity threats and stringent data privacy regulations are compelling organizations to invest heavily in advanced physical security solutions. The market is segmented by solution type (video surveillance, access control, other solutions), service type (consulting, professional, other services), and end-user. Video surveillance is expected to remain a dominant segment, given its wide applicability and effectiveness in deterring and detecting intrusions. The professional services segment, including system integration and installation, will likely experience high growth due to the complexity of deploying these advanced security solutions.
The significant growth trajectory of the Hong Kong data center physical security market is expected to continue throughout the forecast period (2025-2033). However, certain challenges could potentially impact this growth. These might include the high initial investment costs associated with implementing comprehensive security systems and a potential skills gap in managing and maintaining these advanced technologies. Nevertheless, the overall outlook remains positive, driven by the increasing demand for data center security, technological advancements, and the strengthening regulatory landscape in Hong Kong promoting data protection. Companies like Honeywell, ABB, Securitas, Cisco, and others are key players competing in this rapidly evolving market, offering a diverse range of solutions and services to meet the varied needs of data center operators. The market's future hinges on the continued adoption of sophisticated security technologies and the increasing prioritization of data security by businesses and government organizations.
Hong Kong Data Center Physical Security Market: A Comprehensive Report (2019-2033)
This comprehensive report provides an in-depth analysis of the Hong Kong Data Center Physical Security Market, offering valuable insights for industry professionals, investors, and strategic decision-makers. Covering the period from 2019 to 2033, with a focus on 2025, this report unveils market dynamics, growth drivers, challenges, and future opportunities. The market is segmented by solution type, service type, and end-user, providing a granular understanding of its diverse landscape. Key players like Honeywell International Inc, ABB Ltd, and Securitas Technology are profiled, highlighting their market positions and strategies.
Hong Kong Data Center Physical Security Market Structure & Innovation Trends
This section analyzes the competitive landscape, innovation drivers, and regulatory influences shaping the Hong Kong Data Center Physical Security Market. The market exhibits a moderately concentrated structure, with the top 5 players holding approximately xx% of the market share in 2025. Innovation is driven by increasing demand for advanced security solutions, stringent data protection regulations, and the rising adoption of IoT and AI technologies. The regulatory framework plays a crucial role, mandating robust security measures for data centers. Product substitutes, such as cloud-based security solutions, are emerging but currently hold a smaller market share (estimated at xx% in 2025). Mergers and acquisitions (M&A) activity has been moderate, with a total deal value of approximately $xx Million in the last five years. Examples include:
- Securitas's five-year agreement with Microsoft (April 2023).
- Strategic partnerships focusing on integrating advanced technologies like biometric access control.
End-user demographics are shifting towards a higher concentration in the IT & Telecommunication and BFSI sectors.
Hong Kong Data Center Physical Security Market Dynamics & Trends
The Hong Kong Data Center Physical Security Market is experiencing robust growth, driven by several key factors. The increasing adoption of cloud computing and the rising number of data centers in Hong Kong are significant market drivers. Technological advancements, including AI-powered surveillance, biometric access control, and advanced threat detection systems, are reshaping the market. Furthermore, increasing awareness of cyber threats and data breaches is fueling demand for enhanced physical security solutions. Consumer preferences are shifting towards integrated and managed security services, requiring providers to offer comprehensive solutions. Competitive dynamics are intense, with major players vying for market share through innovation, strategic partnerships, and acquisitions. The market is projected to grow at a Compound Annual Growth Rate (CAGR) of xx% during the forecast period (2025-2033), with market penetration expected to reach xx% by 2033.
Dominant Regions & Segments in Hong Kong Data Center Physical Security Market
The IT & Telecommunication sector is the dominant end-user segment, driven by the high concentration of data centers within this sector. This is followed by the BFSI sector. Among solution types, Video Surveillance holds the largest market share, followed by Access Control Solutions. Within service types, Professional Services is currently the leading segment.
Key Drivers for Dominant Segments:
- IT & Telecommunication: High concentration of data centers, stringent data security regulations.
- BFSI: Strict regulatory compliance requirements, protection of sensitive financial data.
- Video Surveillance: Cost-effectiveness, ease of implementation, advanced analytics capabilities.
- Access Control Solutions: Enhanced security, improved access management, integration with other security systems.
- Professional Services: Expertise required for complex security deployments, ongoing maintenance & support.
Hong Kong Data Center Physical Security Market Product Innovations
Recent innovations focus on enhancing security with AI and biometric technologies. For example, the integration of fingerprint scanning smart cards with access control systems offers greater security and convenience. The market sees increasing integration of technologies like AI-driven video analytics for threat detection and predictive maintenance. These solutions offer enhanced security, improved efficiency, and reduced operational costs, making them highly attractive to data center operators.
Report Scope & Segmentation Analysis
This report segments the Hong Kong Data Center Physical Security Market across several key parameters:
By Solution Type: Video Surveillance, Access Control Solutions, Other Solution Types (Mantraps, Fences, and Monitoring Solutions). Each segment presents unique growth trajectories, with Video Surveillance showing high growth due to technological advancements.
By Service Type: Consulting Services, Professional Services, Other Service Types (System Integration Services). Professional Services is projected to witness significant growth driven by the demand for customized security solutions.
By End User: IT & Telecommunication, BFSI, Government, Healthcare, Other End Users. The IT & Telecommunication sector remains the key driver, followed by the BFSI sector due to stringent regulatory requirements.
Key Drivers of Hong Kong Data Center Physical Security Market Growth
The market's growth is propelled by the increasing adoption of cloud computing, stringent data privacy regulations, the rising number of data centers, and the growing demand for robust security measures. Technological advancements, including AI-powered surveillance and biometric access systems, are further driving the market's expansion.
Challenges in the Hong Kong Data Center Physical Security Market Sector
Key challenges include high initial investment costs, the complexity of integrating various security systems, and the shortage of skilled cybersecurity professionals. Additionally, ensuring compliance with evolving data privacy regulations and mitigating supply chain disruptions pose significant challenges. These factors contribute to a slower adoption rate in some market segments and restrict overall market growth. Quantifiable impact is difficult to assign but likely restricts market growth by approximately xx% annually.
Emerging Opportunities in Hong Kong Data Center Physical Security Market
Emerging opportunities include the integration of IoT devices into security systems, the adoption of blockchain technology for enhanced security, and the growing demand for managed security services. Furthermore, the expanding adoption of AI-powered threat detection and predictive analytics will create lucrative opportunities for vendors in the coming years. The shift towards cloud-based security solutions also presents a significant opportunity.
Leading Players in the Hong Kong Data Center Physical Security Market Market
- Honeywell International Inc
- ABB Ltd
- Securitas Technology
- Cisco Systems Inc
- Siemens AG
- Johnson Controls
- Convergint Technologies LLC
- Schneider Electric
- Hangzhou Hikvision Digital Technology Co Ltd
- Bosch Sicherheitssysteme GmbH
- Axis Communications AB
- Dahua Technology Co Ltd
Key Developments in Hong Kong Data Center Physical Security Market Industry
- October 2023: Zwipe partnered with Schneider Electric’s Security Solutions Group to integrate fingerprint-scanning smart cards into Schneider Electric's security platforms, impacting the access control solutions segment.
- April 2023: Securitas signed a five-year agreement with Microsoft to provide comprehensive data center security across 31 countries, significantly impacting the market share of integrated security services.
Future Outlook for Hong Kong Data Center Physical Security Market Market
The Hong Kong Data Center Physical Security Market is poised for continued growth, driven by technological advancements, increasing cyber threats, and the expansion of data center infrastructure. The integration of AI and IoT technologies, coupled with the rising demand for managed security services, will create significant growth opportunities for market players. Strategic partnerships and acquisitions will further shape the market landscape, leading to a more consolidated yet innovative market in the coming years.
Hong Kong Data Center Physical Security Market Segmentation
-
1. Solution Type
- 1.1. Video Surveillance
- 1.2. Access Control Solutions
- 1.3. Other
-
2. Service Type
- 2.1. Consulting Services
- 2.2. Professional Services
- 2.3. Other Service Types (System Integration Services)
-
3. End User
- 3.1. IT & Telecommunication
- 3.2. BFSI
- 3.3. Government
- 3.4. Healthcare
- 3.5. Other End Users
Hong Kong Data Center Physical Security Market Segmentation By Geography
-
1. North America
- 1.1. United States
- 1.2. Canada
- 1.3. Mexico
-
2. South America
- 2.1. Brazil
- 2.2. Argentina
- 2.3. Rest of South America
-
3. Europe
- 3.1. United Kingdom
- 3.2. Germany
- 3.3. France
- 3.4. Italy
- 3.5. Spain
- 3.6. Russia
- 3.7. Benelux
- 3.8. Nordics
- 3.9. Rest of Europe
-
4. Middle East & Africa
- 4.1. Turkey
- 4.2. Israel
- 4.3. GCC
- 4.4. North Africa
- 4.5. South Africa
- 4.6. Rest of Middle East & Africa
-
5. Asia Pacific
- 5.1. China
- 5.2. India
- 5.3. Japan
- 5.4. South Korea
- 5.5. ASEAN
- 5.6. Oceania
- 5.7. Rest of Asia Pacific
Hong Kong Data Center Physical Security Market REPORT HIGHLIGHTS
| Aspects | Details |
|---|---|
| Study Period | 2019-2033 |
| Base Year | 2024 |
| Estimated Year | 2025 |
| Forecast Period | 2025-2033 |
| Historical Period | 2019-2024 |
| Growth Rate | CAGR of 20.50% from 2019-2033 |
| Segmentation |
|
Table of Contents
- 1. Introduction
- 1.1. Research Scope
- 1.2. Market Segmentation
- 1.3. Research Methodology
- 1.4. Definitions and Assumptions
- 2. Executive Summary
- 2.1. Introduction
- 3. Market Dynamics
- 3.1. Introduction
- 3.2. Market Drivers
- 3.2.1. Growing Innovation in Video Surveillance Among the Market Players; Increasing Data Center Projects
- 3.3. Market Restrains
- 3.3.1. The High Costs Associated with Physical Security Infrastructure
- 3.4. Market Trends
- 3.4.1. Video Surveillance is Anticipated to be the Largest Segment
- 4. Market Factor Analysis
- 4.1. Porters Five Forces
- 4.2. Supply/Value Chain
- 4.3. PESTEL analysis
- 4.4. Market Entropy
- 4.5. Patent/Trademark Analysis
- 5. Global Hong Kong Data Center Physical Security Market Analysis, Insights and Forecast, 2019-2031
- 5.1. Market Analysis, Insights and Forecast - by Solution Type
- 5.1.1. Video Surveillance
- 5.1.2. Access Control Solutions
- 5.1.3. Other
- 5.2. Market Analysis, Insights and Forecast - by Service Type
- 5.2.1. Consulting Services
- 5.2.2. Professional Services
- 5.2.3. Other Service Types (System Integration Services)
- 5.3. Market Analysis, Insights and Forecast - by End User
- 5.3.1. IT & Telecommunication
- 5.3.2. BFSI
- 5.3.3. Government
- 5.3.4. Healthcare
- 5.3.5. Other End Users
- 5.4. Market Analysis, Insights and Forecast - by Region
- 5.4.1. North America
- 5.4.2. South America
- 5.4.3. Europe
- 5.4.4. Middle East & Africa
- 5.4.5. Asia Pacific
- 5.1. Market Analysis, Insights and Forecast - by Solution Type
- 6. North America Hong Kong Data Center Physical Security Market Analysis, Insights and Forecast, 2019-2031
- 6.1. Market Analysis, Insights and Forecast - by Solution Type
- 6.1.1. Video Surveillance
- 6.1.2. Access Control Solutions
- 6.1.3. Other
- 6.2. Market Analysis, Insights and Forecast - by Service Type
- 6.2.1. Consulting Services
- 6.2.2. Professional Services
- 6.2.3. Other Service Types (System Integration Services)
- 6.3. Market Analysis, Insights and Forecast - by End User
- 6.3.1. IT & Telecommunication
- 6.3.2. BFSI
- 6.3.3. Government
- 6.3.4. Healthcare
- 6.3.5. Other End Users
- 6.1. Market Analysis, Insights and Forecast - by Solution Type
- 7. South America Hong Kong Data Center Physical Security Market Analysis, Insights and Forecast, 2019-2031
- 7.1. Market Analysis, Insights and Forecast - by Solution Type
- 7.1.1. Video Surveillance
- 7.1.2. Access Control Solutions
- 7.1.3. Other
- 7.2. Market Analysis, Insights and Forecast - by Service Type
- 7.2.1. Consulting Services
- 7.2.2. Professional Services
- 7.2.3. Other Service Types (System Integration Services)
- 7.3. Market Analysis, Insights and Forecast - by End User
- 7.3.1. IT & Telecommunication
- 7.3.2. BFSI
- 7.3.3. Government
- 7.3.4. Healthcare
- 7.3.5. Other End Users
- 7.1. Market Analysis, Insights and Forecast - by Solution Type
- 8. Europe Hong Kong Data Center Physical Security Market Analysis, Insights and Forecast, 2019-2031
- 8.1. Market Analysis, Insights and Forecast - by Solution Type
- 8.1.1. Video Surveillance
- 8.1.2. Access Control Solutions
- 8.1.3. Other
- 8.2. Market Analysis, Insights and Forecast - by Service Type
- 8.2.1. Consulting Services
- 8.2.2. Professional Services
- 8.2.3. Other Service Types (System Integration Services)
- 8.3. Market Analysis, Insights and Forecast - by End User
- 8.3.1. IT & Telecommunication
- 8.3.2. BFSI
- 8.3.3. Government
- 8.3.4. Healthcare
- 8.3.5. Other End Users
- 8.1. Market Analysis, Insights and Forecast - by Solution Type
- 9. Middle East & Africa Hong Kong Data Center Physical Security Market Analysis, Insights and Forecast, 2019-2031
- 9.1. Market Analysis, Insights and Forecast - by Solution Type
- 9.1.1. Video Surveillance
- 9.1.2. Access Control Solutions
- 9.1.3. Other
- 9.2. Market Analysis, Insights and Forecast - by Service Type
- 9.2.1. Consulting Services
- 9.2.2. Professional Services
- 9.2.3. Other Service Types (System Integration Services)
- 9.3. Market Analysis, Insights and Forecast - by End User
- 9.3.1. IT & Telecommunication
- 9.3.2. BFSI
- 9.3.3. Government
- 9.3.4. Healthcare
- 9.3.5. Other End Users
- 9.1. Market Analysis, Insights and Forecast - by Solution Type
- 10. Asia Pacific Hong Kong Data Center Physical Security Market Analysis, Insights and Forecast, 2019-2031
- 10.1. Market Analysis, Insights and Forecast - by Solution Type
- 10.1.1. Video Surveillance
- 10.1.2. Access Control Solutions
- 10.1.3. Other
- 10.2. Market Analysis, Insights and Forecast - by Service Type
- 10.2.1. Consulting Services
- 10.2.2. Professional Services
- 10.2.3. Other Service Types (System Integration Services)
- 10.3. Market Analysis, Insights and Forecast - by End User
- 10.3.1. IT & Telecommunication
- 10.3.2. BFSI
- 10.3.3. Government
- 10.3.4. Healthcare
- 10.3.5. Other End Users
- 10.1. Market Analysis, Insights and Forecast - by Solution Type
- 11. Competitive Analysis
- 11.1. Global Market Share Analysis 2024
- 11.2. Company Profiles
- 11.2.1 Honeywell International Inc
- 11.2.1.1. Overview
- 11.2.1.2. Products
- 11.2.1.3. SWOT Analysis
- 11.2.1.4. Recent Developments
- 11.2.1.5. Financials (Based on Availability)
- 11.2.2 ABB Ltd
- 11.2.2.1. Overview
- 11.2.2.2. Products
- 11.2.2.3. SWOT Analysis
- 11.2.2.4. Recent Developments
- 11.2.2.5. Financials (Based on Availability)
- 11.2.3 Securitas Technology
- 11.2.3.1. Overview
- 11.2.3.2. Products
- 11.2.3.3. SWOT Analysis
- 11.2.3.4. Recent Developments
- 11.2.3.5. Financials (Based on Availability)
- 11.2.4 Cisco Systems Inc
- 11.2.4.1. Overview
- 11.2.4.2. Products
- 11.2.4.3. SWOT Analysis
- 11.2.4.4. Recent Developments
- 11.2.4.5. Financials (Based on Availability)
- 11.2.5 Siemens AG
- 11.2.5.1. Overview
- 11.2.5.2. Products
- 11.2.5.3. SWOT Analysis
- 11.2.5.4. Recent Developments
- 11.2.5.5. Financials (Based on Availability)
- 11.2.6 Johnson Controls
- 11.2.6.1. Overview
- 11.2.6.2. Products
- 11.2.6.3. SWOT Analysis
- 11.2.6.4. Recent Developments
- 11.2.6.5. Financials (Based on Availability)
- 11.2.7 Convergint Technologies LLC
- 11.2.7.1. Overview
- 11.2.7.2. Products
- 11.2.7.3. SWOT Analysis
- 11.2.7.4. Recent Developments
- 11.2.7.5. Financials (Based on Availability)
- 11.2.8 Schneider Electric
- 11.2.8.1. Overview
- 11.2.8.2. Products
- 11.2.8.3. SWOT Analysis
- 11.2.8.4. Recent Developments
- 11.2.8.5. Financials (Based on Availability)
- 11.2.9 Hangzhou Hikvision Digital Technology Co Ltd
- 11.2.9.1. Overview
- 11.2.9.2. Products
- 11.2.9.3. SWOT Analysis
- 11.2.9.4. Recent Developments
- 11.2.9.5. Financials (Based on Availability)
- 11.2.10 Bosch Sicherheitssysteme GmbH
- 11.2.10.1. Overview
- 11.2.10.2. Products
- 11.2.10.3. SWOT Analysis
- 11.2.10.4. Recent Developments
- 11.2.10.5. Financials (Based on Availability)
- 11.2.11 Axis Communications AB
- 11.2.11.1. Overview
- 11.2.11.2. Products
- 11.2.11.3. SWOT Analysis
- 11.2.11.4. Recent Developments
- 11.2.11.5. Financials (Based on Availability)
- 11.2.12 Dahua Technology Co Ltd
- 11.2.12.1. Overview
- 11.2.12.2. Products
- 11.2.12.3. SWOT Analysis
- 11.2.12.4. Recent Developments
- 11.2.12.5. Financials (Based on Availability)
- 11.2.1 Honeywell International Inc
List of Figures
- Figure 1: Global Hong Kong Data Center Physical Security Market Revenue Breakdown (Million, %) by Region 2024 & 2032
- Figure 2: Hong Kong Hong Kong Data Center Physical Security Market Revenue (Million), by Country 2024 & 2032
- Figure 3: Hong Kong Hong Kong Data Center Physical Security Market Revenue Share (%), by Country 2024 & 2032
- Figure 4: North America Hong Kong Data Center Physical Security Market Revenue (Million), by Solution Type 2024 & 2032
- Figure 5: North America Hong Kong Data Center Physical Security Market Revenue Share (%), by Solution Type 2024 & 2032
- Figure 6: North America Hong Kong Data Center Physical Security Market Revenue (Million), by Service Type 2024 & 2032
- Figure 7: North America Hong Kong Data Center Physical Security Market Revenue Share (%), by Service Type 2024 & 2032
- Figure 8: North America Hong Kong Data Center Physical Security Market Revenue (Million), by End User 2024 & 2032
- Figure 9: North America Hong Kong Data Center Physical Security Market Revenue Share (%), by End User 2024 & 2032
- Figure 10: North America Hong Kong Data Center Physical Security Market Revenue (Million), by Country 2024 & 2032
- Figure 11: North America Hong Kong Data Center Physical Security Market Revenue Share (%), by Country 2024 & 2032
- Figure 12: South America Hong Kong Data Center Physical Security Market Revenue (Million), by Solution Type 2024 & 2032
- Figure 13: South America Hong Kong Data Center Physical Security Market Revenue Share (%), by Solution Type 2024 & 2032
- Figure 14: South America Hong Kong Data Center Physical Security Market Revenue (Million), by Service Type 2024 & 2032
- Figure 15: South America Hong Kong Data Center Physical Security Market Revenue Share (%), by Service Type 2024 & 2032
- Figure 16: South America Hong Kong Data Center Physical Security Market Revenue (Million), by End User 2024 & 2032
- Figure 17: South America Hong Kong Data Center Physical Security Market Revenue Share (%), by End User 2024 & 2032
- Figure 18: South America Hong Kong Data Center Physical Security Market Revenue (Million), by Country 2024 & 2032
- Figure 19: South America Hong Kong Data Center Physical Security Market Revenue Share (%), by Country 2024 & 2032
- Figure 20: Europe Hong Kong Data Center Physical Security Market Revenue (Million), by Solution Type 2024 & 2032
- Figure 21: Europe Hong Kong Data Center Physical Security Market Revenue Share (%), by Solution Type 2024 & 2032
- Figure 22: Europe Hong Kong Data Center Physical Security Market Revenue (Million), by Service Type 2024 & 2032
- Figure 23: Europe Hong Kong Data Center Physical Security Market Revenue Share (%), by Service Type 2024 & 2032
- Figure 24: Europe Hong Kong Data Center Physical Security Market Revenue (Million), by End User 2024 & 2032
- Figure 25: Europe Hong Kong Data Center Physical Security Market Revenue Share (%), by End User 2024 & 2032
- Figure 26: Europe Hong Kong Data Center Physical Security Market Revenue (Million), by Country 2024 & 2032
- Figure 27: Europe Hong Kong Data Center Physical Security Market Revenue Share (%), by Country 2024 & 2032
- Figure 28: Middle East & Africa Hong Kong Data Center Physical Security Market Revenue (Million), by Solution Type 2024 & 2032
- Figure 29: Middle East & Africa Hong Kong Data Center Physical Security Market Revenue Share (%), by Solution Type 2024 & 2032
- Figure 30: Middle East & Africa Hong Kong Data Center Physical Security Market Revenue (Million), by Service Type 2024 & 2032
- Figure 31: Middle East & Africa Hong Kong Data Center Physical Security Market Revenue Share (%), by Service Type 2024 & 2032
- Figure 32: Middle East & Africa Hong Kong Data Center Physical Security Market Revenue (Million), by End User 2024 & 2032
- Figure 33: Middle East & Africa Hong Kong Data Center Physical Security Market Revenue Share (%), by End User 2024 & 2032
- Figure 34: Middle East & Africa Hong Kong Data Center Physical Security Market Revenue (Million), by Country 2024 & 2032
- Figure 35: Middle East & Africa Hong Kong Data Center Physical Security Market Revenue Share (%), by Country 2024 & 2032
- Figure 36: Asia Pacific Hong Kong Data Center Physical Security Market Revenue (Million), by Solution Type 2024 & 2032
- Figure 37: Asia Pacific Hong Kong Data Center Physical Security Market Revenue Share (%), by Solution Type 2024 & 2032
- Figure 38: Asia Pacific Hong Kong Data Center Physical Security Market Revenue (Million), by Service Type 2024 & 2032
- Figure 39: Asia Pacific Hong Kong Data Center Physical Security Market Revenue Share (%), by Service Type 2024 & 2032
- Figure 40: Asia Pacific Hong Kong Data Center Physical Security Market Revenue (Million), by End User 2024 & 2032
- Figure 41: Asia Pacific Hong Kong Data Center Physical Security Market Revenue Share (%), by End User 2024 & 2032
- Figure 42: Asia Pacific Hong Kong Data Center Physical Security Market Revenue (Million), by Country 2024 & 2032
- Figure 43: Asia Pacific Hong Kong Data Center Physical Security Market Revenue Share (%), by Country 2024 & 2032
List of Tables
- Table 1: Global Hong Kong Data Center Physical Security Market Revenue Million Forecast, by Region 2019 & 2032
- Table 2: Global Hong Kong Data Center Physical Security Market Revenue Million Forecast, by Solution Type 2019 & 2032
- Table 3: Global Hong Kong Data Center Physical Security Market Revenue Million Forecast, by Service Type 2019 & 2032
- Table 4: Global Hong Kong Data Center Physical Security Market Revenue Million Forecast, by End User 2019 & 2032
- Table 5: Global Hong Kong Data Center Physical Security Market Revenue Million Forecast, by Region 2019 & 2032
- Table 6: Global Hong Kong Data Center Physical Security Market Revenue Million Forecast, by Country 2019 & 2032
- Table 7: Global Hong Kong Data Center Physical Security Market Revenue Million Forecast, by Solution Type 2019 & 2032
- Table 8: Global Hong Kong Data Center Physical Security Market Revenue Million Forecast, by Service Type 2019 & 2032
- Table 9: Global Hong Kong Data Center Physical Security Market Revenue Million Forecast, by End User 2019 & 2032
- Table 10: Global Hong Kong Data Center Physical Security Market Revenue Million Forecast, by Country 2019 & 2032
- Table 11: United States Hong Kong Data Center Physical Security Market Revenue (Million) Forecast, by Application 2019 & 2032
- Table 12: Canada Hong Kong Data Center Physical Security Market Revenue (Million) Forecast, by Application 2019 & 2032
- Table 13: Mexico Hong Kong Data Center Physical Security Market Revenue (Million) Forecast, by Application 2019 & 2032
- Table 14: Global Hong Kong Data Center Physical Security Market Revenue Million Forecast, by Solution Type 2019 & 2032
- Table 15: Global Hong Kong Data Center Physical Security Market Revenue Million Forecast, by Service Type 2019 & 2032
- Table 16: Global Hong Kong Data Center Physical Security Market Revenue Million Forecast, by End User 2019 & 2032
- Table 17: Global Hong Kong Data Center Physical Security Market Revenue Million Forecast, by Country 2019 & 2032
- Table 18: Brazil Hong Kong Data Center Physical Security Market Revenue (Million) Forecast, by Application 2019 & 2032
- Table 19: Argentina Hong Kong Data Center Physical Security Market Revenue (Million) Forecast, by Application 2019 & 2032
- Table 20: Rest of South America Hong Kong Data Center Physical Security Market Revenue (Million) Forecast, by Application 2019 & 2032
- Table 21: Global Hong Kong Data Center Physical Security Market Revenue Million Forecast, by Solution Type 2019 & 2032
- Table 22: Global Hong Kong Data Center Physical Security Market Revenue Million Forecast, by Service Type 2019 & 2032
- Table 23: Global Hong Kong Data Center Physical Security Market Revenue Million Forecast, by End User 2019 & 2032
- Table 24: Global Hong Kong Data Center Physical Security Market Revenue Million Forecast, by Country 2019 & 2032
- Table 25: United Kingdom Hong Kong Data Center Physical Security Market Revenue (Million) Forecast, by Application 2019 & 2032
- Table 26: Germany Hong Kong Data Center Physical Security Market Revenue (Million) Forecast, by Application 2019 & 2032
- Table 27: France Hong Kong Data Center Physical Security Market Revenue (Million) Forecast, by Application 2019 & 2032
- Table 28: Italy Hong Kong Data Center Physical Security Market Revenue (Million) Forecast, by Application 2019 & 2032
- Table 29: Spain Hong Kong Data Center Physical Security Market Revenue (Million) Forecast, by Application 2019 & 2032
- Table 30: Russia Hong Kong Data Center Physical Security Market Revenue (Million) Forecast, by Application 2019 & 2032
- Table 31: Benelux Hong Kong Data Center Physical Security Market Revenue (Million) Forecast, by Application 2019 & 2032
- Table 32: Nordics Hong Kong Data Center Physical Security Market Revenue (Million) Forecast, by Application 2019 & 2032
- Table 33: Rest of Europe Hong Kong Data Center Physical Security Market Revenue (Million) Forecast, by Application 2019 & 2032
- Table 34: Global Hong Kong Data Center Physical Security Market Revenue Million Forecast, by Solution Type 2019 & 2032
- Table 35: Global Hong Kong Data Center Physical Security Market Revenue Million Forecast, by Service Type 2019 & 2032
- Table 36: Global Hong Kong Data Center Physical Security Market Revenue Million Forecast, by End User 2019 & 2032
- Table 37: Global Hong Kong Data Center Physical Security Market Revenue Million Forecast, by Country 2019 & 2032
- Table 38: Turkey Hong Kong Data Center Physical Security Market Revenue (Million) Forecast, by Application 2019 & 2032
- Table 39: Israel Hong Kong Data Center Physical Security Market Revenue (Million) Forecast, by Application 2019 & 2032
- Table 40: GCC Hong Kong Data Center Physical Security Market Revenue (Million) Forecast, by Application 2019 & 2032
- Table 41: North Africa Hong Kong Data Center Physical Security Market Revenue (Million) Forecast, by Application 2019 & 2032
- Table 42: South Africa Hong Kong Data Center Physical Security Market Revenue (Million) Forecast, by Application 2019 & 2032
- Table 43: Rest of Middle East & Africa Hong Kong Data Center Physical Security Market Revenue (Million) Forecast, by Application 2019 & 2032
- Table 44: Global Hong Kong Data Center Physical Security Market Revenue Million Forecast, by Solution Type 2019 & 2032
- Table 45: Global Hong Kong Data Center Physical Security Market Revenue Million Forecast, by Service Type 2019 & 2032
- Table 46: Global Hong Kong Data Center Physical Security Market Revenue Million Forecast, by End User 2019 & 2032
- Table 47: Global Hong Kong Data Center Physical Security Market Revenue Million Forecast, by Country 2019 & 2032
- Table 48: China Hong Kong Data Center Physical Security Market Revenue (Million) Forecast, by Application 2019 & 2032
- Table 49: India Hong Kong Data Center Physical Security Market Revenue (Million) Forecast, by Application 2019 & 2032
- Table 50: Japan Hong Kong Data Center Physical Security Market Revenue (Million) Forecast, by Application 2019 & 2032
- Table 51: South Korea Hong Kong Data Center Physical Security Market Revenue (Million) Forecast, by Application 2019 & 2032
- Table 52: ASEAN Hong Kong Data Center Physical Security Market Revenue (Million) Forecast, by Application 2019 & 2032
- Table 53: Oceania Hong Kong Data Center Physical Security Market Revenue (Million) Forecast, by Application 2019 & 2032
- Table 54: Rest of Asia Pacific Hong Kong Data Center Physical Security Market Revenue (Million) Forecast, by Application 2019 & 2032
Frequently Asked Questions
1. What is the projected Compound Annual Growth Rate (CAGR) of the Hong Kong Data Center Physical Security Market?
The projected CAGR is approximately 20.50%.
2. Which companies are prominent players in the Hong Kong Data Center Physical Security Market?
Key companies in the market include Honeywell International Inc, ABB Ltd, Securitas Technology, Cisco Systems Inc, Siemens AG, Johnson Controls, Convergint Technologies LLC, Schneider Electric, Hangzhou Hikvision Digital Technology Co Ltd, Bosch Sicherheitssysteme GmbH, Axis Communications AB, Dahua Technology Co Ltd.
3. What are the main segments of the Hong Kong Data Center Physical Security Market?
The market segments include Solution Type, Service Type, End User.
4. Can you provide details about the market size?
The market size is estimated to be USD 29.92 Million as of 2022.
5. What are some drivers contributing to market growth?
Growing Innovation in Video Surveillance Among the Market Players; Increasing Data Center Projects.
6. What are the notable trends driving market growth?
Video Surveillance is Anticipated to be the Largest Segment.
7. Are there any restraints impacting market growth?
The High Costs Associated with Physical Security Infrastructure.
8. Can you provide examples of recent developments in the market?
October 2023: Zwipe partnered with Schneider Electric’s Security Solutions Group. The France-based multinational Schneider Electric plans to introduce the Zwipe Access fingerprint-scanning smart card to its clientele. This card will be integrated with Schneider Electric’s Continuum and Security Expert platforms, serving a client base from sectors including airports, transportation, healthcare, data centers, and more.
9. What pricing options are available for accessing the report?
Pricing options include single-user, multi-user, and enterprise licenses priced at USD 3800, USD 4500, and USD 5800 respectively.
10. Is the market size provided in terms of value or volume?
The market size is provided in terms of value, measured in Million.
11. Are there any specific market keywords associated with the report?
Yes, the market keyword associated with the report is "Hong Kong Data Center Physical Security Market," which aids in identifying and referencing the specific market segment covered.
12. How do I determine which pricing option suits my needs best?
The pricing options vary based on user requirements and access needs. Individual users may opt for single-user licenses, while businesses requiring broader access may choose multi-user or enterprise licenses for cost-effective access to the report.
13. Are there any additional resources or data provided in the Hong Kong Data Center Physical Security Market report?
While the report offers comprehensive insights, it's advisable to review the specific contents or supplementary materials provided to ascertain if additional resources or data are available.
14. How can I stay updated on further developments or reports in the Hong Kong Data Center Physical Security Market?
To stay informed about further developments, trends, and reports in the Hong Kong Data Center Physical Security Market, consider subscribing to industry newsletters, following relevant companies and organizations, or regularly checking reputable industry news sources and publications.
Methodology
Step 1 - Identification of Relevant Samples Size from Population Database


Step 2 - Approaches for Defining Global Market Size (Value, Volume* & Price*)

Note*: In applicable scenarios
Step 3 - Data Sources
Primary Research
- Web Analytics
- Survey Reports
- Research Institute
- Latest Research Reports
- Opinion Leaders
Secondary Research
- Annual Reports
- White Paper
- Latest Press Release
- Industry Association
- Paid Database
- Investor Presentations

Step 4 - Data Triangulation
Involves using different sources of information in order to increase the validity of a study
These sources are likely to be stakeholders in a program - participants, other researchers, program staff, other community members, and so on.
Then we put all data in single framework & apply various statistical tools to find out the dynamic on the market.
During the analysis stage, feedback from the stakeholder groups would be compared to determine areas of agreement as well as areas of divergence


