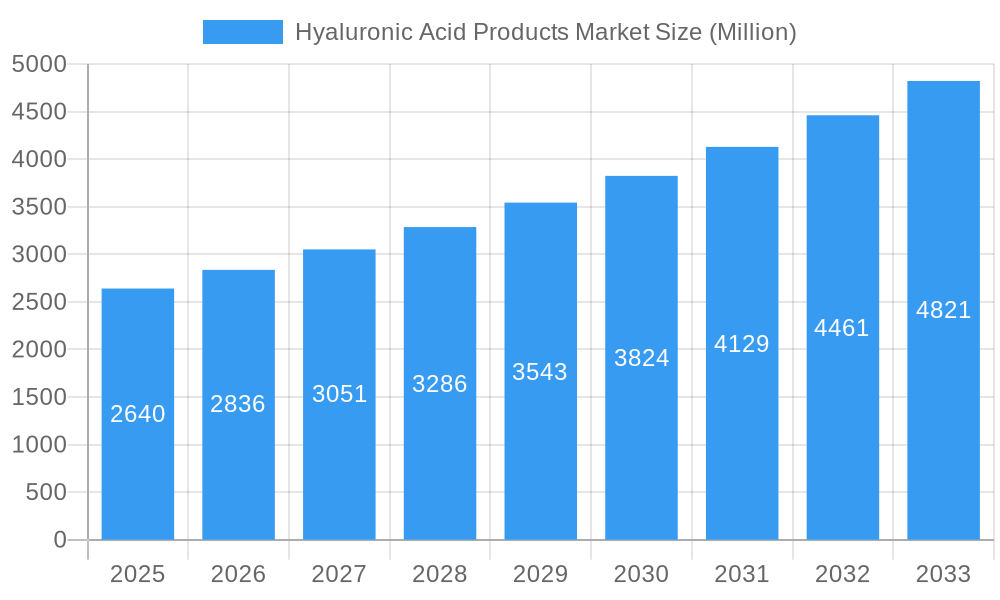
Key Insights
The global Hyaluronic Acid (HA) products market is experiencing robust growth, projected to reach a market size of $2.64 billion in 2025 and maintain a Compound Annual Growth Rate (CAGR) of 7.46% from 2025 to 2033. This expansion is driven by several key factors. The increasing prevalence of aging-related skin concerns fuels demand for HA-based cosmetics and skincare products. Simultaneously, the pharmaceutical industry's adoption of HA for drug delivery systems and treatments for osteoarthritis and other conditions contributes significantly to market growth. Furthermore, the growing awareness of HA's health benefits, including joint lubrication and hydration, is driving its increased use in dietary supplements. The market segmentation by application (dietary supplements, pharmaceuticals, and cosmetics) reveals dynamic growth across each sector, with cosmetics currently dominating due to the widespread popularity of anti-aging and moisturizing products. Geographic analysis indicates strong market presence in North America and Europe, driven by high consumer spending and advanced healthcare infrastructure. However, the Asia-Pacific region is expected to witness the fastest growth rate in the coming years, fueled by increasing disposable incomes and rising demand for aesthetic treatments and health supplements.
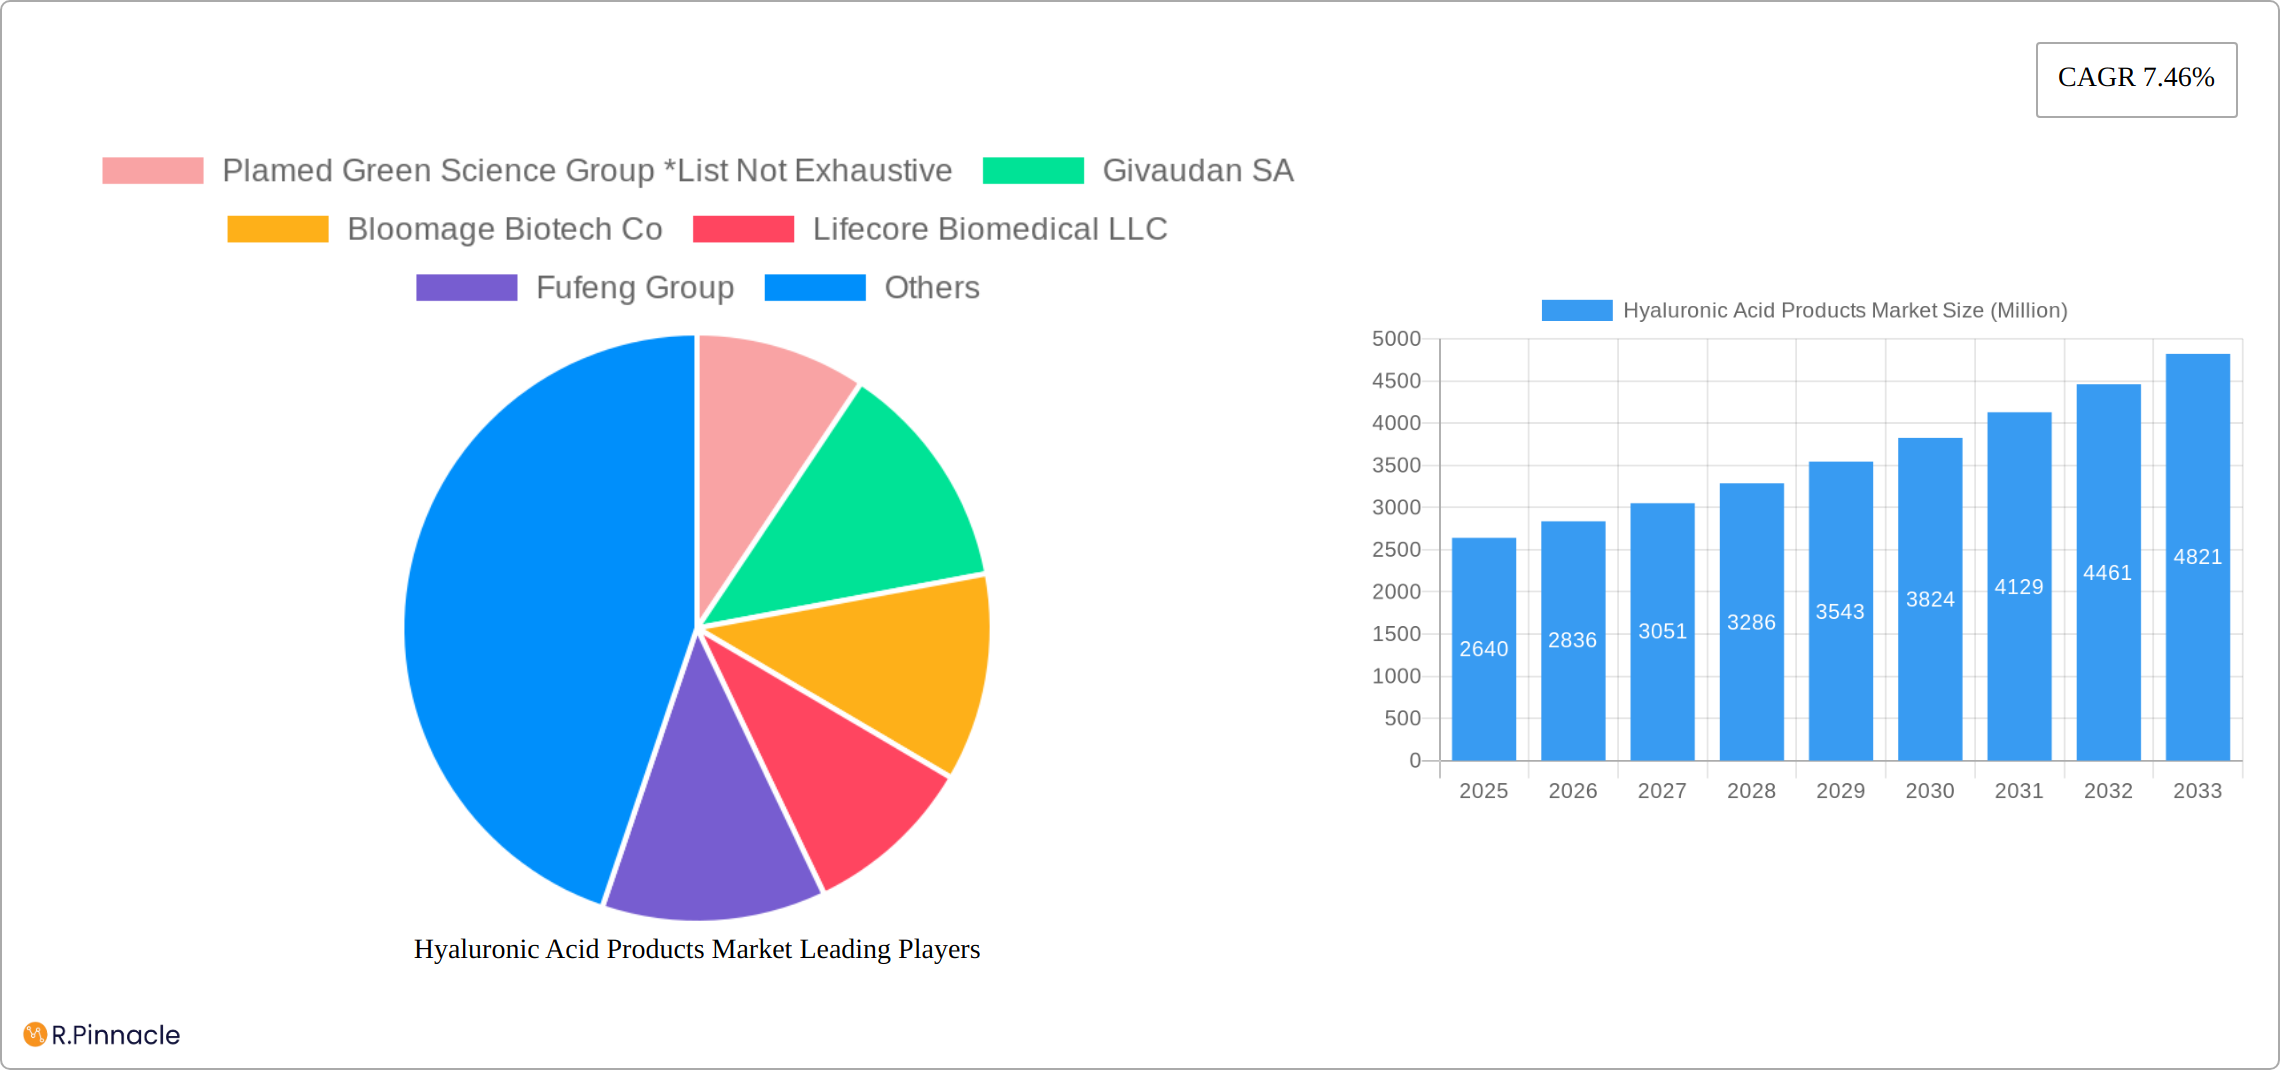
Hyaluronic Acid Products Market Market Size (In Billion)
Competition within the HA products market is intense, with a mix of large multinational corporations like Givaudan SA and DSM, and smaller specialized companies like Plamed Green Science Group. These companies are investing heavily in research and development to improve HA production methods, enhance product efficacy, and develop innovative applications. The market faces some challenges including fluctuating raw material prices and stringent regulatory approvals for pharmaceutical applications. Nonetheless, the overall market outlook remains positive, with continued growth driven by technological advancements, increasing consumer awareness, and expanding applications across diverse industries. The strategic focus on innovation and expansion into emerging markets will be crucial for companies to maintain a competitive edge in this dynamic sector.
Hyaluronic Acid Products Market Company Market Share
Hyaluronic Acid Products Market: A Comprehensive Report (2019-2033)
This in-depth report provides a comprehensive analysis of the Hyaluronic Acid Products Market, offering valuable insights for industry professionals, investors, and stakeholders. With a focus on market structure, innovation trends, and future growth projections, this report covers the period from 2019 to 2033, utilizing 2025 as the base year. The report projects a market value reaching xx Million by 2033, fueled by increasing demand across diverse applications. This report is meticulously researched and requires no further modification.
Hyaluronic Acid Products Market Structure & Innovation Trends
The Hyaluronic Acid Products Market exhibits a moderately concentrated structure, with key players such as Bloomage Biotech Co., Givaudan SA, and Koninklijke DSM NV holding significant market share. The exact market share distribution is detailed within the full report, along with an analysis of recent mergers and acquisitions (M&A) activity. While precise M&A deal values are confidential and vary widely, the report provides a qualitative assessment of their impact on market consolidation. Innovation is driven by the pursuit of higher efficacy, improved biocompatibility, and the development of novel delivery systems. Regulatory frameworks, varying across different geographical regions, impact product approvals and market access. The market faces competition from emerging substitutes, primarily focusing on alternative humectants, but hyaluronic acid's unique properties maintain its leading position. End-user demographics are expanding, with increasing demand from the cosmetic and pharmaceutical sectors driving growth.
- Market Concentration: Moderate, with key players holding significant market shares (detailed in the report).
- Innovation Drivers: Enhanced efficacy, biocompatibility, novel delivery systems.
- Regulatory Landscape: Varying by region, influencing product approvals.
- Substitutes: Emerging alternatives, but HA maintains its dominance.
- M&A Activity: Significant activity impacting market consolidation (qualitative assessment provided).
Hyaluronic Acid Products Market Dynamics & Trends
The Hyaluronic Acid Products Market is experiencing robust growth, driven by a Compound Annual Growth Rate (CAGR) of xx% during the forecast period (2025-2033). This growth is fueled by the increasing demand for cosmetic and pharmaceutical applications, coupled with advancements in production technologies that improve efficiency and reduce costs. Technological disruptions, such as the development of new hyaluronic acid derivatives with enhanced properties, are further accelerating market expansion. Consumer preferences are shifting towards natural and sustainable products, pushing manufacturers to adopt eco-friendly production methods. Competitive dynamics are intense, with major players investing heavily in research and development to maintain their market positions. Market penetration is high in developed economies, but significant growth potential remains in emerging markets.
Dominant Regions & Segments in Hyaluronic Acid Products Market
The report identifies [Region Name] as the leading region in the Hyaluronic Acid Products Market, driven by factors such as [specific economic policies, infrastructure details]. Detailed analysis is provided on a country level within the full report.
By Application:
- Cosmetics Industry: High growth due to increased consumer spending on skincare and anti-aging products, and expanding product categories for HA application.
- Pharmaceutical Industry: Steady growth, driven by HA's applications in drug delivery systems and wound healing.
- Dietary Supplements: Moderate growth driven by increasing awareness of HA's health benefits.
Further segment breakdown and detailed analysis of individual segments are provided in the complete report.
Hyaluronic Acid Products Market Product Innovations
The hyaluronic acid (HA) products market is witnessing a surge in innovative product development, driven by the demand for enhanced efficacy and diverse applications. Recent breakthroughs focus on creating HA derivatives with superior bioavailability, targeted delivery mechanisms, and precisely controlled molecular weights. For instance, Bloomage Biotech Co.'s advanced enzyme degradation technology allows for meticulous control over molecular size, optimizing product performance. Similarly, Givaudan's PrimalHyal Hydra[+] boasts significantly improved hydration capabilities compared to traditional HA. These innovations are not only catering to the growing demand for high-performance skincare and cosmetic products but also expanding into pharmaceuticals and medical devices. The resulting competitive landscape is pushing the boundaries of HA applications and driving market expansion across various sectors.
Report Scope & Segmentation Analysis
This report segments the Hyaluronic Acid Products Market by application: Dietary Supplements, Pharmaceutical Industry, and Cosmetics Industry. Each segment's growth projections, market size, and competitive dynamics are analyzed in detail within the report. The full report provides specific data on market size and growth projections for each segment.
Key Drivers of Hyaluronic Acid Products Market Growth
Several key factors drive the Hyaluronic Acid Products Market growth. These include the rising demand for anti-aging products in the cosmetics industry, the increasing use of HA in pharmaceutical applications (drug delivery and wound healing), and the growing awareness among consumers about the benefits of HA for health and wellness. Technological advancements in HA production and purification contribute significantly to cost reductions and improved product quality, further boosting market growth.
Challenges in the Hyaluronic Acid Products Market Sector
Despite its significant growth, the hyaluronic acid products market faces several key challenges. Fluctuations in raw material prices, particularly for high-quality HA precursors, pose a considerable risk to profitability and pricing stability. Furthermore, navigating the complex and often region-specific regulatory landscape presents a significant hurdle for manufacturers seeking global market access. Stringent regulations regarding purity, safety, and efficacy necessitate substantial investment in compliance and testing. The increasing competition from alternative humectants and moisturizing agents adds further pressure. Supply chain vulnerabilities, exacerbated by geopolitical instability and economic uncertainties, introduce further risks, impacting product availability and market stability. Successfully addressing these challenges is crucial for sustained growth in the HA market.
Emerging Opportunities in Hyaluronic Acid Products Market
The hyaluronic acid products market presents a wealth of promising opportunities for innovation and expansion. The development of novel HA derivatives with enhanced functionalities, such as improved biocompatibility, anti-inflammatory properties, or targeted tissue regeneration, represents a key area of growth. Expanding into untapped geographic markets, especially in developing economies with increasing disposable incomes and rising demand for skincare and cosmetic products, presents significant potential. Innovation in delivery systems, such as advanced topical patches, microneedle patches, or sophisticated injectable formulations, offers opportunities to improve product efficacy and user experience. A growing consumer awareness of sustainability is driving demand for eco-friendly and ethically sourced HA, creating opportunities for companies committed to sustainable production practices. By capitalizing on these opportunities, businesses can position themselves for significant success in this dynamic market.
Leading Players in the Hyaluronic Acid Products Market Market
- Plamed Green Science Group
- Givaudan SA
- Bloomage Biotech Co
- Lifecore Biomedical LLC
- Fufeng Group
- HTL Biotechnology
- Koninklijke DSM NV
- Kewpie Corporation
- Contipro AS
- Baoding Faithful Industry Co Ltd
Key Developments in Hyaluronic Acid Products Market Industry
- September 2023: Bloomage Biotech Co. developed an enzyme degradation technology for precise control of HA molecular size (400Da-4000kDa).
- September 2023: Bloomage Biotech Co. launched "Hyadom," a hyaluronic acid lubricant for intimate health.
- March 2023: Givaudan Active Beauty launched PrimalHyal Hydra[+], a cationic HA with double the hydration effect of regular HA.
Future Outlook for Hyaluronic Acid Products Market Market
The Hyaluronic Acid Products Market is poised for continued growth, driven by increasing demand across diverse applications, ongoing technological advancements, and the expansion into new markets. Strategic partnerships and investments in research and development will be crucial for companies to maintain a competitive edge and capitalize on the significant market potential. The market is projected to experience healthy growth over the coming years, driven largely by the increasing demand for innovative products with superior qualities.
Hyaluronic Acid Products Market Segmentation
-
1. Application
- 1.1. Dietary Supplements
- 1.2. Pharmaceutical Industry
- 1.3. Cosmetics Industry
Hyaluronic Acid Products Market Segmentation By Geography
-
1. North America
- 1.1. United States
- 1.2. Canada
- 1.3. Mexico
- 1.4. Rest of North America
-
2. Europe
- 2.1. United Kingdom
- 2.2. Germany
- 2.3. France
- 2.4. Italy
- 2.5. Spain
- 2.6. Russia
- 2.7. Rest of Europe
-
3. Asia Pacific
- 3.1. China
- 3.2. Japan
- 3.3. India
- 3.4. Australia
- 3.5. Rest of Asia Pacific
-
4. Rest of the World
- 4.1. South America
- 4.2. Middle East and Africa
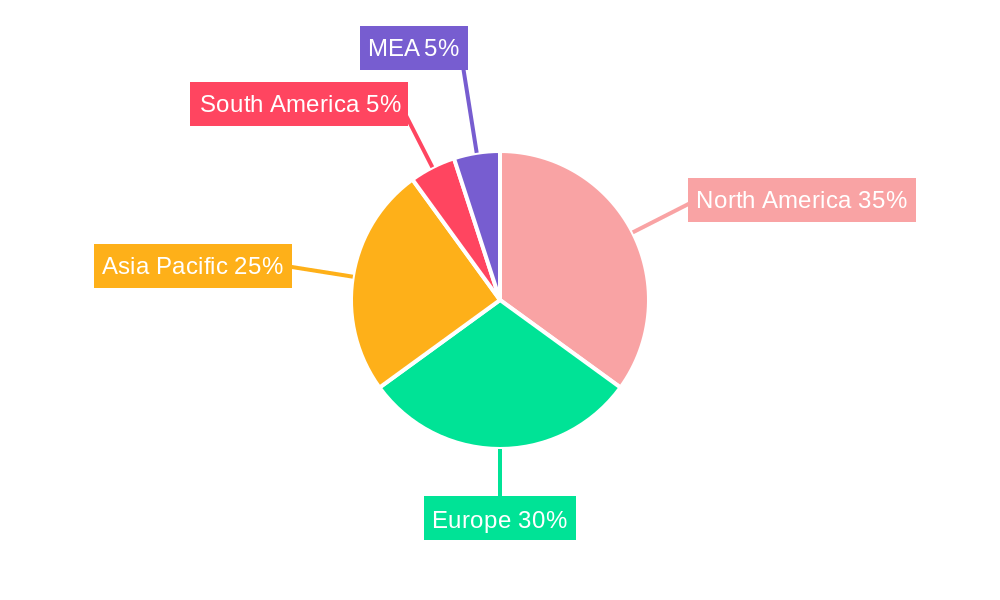
Hyaluronic Acid Products Market Regional Market Share
Geographic Coverage of Hyaluronic Acid Products Market
Hyaluronic Acid Products Market REPORT HIGHLIGHTS
| Aspects | Details |
|---|---|
| Study Period | 2020-2034 |
| Base Year | 2025 |
| Estimated Year | 2026 |
| Forecast Period | 2026-2034 |
| Historical Period | 2020-2025 |
| Growth Rate | CAGR of 7.46% from 2020-2034 |
| Segmentation |
|
Table of Contents
- 1. Introduction
- 1.1. Research Scope
- 1.2. Market Segmentation
- 1.3. Research Methodology
- 1.4. Definitions and Assumptions
- 2. Executive Summary
- 2.1. Introduction
- 3. Market Dynamics
- 3.1. Introduction
- 3.2. Market Drivers
- 3.2.1. Rise in the Number of Orthopaedic Treatment; Hyaluronic Acid
- 3.3. Market Restrains
- 3.3.1. Potential Side Effects of Hyaluronic Acid
- 3.4. Market Trends
- 3.4.1. Increased Cases of Orthopedic Disorders
- 4. Market Factor Analysis
- 4.1. Porters Five Forces
- 4.2. Supply/Value Chain
- 4.3. PESTEL analysis
- 4.4. Market Entropy
- 4.5. Patent/Trademark Analysis
- 5. Global Hyaluronic Acid Products Market Analysis, Insights and Forecast, 2020-2032
- 5.1. Market Analysis, Insights and Forecast - by Application
- 5.1.1. Dietary Supplements
- 5.1.2. Pharmaceutical Industry
- 5.1.3. Cosmetics Industry
- 5.2. Market Analysis, Insights and Forecast - by Region
- 5.2.1. North America
- 5.2.2. Europe
- 5.2.3. Asia Pacific
- 5.2.4. Rest of the World
- 5.1. Market Analysis, Insights and Forecast - by Application
- 6. North America Hyaluronic Acid Products Market Analysis, Insights and Forecast, 2020-2032
- 6.1. Market Analysis, Insights and Forecast - by Application
- 6.1.1. Dietary Supplements
- 6.1.2. Pharmaceutical Industry
- 6.1.3. Cosmetics Industry
- 6.1. Market Analysis, Insights and Forecast - by Application
- 7. Europe Hyaluronic Acid Products Market Analysis, Insights and Forecast, 2020-2032
- 7.1. Market Analysis, Insights and Forecast - by Application
- 7.1.1. Dietary Supplements
- 7.1.2. Pharmaceutical Industry
- 7.1.3. Cosmetics Industry
- 7.1. Market Analysis, Insights and Forecast - by Application
- 8. Asia Pacific Hyaluronic Acid Products Market Analysis, Insights and Forecast, 2020-2032
- 8.1. Market Analysis, Insights and Forecast - by Application
- 8.1.1. Dietary Supplements
- 8.1.2. Pharmaceutical Industry
- 8.1.3. Cosmetics Industry
- 8.1. Market Analysis, Insights and Forecast - by Application
- 9. Rest of the World Hyaluronic Acid Products Market Analysis, Insights and Forecast, 2020-2032
- 9.1. Market Analysis, Insights and Forecast - by Application
- 9.1.1. Dietary Supplements
- 9.1.2. Pharmaceutical Industry
- 9.1.3. Cosmetics Industry
- 9.1. Market Analysis, Insights and Forecast - by Application
- 10. Competitive Analysis
- 10.1. Global Market Share Analysis 2025
- 10.2. Company Profiles
- 10.2.1 Plamed Green Science Group *List Not Exhaustive
- 10.2.1.1. Overview
- 10.2.1.2. Products
- 10.2.1.3. SWOT Analysis
- 10.2.1.4. Recent Developments
- 10.2.1.5. Financials (Based on Availability)
- 10.2.2 Givaudan SA
- 10.2.2.1. Overview
- 10.2.2.2. Products
- 10.2.2.3. SWOT Analysis
- 10.2.2.4. Recent Developments
- 10.2.2.5. Financials (Based on Availability)
- 10.2.3 Bloomage Biotech Co
- 10.2.3.1. Overview
- 10.2.3.2. Products
- 10.2.3.3. SWOT Analysis
- 10.2.3.4. Recent Developments
- 10.2.3.5. Financials (Based on Availability)
- 10.2.4 Lifecore Biomedical LLC
- 10.2.4.1. Overview
- 10.2.4.2. Products
- 10.2.4.3. SWOT Analysis
- 10.2.4.4. Recent Developments
- 10.2.4.5. Financials (Based on Availability)
- 10.2.5 Fufeng Group
- 10.2.5.1. Overview
- 10.2.5.2. Products
- 10.2.5.3. SWOT Analysis
- 10.2.5.4. Recent Developments
- 10.2.5.5. Financials (Based on Availability)
- 10.2.6 HTL Biotechnology
- 10.2.6.1. Overview
- 10.2.6.2. Products
- 10.2.6.3. SWOT Analysis
- 10.2.6.4. Recent Developments
- 10.2.6.5. Financials (Based on Availability)
- 10.2.7 Koninklijke DSM NV
- 10.2.7.1. Overview
- 10.2.7.2. Products
- 10.2.7.3. SWOT Analysis
- 10.2.7.4. Recent Developments
- 10.2.7.5. Financials (Based on Availability)
- 10.2.8 Kewpie Corporation
- 10.2.8.1. Overview
- 10.2.8.2. Products
- 10.2.8.3. SWOT Analysis
- 10.2.8.4. Recent Developments
- 10.2.8.5. Financials (Based on Availability)
- 10.2.9 Contipro AS
- 10.2.9.1. Overview
- 10.2.9.2. Products
- 10.2.9.3. SWOT Analysis
- 10.2.9.4. Recent Developments
- 10.2.9.5. Financials (Based on Availability)
- 10.2.10 Baoding Faithful Industry Co Ltd
- 10.2.10.1. Overview
- 10.2.10.2. Products
- 10.2.10.3. SWOT Analysis
- 10.2.10.4. Recent Developments
- 10.2.10.5. Financials (Based on Availability)
- 10.2.1 Plamed Green Science Group *List Not Exhaustive
List of Figures
- Figure 1: Global Hyaluronic Acid Products Market Revenue Breakdown (Million, %) by Region 2025 & 2033
- Figure 2: North America Hyaluronic Acid Products Market Revenue (Million), by Application 2025 & 2033
- Figure 3: North America Hyaluronic Acid Products Market Revenue Share (%), by Application 2025 & 2033
- Figure 4: North America Hyaluronic Acid Products Market Revenue (Million), by Country 2025 & 2033
- Figure 5: North America Hyaluronic Acid Products Market Revenue Share (%), by Country 2025 & 2033
- Figure 6: Europe Hyaluronic Acid Products Market Revenue (Million), by Application 2025 & 2033
- Figure 7: Europe Hyaluronic Acid Products Market Revenue Share (%), by Application 2025 & 2033
- Figure 8: Europe Hyaluronic Acid Products Market Revenue (Million), by Country 2025 & 2033
- Figure 9: Europe Hyaluronic Acid Products Market Revenue Share (%), by Country 2025 & 2033
- Figure 10: Asia Pacific Hyaluronic Acid Products Market Revenue (Million), by Application 2025 & 2033
- Figure 11: Asia Pacific Hyaluronic Acid Products Market Revenue Share (%), by Application 2025 & 2033
- Figure 12: Asia Pacific Hyaluronic Acid Products Market Revenue (Million), by Country 2025 & 2033
- Figure 13: Asia Pacific Hyaluronic Acid Products Market Revenue Share (%), by Country 2025 & 2033
- Figure 14: Rest of the World Hyaluronic Acid Products Market Revenue (Million), by Application 2025 & 2033
- Figure 15: Rest of the World Hyaluronic Acid Products Market Revenue Share (%), by Application 2025 & 2033
- Figure 16: Rest of the World Hyaluronic Acid Products Market Revenue (Million), by Country 2025 & 2033
- Figure 17: Rest of the World Hyaluronic Acid Products Market Revenue Share (%), by Country 2025 & 2033
List of Tables
- Table 1: Global Hyaluronic Acid Products Market Revenue Million Forecast, by Application 2020 & 2033
- Table 2: Global Hyaluronic Acid Products Market Revenue Million Forecast, by Region 2020 & 2033
- Table 3: Global Hyaluronic Acid Products Market Revenue Million Forecast, by Application 2020 & 2033
- Table 4: Global Hyaluronic Acid Products Market Revenue Million Forecast, by Country 2020 & 2033
- Table 5: United States Hyaluronic Acid Products Market Revenue (Million) Forecast, by Application 2020 & 2033
- Table 6: Canada Hyaluronic Acid Products Market Revenue (Million) Forecast, by Application 2020 & 2033
- Table 7: Mexico Hyaluronic Acid Products Market Revenue (Million) Forecast, by Application 2020 & 2033
- Table 8: Rest of North America Hyaluronic Acid Products Market Revenue (Million) Forecast, by Application 2020 & 2033
- Table 9: Global Hyaluronic Acid Products Market Revenue Million Forecast, by Application 2020 & 2033
- Table 10: Global Hyaluronic Acid Products Market Revenue Million Forecast, by Country 2020 & 2033
- Table 11: United Kingdom Hyaluronic Acid Products Market Revenue (Million) Forecast, by Application 2020 & 2033
- Table 12: Germany Hyaluronic Acid Products Market Revenue (Million) Forecast, by Application 2020 & 2033
- Table 13: France Hyaluronic Acid Products Market Revenue (Million) Forecast, by Application 2020 & 2033
- Table 14: Italy Hyaluronic Acid Products Market Revenue (Million) Forecast, by Application 2020 & 2033
- Table 15: Spain Hyaluronic Acid Products Market Revenue (Million) Forecast, by Application 2020 & 2033
- Table 16: Russia Hyaluronic Acid Products Market Revenue (Million) Forecast, by Application 2020 & 2033
- Table 17: Rest of Europe Hyaluronic Acid Products Market Revenue (Million) Forecast, by Application 2020 & 2033
- Table 18: Global Hyaluronic Acid Products Market Revenue Million Forecast, by Application 2020 & 2033
- Table 19: Global Hyaluronic Acid Products Market Revenue Million Forecast, by Country 2020 & 2033
- Table 20: China Hyaluronic Acid Products Market Revenue (Million) Forecast, by Application 2020 & 2033
- Table 21: Japan Hyaluronic Acid Products Market Revenue (Million) Forecast, by Application 2020 & 2033
- Table 22: India Hyaluronic Acid Products Market Revenue (Million) Forecast, by Application 2020 & 2033
- Table 23: Australia Hyaluronic Acid Products Market Revenue (Million) Forecast, by Application 2020 & 2033
- Table 24: Rest of Asia Pacific Hyaluronic Acid Products Market Revenue (Million) Forecast, by Application 2020 & 2033
- Table 25: Global Hyaluronic Acid Products Market Revenue Million Forecast, by Application 2020 & 2033
- Table 26: Global Hyaluronic Acid Products Market Revenue Million Forecast, by Country 2020 & 2033
- Table 27: South America Hyaluronic Acid Products Market Revenue (Million) Forecast, by Application 2020 & 2033
- Table 28: Middle East and Africa Hyaluronic Acid Products Market Revenue (Million) Forecast, by Application 2020 & 2033
Frequently Asked Questions
1. What is the projected Compound Annual Growth Rate (CAGR) of the Hyaluronic Acid Products Market?
The projected CAGR is approximately 7.46%.
2. Which companies are prominent players in the Hyaluronic Acid Products Market?
Key companies in the market include Plamed Green Science Group *List Not Exhaustive, Givaudan SA, Bloomage Biotech Co, Lifecore Biomedical LLC, Fufeng Group, HTL Biotechnology, Koninklijke DSM NV, Kewpie Corporation, Contipro AS, Baoding Faithful Industry Co Ltd.
3. What are the main segments of the Hyaluronic Acid Products Market?
The market segments include Application.
4. Can you provide details about the market size?
The market size is estimated to be USD 2.64 Million as of 2022.
5. What are some drivers contributing to market growth?
Rise in the Number of Orthopaedic Treatment; Hyaluronic Acid: a Key Molecule in Skin Health.
6. What are the notable trends driving market growth?
Increased Cases of Orthopedic Disorders.
7. Are there any restraints impacting market growth?
Potential Side Effects of Hyaluronic Acid.
8. Can you provide examples of recent developments in the market?
September 2023: Bloomage Biotech Co., through its research of varying efficacies of Hyaluronic Acid (HA) molecules of different weights, found an enzyme degradation technology that can accurately control the molecular size of HA between 400Da and 4000kDa.
9. What pricing options are available for accessing the report?
Pricing options include single-user, multi-user, and enterprise licenses priced at USD 4750, USD 5250, and USD 8750 respectively.
10. Is the market size provided in terms of value or volume?
The market size is provided in terms of value, measured in Million.
11. Are there any specific market keywords associated with the report?
Yes, the market keyword associated with the report is "Hyaluronic Acid Products Market," which aids in identifying and referencing the specific market segment covered.
12. How do I determine which pricing option suits my needs best?
The pricing options vary based on user requirements and access needs. Individual users may opt for single-user licenses, while businesses requiring broader access may choose multi-user or enterprise licenses for cost-effective access to the report.
13. Are there any additional resources or data provided in the Hyaluronic Acid Products Market report?
While the report offers comprehensive insights, it's advisable to review the specific contents or supplementary materials provided to ascertain if additional resources or data are available.
14. How can I stay updated on further developments or reports in the Hyaluronic Acid Products Market?
To stay informed about further developments, trends, and reports in the Hyaluronic Acid Products Market, consider subscribing to industry newsletters, following relevant companies and organizations, or regularly checking reputable industry news sources and publications.
Methodology
Step 1 - Identification of Relevant Samples Size from Population Database


Step 2 - Approaches for Defining Global Market Size (Value, Volume* & Price*)

Note*: In applicable scenarios
Step 3 - Data Sources
Primary Research
- Web Analytics
- Survey Reports
- Research Institute
- Latest Research Reports
- Opinion Leaders
Secondary Research
- Annual Reports
- White Paper
- Latest Press Release
- Industry Association
- Paid Database
- Investor Presentations

Step 4 - Data Triangulation
Involves using different sources of information in order to increase the validity of a study
These sources are likely to be stakeholders in a program - participants, other researchers, program staff, other community members, and so on.
Then we put all data in single framework & apply various statistical tools to find out the dynamic on the market.
During the analysis stage, feedback from the stakeholder groups would be compared to determine areas of agreement as well as areas of divergence

