
Key Insights
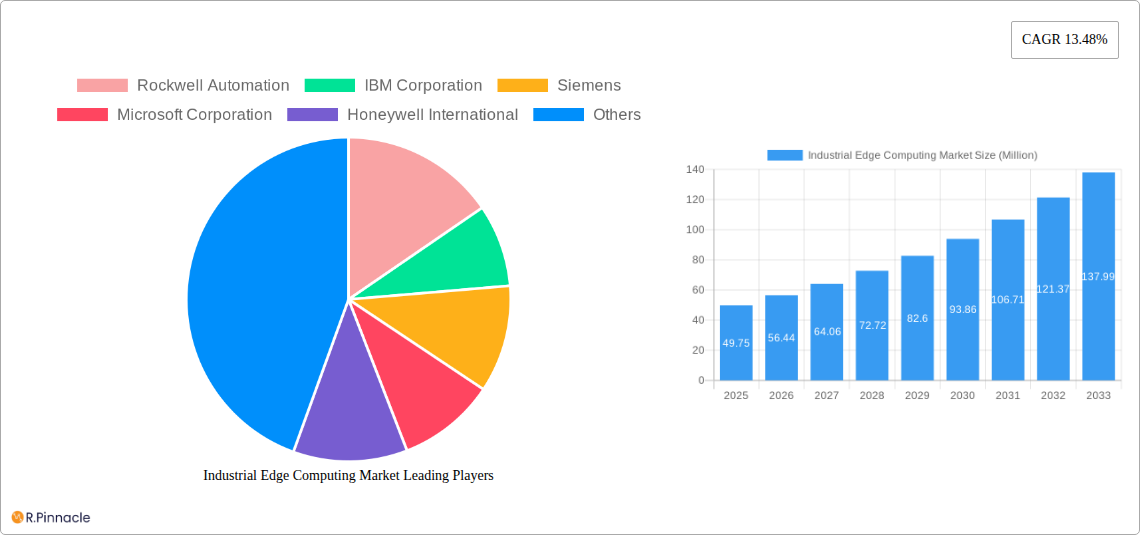
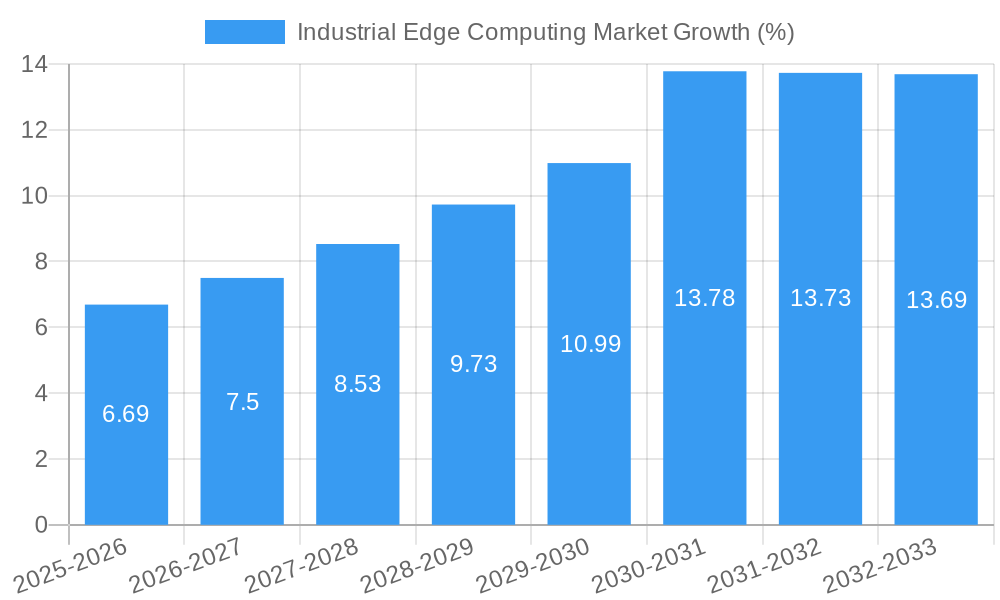
The Industrial Edge Computing market is experiencing robust growth, projected to reach $49.75 million in 2025 and maintain a Compound Annual Growth Rate (CAGR) of 13.48% from 2025 to 2033. This expansion is driven by several key factors. The increasing need for real-time data processing and analysis in manufacturing, oil and gas, and mining sectors fuels the demand for edge computing solutions. These industries are adopting edge computing to improve operational efficiency, optimize resource allocation, and enhance overall productivity. Furthermore, advancements in hardware, software, and services within the edge computing ecosystem are contributing to its wider adoption. The availability of more powerful, yet energy-efficient edge devices, coupled with sophisticated software platforms for data management and analytics, makes edge computing a more viable and attractive solution for diverse industrial applications. The trend towards Industry 4.0 and the Internet of Things (IoT) further accelerates market growth by generating massive volumes of data that require immediate processing at the source.
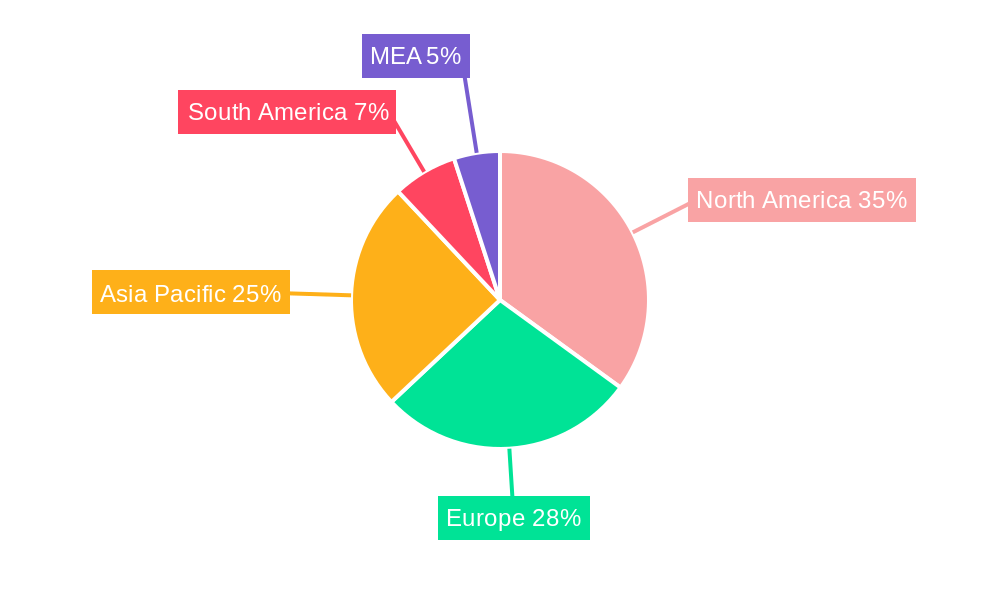
Significant regional variations are expected. North America, driven by early adoption and technological advancements, currently holds a substantial market share, but the Asia-Pacific region is anticipated to witness the fastest growth due to increasing industrialization and digital transformation initiatives. The market segmentation, encompassing hardware, software, and services, presents multiple avenues for growth. While hardware currently holds a larger share, the software and services segments are poised for rapid expansion as the industry moves towards more sophisticated data analytics and cloud integration capabilities. Competitive dynamics are intense, with established players like Rockwell Automation, Siemens, and IBM competing alongside technology giants such as Microsoft and emerging players. The market's future hinges on continued technological innovation, the cost-effectiveness of edge computing solutions, and the growing awareness of its benefits across different industries. Sustained investment in research and development, particularly in areas such as improved security and interoperability, will play a crucial role in shaping the market's trajectory in the years to come.
Industrial Edge Computing Market: A Comprehensive Report (2019-2033)
This comprehensive report provides an in-depth analysis of the Industrial Edge Computing Market, offering valuable insights for industry professionals, investors, and strategists. Covering the period from 2019 to 2033, with a base year of 2025 and a forecast period of 2025-2033, this report unveils the market's structure, dynamics, and future potential. The market is projected to reach xx Million by 2033, exhibiting a CAGR of xx% during the forecast period.
Industrial Edge Computing Market Structure & Innovation Trends
The Industrial Edge Computing market is characterized by a moderately concentrated landscape, with key players like Rockwell Automation, IBM Corporation, Siemens, Microsoft Corporation, Honeywell International, Intel Corporation, Huawei Technologies, General Electric Company, and SAP SE holding significant market share. However, the market also features numerous smaller, specialized firms contributing to innovation. Market share distribution is currently estimated at xx% for the top 5 players in 2025, with a projected shift towards xx% by 2033. Several factors drive innovation, including the increasing demand for real-time data processing, advancements in AI and machine learning, and the need for improved operational efficiency in various industries. Regulatory frameworks, particularly those focused on data security and privacy, are significantly impacting market development. The prevalence of product substitutes, such as cloud computing solutions, presents a competitive challenge. Market dynamics are further influenced by end-user demographics, particularly the adoption of Industry 4.0 technologies across different verticals. M&A activity is substantial, with several significant deals concluded in recent years. For example, the estimated value of M&A activities in 2024 was xx Million, indicating a robust level of consolidation within the sector.
Industrial Edge Computing Market Dynamics & Trends
The Industrial Edge Computing market is experiencing rapid growth, driven by several key factors. The increasing adoption of Industry 4.0 and the Internet of Things (IoT) in manufacturing, oil and gas, and mining sectors is a primary driver. The need for real-time data analysis to improve operational efficiency, reduce downtime, and enhance productivity is also fueling market expansion. Technological advancements, such as the development of more powerful and energy-efficient edge devices, are further accelerating growth. Consumer preferences are shifting towards solutions that offer enhanced security, scalability, and ease of integration. Competitive dynamics are intense, with established players and new entrants vying for market share through product innovation, strategic partnerships, and acquisitions. The market penetration rate for Industrial Edge Computing solutions is currently estimated at xx% in the manufacturing sector and is projected to reach xx% by 2033.
Dominant Regions & Segments in Industrial Edge Computing Market
- By End-user Vertical: The Manufacturing sector is the dominant segment, accounting for approximately xx% of the market in 2025. This is driven by the high concentration of industrial facilities and the significant potential for improving efficiency and productivity.
- Key Drivers (Manufacturing): High adoption of Industry 4.0, government initiatives promoting automation, robust industrial infrastructure.
- By End-user Vertical: The Oil and Gas sector is experiencing significant growth, followed by the Mining sector. The projected growth rate for the Oil and Gas sector is xx%, while that for the Mining sector is xx%.
- Key Drivers (Oil & Gas): Need for enhanced safety, predictive maintenance, and remote monitoring in hazardous environments.
- Key Drivers (Mining): Demand for improved resource optimization and enhanced safety measures in remote operations.
- By Component: The Hardware segment currently holds the largest market share (xx%), driven by increasing demand for robust and reliable edge devices. However, the Software segment is projected to have the highest growth rate (xx%) over the forecast period, due to the increasing demand for advanced analytics and AI capabilities. The Services segment is essential for implementation, integration, and support, holding a significant share.
Industrial Edge Computing Market Product Innovations
Recent product developments highlight a strong emphasis on AI integration, enhanced data security, and improved scalability. Siemens Industrial Edge, for example, exemplifies a comprehensive edge computing platform encompassing applications, OT/IT connectivity, devices, and a central management system. Sight Machine’s Manufacturing Data Platform represents a significant advancement in data analysis for manufacturing, offering end-to-end capabilities. The recent introduction of Rockwell Automation’s edge computing modules for Allen-Bradley networks further underscores the focus on integrating edge capabilities into existing industrial automation infrastructures. These innovations cater to the growing need for real-time insights, improved operational efficiency, and enhanced decision-making capabilities within industrial settings.
Report Scope & Segmentation Analysis
This report segments the Industrial Edge Computing market by end-user vertical (Manufacturing, Oil and Gas, Mining) and by component (Hardware, Software, Services). The Manufacturing segment is projected to witness significant growth due to high adoption of Industry 4.0 technologies. The Oil and Gas segment is expected to experience substantial growth driven by the need for enhanced safety and operational efficiency. The Mining segment is also poised for growth, owing to the focus on automation and improved resource management. Within the components segment, the Hardware segment is expected to maintain its dominant position. However, the Software and Services segments are expected to experience faster growth rates, reflecting the increasing demand for data analytics and support services. Competitive dynamics are influenced by both established players and emerging innovative companies.
Key Drivers of Industrial Edge Computing Market Growth
The Industrial Edge Computing market's growth is primarily fueled by technological advancements in AI, machine learning, and IoT; the increasing need for real-time data analytics to optimize operational efficiency; and supportive government regulations promoting industrial automation and digitalization. Furthermore, the rising demand for enhanced security in industrial control systems and the need for predictive maintenance are also significant contributors. Economic factors, such as the increasing cost of downtime and the potential for significant ROI through automation, are also boosting market expansion.
Challenges in the Industrial Edge Computing Market Sector
Significant challenges include the high initial investment costs associated with implementing edge computing solutions, concerns regarding data security and privacy, and the complexity of integrating edge technologies into existing industrial infrastructure. Supply chain disruptions can also negatively impact the availability of essential components, potentially leading to project delays and increased costs. Intense competition among established players and new entrants further complicates the market landscape, adding pressure on pricing and margins. The estimated impact of these challenges on market growth is projected at a reduction of xx% by 2033.
Emerging Opportunities in Industrial Edge Computing Market
Emerging opportunities stem from the expansion of 5G networks providing enhanced connectivity for edge devices, the growth of AI-driven applications for predictive maintenance and anomaly detection, and the development of more robust and secure edge platforms. New markets, particularly in developing economies with significant industrial sectors, present untapped potential. The increasing focus on sustainability and the adoption of green technologies in industrial settings create further opportunities for edge computing solutions optimized for energy efficiency.
Leading Players in the Industrial Edge Computing Market
- Rockwell Automation
- IBM Corporation
- Siemens
- Microsoft Corporation
- Honeywell International
- Intel Corporation
- Huawei Technologies
- General Electric Company
- SAP SE
Key Developments in Industrial Edge Computing Market Industry
- October 2023: Rockwell Automation introduces a new family of edge computing modules for Allen-Bradley networks, enhancing Industry 4.0 capabilities.
- April 2024: Machine Inc. and Siemens AG partner to bring manufacturing AI to on-premises automation networks.
Future Outlook for Industrial Edge Computing Market
The Industrial Edge Computing market is poised for continued strong growth, driven by ongoing technological advancements, increasing adoption of Industry 4.0 principles, and the expanding need for real-time data analytics across various industrial sectors. Strategic opportunities exist for companies focusing on developing innovative solutions that address data security concerns, improve scalability, and reduce implementation complexities. The market's future growth trajectory is strongly linked to the broader adoption of digital transformation strategies within industrial settings.
Industrial Edge Computing Market Segmentation
-
1. Component
- 1.1. Hardware
- 1.2. Software
- 1.3. Services
-
2. End-user Vertical
- 2.1. Manufacturing
- 2.2. Oil and Gas
- 2.3. Mining
Industrial Edge Computing Market Segmentation By Geography
- 1. North America
- 2. Europe
- 3. Asia
- 4. Australia and New Zealand
- 5. Latin America
- 6. Middle East and Africa
Industrial Edge Computing Market REPORT HIGHLIGHTS
| Aspects | Details |
|---|---|
| Study Period | 2019-2033 |
| Base Year | 2024 |
| Estimated Year | 2025 |
| Forecast Period | 2025-2033 |
| Historical Period | 2019-2024 |
| Growth Rate | CAGR of 13.48% from 2019-2033 |
| Segmentation |
|
Table of Contents
- 1. Introduction
- 1.1. Research Scope
- 1.2. Market Segmentation
- 1.3. Research Methodology
- 1.4. Definitions and Assumptions
- 2. Executive Summary
- 2.1. Introduction
- 3. Market Dynamics
- 3.1. Introduction
- 3.2. Market Drivers
- 3.2.1. Growing Demand For Automation in the Industrial Sector; Organizations shifting from cloud computing and storage systems to edge computing
- 3.3. Market Restrains
- 3.3.1. Introduction of a new technology to an ageing workforce exposes the skills gap
- 3.4. Market Trends
- 3.4.1. Oil and Gas sector is expected to grow at a higher pace
- 4. Market Factor Analysis
- 4.1. Porters Five Forces
- 4.2. Supply/Value Chain
- 4.3. PESTEL analysis
- 4.4. Market Entropy
- 4.5. Patent/Trademark Analysis
- 5. Global Industrial Edge Computing Market Analysis, Insights and Forecast, 2019-2031
- 5.1. Market Analysis, Insights and Forecast - by Component
- 5.1.1. Hardware
- 5.1.2. Software
- 5.1.3. Services
- 5.2. Market Analysis, Insights and Forecast - by End-user Vertical
- 5.2.1. Manufacturing
- 5.2.2. Oil and Gas
- 5.2.3. Mining
- 5.3. Market Analysis, Insights and Forecast - by Region
- 5.3.1. North America
- 5.3.2. Europe
- 5.3.3. Asia
- 5.3.4. Australia and New Zealand
- 5.3.5. Latin America
- 5.3.6. Middle East and Africa
- 5.1. Market Analysis, Insights and Forecast - by Component
- 6. North America Industrial Edge Computing Market Analysis, Insights and Forecast, 2019-2031
- 6.1. Market Analysis, Insights and Forecast - by Component
- 6.1.1. Hardware
- 6.1.2. Software
- 6.1.3. Services
- 6.2. Market Analysis, Insights and Forecast - by End-user Vertical
- 6.2.1. Manufacturing
- 6.2.2. Oil and Gas
- 6.2.3. Mining
- 6.1. Market Analysis, Insights and Forecast - by Component
- 7. Europe Industrial Edge Computing Market Analysis, Insights and Forecast, 2019-2031
- 7.1. Market Analysis, Insights and Forecast - by Component
- 7.1.1. Hardware
- 7.1.2. Software
- 7.1.3. Services
- 7.2. Market Analysis, Insights and Forecast - by End-user Vertical
- 7.2.1. Manufacturing
- 7.2.2. Oil and Gas
- 7.2.3. Mining
- 7.1. Market Analysis, Insights and Forecast - by Component
- 8. Asia Industrial Edge Computing Market Analysis, Insights and Forecast, 2019-2031
- 8.1. Market Analysis, Insights and Forecast - by Component
- 8.1.1. Hardware
- 8.1.2. Software
- 8.1.3. Services
- 8.2. Market Analysis, Insights and Forecast - by End-user Vertical
- 8.2.1. Manufacturing
- 8.2.2. Oil and Gas
- 8.2.3. Mining
- 8.1. Market Analysis, Insights and Forecast - by Component
- 9. Australia and New Zealand Industrial Edge Computing Market Analysis, Insights and Forecast, 2019-2031
- 9.1. Market Analysis, Insights and Forecast - by Component
- 9.1.1. Hardware
- 9.1.2. Software
- 9.1.3. Services
- 9.2. Market Analysis, Insights and Forecast - by End-user Vertical
- 9.2.1. Manufacturing
- 9.2.2. Oil and Gas
- 9.2.3. Mining
- 9.1. Market Analysis, Insights and Forecast - by Component
- 10. Latin America Industrial Edge Computing Market Analysis, Insights and Forecast, 2019-2031
- 10.1. Market Analysis, Insights and Forecast - by Component
- 10.1.1. Hardware
- 10.1.2. Software
- 10.1.3. Services
- 10.2. Market Analysis, Insights and Forecast - by End-user Vertical
- 10.2.1. Manufacturing
- 10.2.2. Oil and Gas
- 10.2.3. Mining
- 10.1. Market Analysis, Insights and Forecast - by Component
- 11. Middle East and Africa Industrial Edge Computing Market Analysis, Insights and Forecast, 2019-2031
- 11.1. Market Analysis, Insights and Forecast - by Component
- 11.1.1. Hardware
- 11.1.2. Software
- 11.1.3. Services
- 11.2. Market Analysis, Insights and Forecast - by End-user Vertical
- 11.2.1. Manufacturing
- 11.2.2. Oil and Gas
- 11.2.3. Mining
- 11.1. Market Analysis, Insights and Forecast - by Component
- 12. North America Industrial Edge Computing Market Analysis, Insights and Forecast, 2019-2031
- 12.1. Market Analysis, Insights and Forecast - By Country/Sub-region
- 12.1.1 United States
- 12.1.2 Canada
- 12.1.3 Mexico
- 13. Europe Industrial Edge Computing Market Analysis, Insights and Forecast, 2019-2031
- 13.1. Market Analysis, Insights and Forecast - By Country/Sub-region
- 13.1.1 Germany
- 13.1.2 United Kingdom
- 13.1.3 France
- 13.1.4 Spain
- 13.1.5 Italy
- 13.1.6 Spain
- 13.1.7 Belgium
- 13.1.8 Netherland
- 13.1.9 Nordics
- 13.1.10 Rest of Europe
- 14. Asia Pacific Industrial Edge Computing Market Analysis, Insights and Forecast, 2019-2031
- 14.1. Market Analysis, Insights and Forecast - By Country/Sub-region
- 14.1.1 China
- 14.1.2 Japan
- 14.1.3 India
- 14.1.4 South Korea
- 14.1.5 Southeast Asia
- 14.1.6 Australia
- 14.1.7 Indonesia
- 14.1.8 Phillipes
- 14.1.9 Singapore
- 14.1.10 Thailandc
- 14.1.11 Rest of Asia Pacific
- 15. South America Industrial Edge Computing Market Analysis, Insights and Forecast, 2019-2031
- 15.1. Market Analysis, Insights and Forecast - By Country/Sub-region
- 15.1.1 Brazil
- 15.1.2 Argentina
- 15.1.3 Peru
- 15.1.4 Chile
- 15.1.5 Colombia
- 15.1.6 Ecuador
- 15.1.7 Venezuela
- 15.1.8 Rest of South America
- 16. North America Industrial Edge Computing Market Analysis, Insights and Forecast, 2019-2031
- 16.1. Market Analysis, Insights and Forecast - By Country/Sub-region
- 16.1.1 United States
- 16.1.2 Canada
- 16.1.3 Mexico
- 17. MEA Industrial Edge Computing Market Analysis, Insights and Forecast, 2019-2031
- 17.1. Market Analysis, Insights and Forecast - By Country/Sub-region
- 17.1.1 United Arab Emirates
- 17.1.2 Saudi Arabia
- 17.1.3 South Africa
- 17.1.4 Rest of Middle East and Africa
- 18. Competitive Analysis
- 18.1. Global Market Share Analysis 2024
- 18.2. Company Profiles
- 18.2.1 Rockwell Automation
- 18.2.1.1. Overview
- 18.2.1.2. Products
- 18.2.1.3. SWOT Analysis
- 18.2.1.4. Recent Developments
- 18.2.1.5. Financials (Based on Availability)
- 18.2.2 IBM Corporation
- 18.2.2.1. Overview
- 18.2.2.2. Products
- 18.2.2.3. SWOT Analysis
- 18.2.2.4. Recent Developments
- 18.2.2.5. Financials (Based on Availability)
- 18.2.3 Siemens
- 18.2.3.1. Overview
- 18.2.3.2. Products
- 18.2.3.3. SWOT Analysis
- 18.2.3.4. Recent Developments
- 18.2.3.5. Financials (Based on Availability)
- 18.2.4 Microsoft Corporation
- 18.2.4.1. Overview
- 18.2.4.2. Products
- 18.2.4.3. SWOT Analysis
- 18.2.4.4. Recent Developments
- 18.2.4.5. Financials (Based on Availability)
- 18.2.5 Honeywell International
- 18.2.5.1. Overview
- 18.2.5.2. Products
- 18.2.5.3. SWOT Analysis
- 18.2.5.4. Recent Developments
- 18.2.5.5. Financials (Based on Availability)
- 18.2.6 Intel Corporation*List Not Exhaustive
- 18.2.6.1. Overview
- 18.2.6.2. Products
- 18.2.6.3. SWOT Analysis
- 18.2.6.4. Recent Developments
- 18.2.6.5. Financials (Based on Availability)
- 18.2.7 Huawei Technologies
- 18.2.7.1. Overview
- 18.2.7.2. Products
- 18.2.7.3. SWOT Analysis
- 18.2.7.4. Recent Developments
- 18.2.7.5. Financials (Based on Availability)
- 18.2.8 General Electric Company
- 18.2.8.1. Overview
- 18.2.8.2. Products
- 18.2.8.3. SWOT Analysis
- 18.2.8.4. Recent Developments
- 18.2.8.5. Financials (Based on Availability)
- 18.2.9 SAP SE
- 18.2.9.1. Overview
- 18.2.9.2. Products
- 18.2.9.3. SWOT Analysis
- 18.2.9.4. Recent Developments
- 18.2.9.5. Financials (Based on Availability)
- 18.2.1 Rockwell Automation
List of Figures
- Figure 1: Global Industrial Edge Computing Market Revenue Breakdown (Million, %) by Region 2024 & 2032
- Figure 2: North America Industrial Edge Computing Market Revenue (Million), by Country 2024 & 2032
- Figure 3: North America Industrial Edge Computing Market Revenue Share (%), by Country 2024 & 2032
- Figure 4: Europe Industrial Edge Computing Market Revenue (Million), by Country 2024 & 2032
- Figure 5: Europe Industrial Edge Computing Market Revenue Share (%), by Country 2024 & 2032
- Figure 6: Asia Pacific Industrial Edge Computing Market Revenue (Million), by Country 2024 & 2032
- Figure 7: Asia Pacific Industrial Edge Computing Market Revenue Share (%), by Country 2024 & 2032
- Figure 8: South America Industrial Edge Computing Market Revenue (Million), by Country 2024 & 2032
- Figure 9: South America Industrial Edge Computing Market Revenue Share (%), by Country 2024 & 2032
- Figure 10: North America Industrial Edge Computing Market Revenue (Million), by Country 2024 & 2032
- Figure 11: North America Industrial Edge Computing Market Revenue Share (%), by Country 2024 & 2032
- Figure 12: MEA Industrial Edge Computing Market Revenue (Million), by Country 2024 & 2032
- Figure 13: MEA Industrial Edge Computing Market Revenue Share (%), by Country 2024 & 2032
- Figure 14: North America Industrial Edge Computing Market Revenue (Million), by Component 2024 & 2032
- Figure 15: North America Industrial Edge Computing Market Revenue Share (%), by Component 2024 & 2032
- Figure 16: North America Industrial Edge Computing Market Revenue (Million), by End-user Vertical 2024 & 2032
- Figure 17: North America Industrial Edge Computing Market Revenue Share (%), by End-user Vertical 2024 & 2032
- Figure 18: North America Industrial Edge Computing Market Revenue (Million), by Country 2024 & 2032
- Figure 19: North America Industrial Edge Computing Market Revenue Share (%), by Country 2024 & 2032
- Figure 20: Europe Industrial Edge Computing Market Revenue (Million), by Component 2024 & 2032
- Figure 21: Europe Industrial Edge Computing Market Revenue Share (%), by Component 2024 & 2032
- Figure 22: Europe Industrial Edge Computing Market Revenue (Million), by End-user Vertical 2024 & 2032
- Figure 23: Europe Industrial Edge Computing Market Revenue Share (%), by End-user Vertical 2024 & 2032
- Figure 24: Europe Industrial Edge Computing Market Revenue (Million), by Country 2024 & 2032
- Figure 25: Europe Industrial Edge Computing Market Revenue Share (%), by Country 2024 & 2032
- Figure 26: Asia Industrial Edge Computing Market Revenue (Million), by Component 2024 & 2032
- Figure 27: Asia Industrial Edge Computing Market Revenue Share (%), by Component 2024 & 2032
- Figure 28: Asia Industrial Edge Computing Market Revenue (Million), by End-user Vertical 2024 & 2032
- Figure 29: Asia Industrial Edge Computing Market Revenue Share (%), by End-user Vertical 2024 & 2032
- Figure 30: Asia Industrial Edge Computing Market Revenue (Million), by Country 2024 & 2032
- Figure 31: Asia Industrial Edge Computing Market Revenue Share (%), by Country 2024 & 2032
- Figure 32: Australia and New Zealand Industrial Edge Computing Market Revenue (Million), by Component 2024 & 2032
- Figure 33: Australia and New Zealand Industrial Edge Computing Market Revenue Share (%), by Component 2024 & 2032
- Figure 34: Australia and New Zealand Industrial Edge Computing Market Revenue (Million), by End-user Vertical 2024 & 2032
- Figure 35: Australia and New Zealand Industrial Edge Computing Market Revenue Share (%), by End-user Vertical 2024 & 2032
- Figure 36: Australia and New Zealand Industrial Edge Computing Market Revenue (Million), by Country 2024 & 2032
- Figure 37: Australia and New Zealand Industrial Edge Computing Market Revenue Share (%), by Country 2024 & 2032
- Figure 38: Latin America Industrial Edge Computing Market Revenue (Million), by Component 2024 & 2032
- Figure 39: Latin America Industrial Edge Computing Market Revenue Share (%), by Component 2024 & 2032
- Figure 40: Latin America Industrial Edge Computing Market Revenue (Million), by End-user Vertical 2024 & 2032
- Figure 41: Latin America Industrial Edge Computing Market Revenue Share (%), by End-user Vertical 2024 & 2032
- Figure 42: Latin America Industrial Edge Computing Market Revenue (Million), by Country 2024 & 2032
- Figure 43: Latin America Industrial Edge Computing Market Revenue Share (%), by Country 2024 & 2032
- Figure 44: Middle East and Africa Industrial Edge Computing Market Revenue (Million), by Component 2024 & 2032
- Figure 45: Middle East and Africa Industrial Edge Computing Market Revenue Share (%), by Component 2024 & 2032
- Figure 46: Middle East and Africa Industrial Edge Computing Market Revenue (Million), by End-user Vertical 2024 & 2032
- Figure 47: Middle East and Africa Industrial Edge Computing Market Revenue Share (%), by End-user Vertical 2024 & 2032
- Figure 48: Middle East and Africa Industrial Edge Computing Market Revenue (Million), by Country 2024 & 2032
- Figure 49: Middle East and Africa Industrial Edge Computing Market Revenue Share (%), by Country 2024 & 2032
List of Tables
- Table 1: Global Industrial Edge Computing Market Revenue Million Forecast, by Region 2019 & 2032
- Table 2: Global Industrial Edge Computing Market Revenue Million Forecast, by Component 2019 & 2032
- Table 3: Global Industrial Edge Computing Market Revenue Million Forecast, by End-user Vertical 2019 & 2032
- Table 4: Global Industrial Edge Computing Market Revenue Million Forecast, by Region 2019 & 2032
- Table 5: Global Industrial Edge Computing Market Revenue Million Forecast, by Country 2019 & 2032
- Table 6: United States Industrial Edge Computing Market Revenue (Million) Forecast, by Application 2019 & 2032
- Table 7: Canada Industrial Edge Computing Market Revenue (Million) Forecast, by Application 2019 & 2032
- Table 8: Mexico Industrial Edge Computing Market Revenue (Million) Forecast, by Application 2019 & 2032
- Table 9: Global Industrial Edge Computing Market Revenue Million Forecast, by Country 2019 & 2032
- Table 10: Germany Industrial Edge Computing Market Revenue (Million) Forecast, by Application 2019 & 2032
- Table 11: United Kingdom Industrial Edge Computing Market Revenue (Million) Forecast, by Application 2019 & 2032
- Table 12: France Industrial Edge Computing Market Revenue (Million) Forecast, by Application 2019 & 2032
- Table 13: Spain Industrial Edge Computing Market Revenue (Million) Forecast, by Application 2019 & 2032
- Table 14: Italy Industrial Edge Computing Market Revenue (Million) Forecast, by Application 2019 & 2032
- Table 15: Spain Industrial Edge Computing Market Revenue (Million) Forecast, by Application 2019 & 2032
- Table 16: Belgium Industrial Edge Computing Market Revenue (Million) Forecast, by Application 2019 & 2032
- Table 17: Netherland Industrial Edge Computing Market Revenue (Million) Forecast, by Application 2019 & 2032
- Table 18: Nordics Industrial Edge Computing Market Revenue (Million) Forecast, by Application 2019 & 2032
- Table 19: Rest of Europe Industrial Edge Computing Market Revenue (Million) Forecast, by Application 2019 & 2032
- Table 20: Global Industrial Edge Computing Market Revenue Million Forecast, by Country 2019 & 2032
- Table 21: China Industrial Edge Computing Market Revenue (Million) Forecast, by Application 2019 & 2032
- Table 22: Japan Industrial Edge Computing Market Revenue (Million) Forecast, by Application 2019 & 2032
- Table 23: India Industrial Edge Computing Market Revenue (Million) Forecast, by Application 2019 & 2032
- Table 24: South Korea Industrial Edge Computing Market Revenue (Million) Forecast, by Application 2019 & 2032
- Table 25: Southeast Asia Industrial Edge Computing Market Revenue (Million) Forecast, by Application 2019 & 2032
- Table 26: Australia Industrial Edge Computing Market Revenue (Million) Forecast, by Application 2019 & 2032
- Table 27: Indonesia Industrial Edge Computing Market Revenue (Million) Forecast, by Application 2019 & 2032
- Table 28: Phillipes Industrial Edge Computing Market Revenue (Million) Forecast, by Application 2019 & 2032
- Table 29: Singapore Industrial Edge Computing Market Revenue (Million) Forecast, by Application 2019 & 2032
- Table 30: Thailandc Industrial Edge Computing Market Revenue (Million) Forecast, by Application 2019 & 2032
- Table 31: Rest of Asia Pacific Industrial Edge Computing Market Revenue (Million) Forecast, by Application 2019 & 2032
- Table 32: Global Industrial Edge Computing Market Revenue Million Forecast, by Country 2019 & 2032
- Table 33: Brazil Industrial Edge Computing Market Revenue (Million) Forecast, by Application 2019 & 2032
- Table 34: Argentina Industrial Edge Computing Market Revenue (Million) Forecast, by Application 2019 & 2032
- Table 35: Peru Industrial Edge Computing Market Revenue (Million) Forecast, by Application 2019 & 2032
- Table 36: Chile Industrial Edge Computing Market Revenue (Million) Forecast, by Application 2019 & 2032
- Table 37: Colombia Industrial Edge Computing Market Revenue (Million) Forecast, by Application 2019 & 2032
- Table 38: Ecuador Industrial Edge Computing Market Revenue (Million) Forecast, by Application 2019 & 2032
- Table 39: Venezuela Industrial Edge Computing Market Revenue (Million) Forecast, by Application 2019 & 2032
- Table 40: Rest of South America Industrial Edge Computing Market Revenue (Million) Forecast, by Application 2019 & 2032
- Table 41: Global Industrial Edge Computing Market Revenue Million Forecast, by Country 2019 & 2032
- Table 42: United States Industrial Edge Computing Market Revenue (Million) Forecast, by Application 2019 & 2032
- Table 43: Canada Industrial Edge Computing Market Revenue (Million) Forecast, by Application 2019 & 2032
- Table 44: Mexico Industrial Edge Computing Market Revenue (Million) Forecast, by Application 2019 & 2032
- Table 45: Global Industrial Edge Computing Market Revenue Million Forecast, by Country 2019 & 2032
- Table 46: United Arab Emirates Industrial Edge Computing Market Revenue (Million) Forecast, by Application 2019 & 2032
- Table 47: Saudi Arabia Industrial Edge Computing Market Revenue (Million) Forecast, by Application 2019 & 2032
- Table 48: South Africa Industrial Edge Computing Market Revenue (Million) Forecast, by Application 2019 & 2032
- Table 49: Rest of Middle East and Africa Industrial Edge Computing Market Revenue (Million) Forecast, by Application 2019 & 2032
- Table 50: Global Industrial Edge Computing Market Revenue Million Forecast, by Component 2019 & 2032
- Table 51: Global Industrial Edge Computing Market Revenue Million Forecast, by End-user Vertical 2019 & 2032
- Table 52: Global Industrial Edge Computing Market Revenue Million Forecast, by Country 2019 & 2032
- Table 53: Global Industrial Edge Computing Market Revenue Million Forecast, by Component 2019 & 2032
- Table 54: Global Industrial Edge Computing Market Revenue Million Forecast, by End-user Vertical 2019 & 2032
- Table 55: Global Industrial Edge Computing Market Revenue Million Forecast, by Country 2019 & 2032
- Table 56: Global Industrial Edge Computing Market Revenue Million Forecast, by Component 2019 & 2032
- Table 57: Global Industrial Edge Computing Market Revenue Million Forecast, by End-user Vertical 2019 & 2032
- Table 58: Global Industrial Edge Computing Market Revenue Million Forecast, by Country 2019 & 2032
- Table 59: Global Industrial Edge Computing Market Revenue Million Forecast, by Component 2019 & 2032
- Table 60: Global Industrial Edge Computing Market Revenue Million Forecast, by End-user Vertical 2019 & 2032
- Table 61: Global Industrial Edge Computing Market Revenue Million Forecast, by Country 2019 & 2032
- Table 62: Global Industrial Edge Computing Market Revenue Million Forecast, by Component 2019 & 2032
- Table 63: Global Industrial Edge Computing Market Revenue Million Forecast, by End-user Vertical 2019 & 2032
- Table 64: Global Industrial Edge Computing Market Revenue Million Forecast, by Country 2019 & 2032
- Table 65: Global Industrial Edge Computing Market Revenue Million Forecast, by Component 2019 & 2032
- Table 66: Global Industrial Edge Computing Market Revenue Million Forecast, by End-user Vertical 2019 & 2032
- Table 67: Global Industrial Edge Computing Market Revenue Million Forecast, by Country 2019 & 2032
Frequently Asked Questions
1. What is the projected Compound Annual Growth Rate (CAGR) of the Industrial Edge Computing Market?
The projected CAGR is approximately 13.48%.
2. Which companies are prominent players in the Industrial Edge Computing Market?
Key companies in the market include Rockwell Automation, IBM Corporation, Siemens, Microsoft Corporation, Honeywell International, Intel Corporation*List Not Exhaustive, Huawei Technologies, General Electric Company, SAP SE.
3. What are the main segments of the Industrial Edge Computing Market?
The market segments include Component, End-user Vertical.
4. Can you provide details about the market size?
The market size is estimated to be USD 49.75 Million as of 2022.
5. What are some drivers contributing to market growth?
Growing Demand For Automation in the Industrial Sector; Organizations shifting from cloud computing and storage systems to edge computing.
6. What are the notable trends driving market growth?
Oil and Gas sector is expected to grow at a higher pace.
7. Are there any restraints impacting market growth?
Introduction of a new technology to an ageing workforce exposes the skills gap.
8. Can you provide examples of recent developments in the market?
April 2024 - Machine Inc. and Siemens AG announced a partnership bringing manufacturing AI to on-premises automation networks. Sight Machine’s Manufacturing Data Platform is an end-to-end software system for collecting, contextualizing, and analyzing all types of manufacturing data to improve production. It enables manufacturers to unlock the power of industrial data to increase profitability, productivity, and sustainability. Siemens Industrial Edge is an edge computing platform consisting of applications, OT and IT connectivity, devices, and a central management system.
9. What pricing options are available for accessing the report?
Pricing options include single-user, multi-user, and enterprise licenses priced at USD 4750, USD 5250, and USD 8750 respectively.
10. Is the market size provided in terms of value or volume?
The market size is provided in terms of value, measured in Million.
11. Are there any specific market keywords associated with the report?
Yes, the market keyword associated with the report is "Industrial Edge Computing Market," which aids in identifying and referencing the specific market segment covered.
12. How do I determine which pricing option suits my needs best?
The pricing options vary based on user requirements and access needs. Individual users may opt for single-user licenses, while businesses requiring broader access may choose multi-user or enterprise licenses for cost-effective access to the report.
13. Are there any additional resources or data provided in the Industrial Edge Computing Market report?
While the report offers comprehensive insights, it's advisable to review the specific contents or supplementary materials provided to ascertain if additional resources or data are available.
14. How can I stay updated on further developments or reports in the Industrial Edge Computing Market?
To stay informed about further developments, trends, and reports in the Industrial Edge Computing Market, consider subscribing to industry newsletters, following relevant companies and organizations, or regularly checking reputable industry news sources and publications.
Methodology
Step 1 - Identification of Relevant Samples Size from Population Database


Step 2 - Approaches for Defining Global Market Size (Value, Volume* & Price*)

Note*: In applicable scenarios
Step 3 - Data Sources
Primary Research
- Web Analytics
- Survey Reports
- Research Institute
- Latest Research Reports
- Opinion Leaders
Secondary Research
- Annual Reports
- White Paper
- Latest Press Release
- Industry Association
- Paid Database
- Investor Presentations

Step 4 - Data Triangulation
Involves using different sources of information in order to increase the validity of a study
These sources are likely to be stakeholders in a program - participants, other researchers, program staff, other community members, and so on.
Then we put all data in single framework & apply various statistical tools to find out the dynamic on the market.
During the analysis stage, feedback from the stakeholder groups would be compared to determine areas of agreement as well as areas of divergence


