
Key Insights
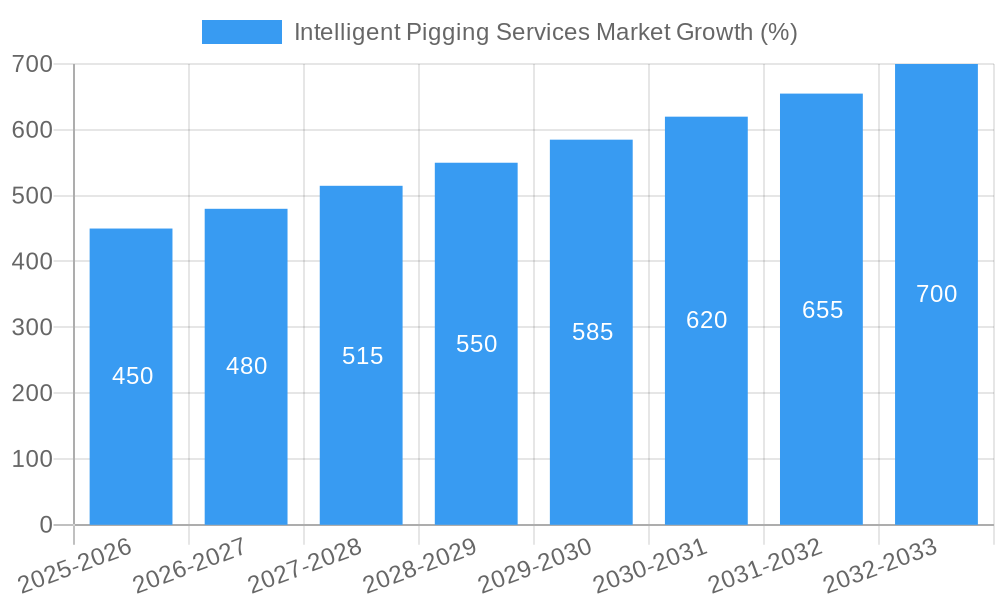
The Intelligent Pigging Services market is experiencing robust growth, driven by the increasing demand for efficient and cost-effective pipeline inspection and maintenance. A compound annual growth rate (CAGR) exceeding 5.70% indicates a significant expansion projected through 2033. This growth is fueled by several key factors: the aging global pipeline infrastructure necessitating regular inspections to prevent leaks and ensure safety; stringent government regulations mandating pipeline integrity management; and the rising adoption of intelligent pigging technologies offering superior accuracy and data analysis compared to traditional methods. The market is segmented by pigging type (intelligent, caliper, and others), application (crack & leakage detection, metal loss/corrosion detection, geometry measurement & bend detection, and others), and pipeline fluid type (oil and gas). Intelligent pigging holds a significant market share due to its advanced capabilities in detecting various pipeline anomalies with high precision. Growth is particularly strong in regions with extensive pipeline networks, such as North America and Asia-Pacific, driven by substantial investments in infrastructure development and maintenance. However, high initial investment costs associated with intelligent pigging technology and the need for specialized personnel can act as market restraints.
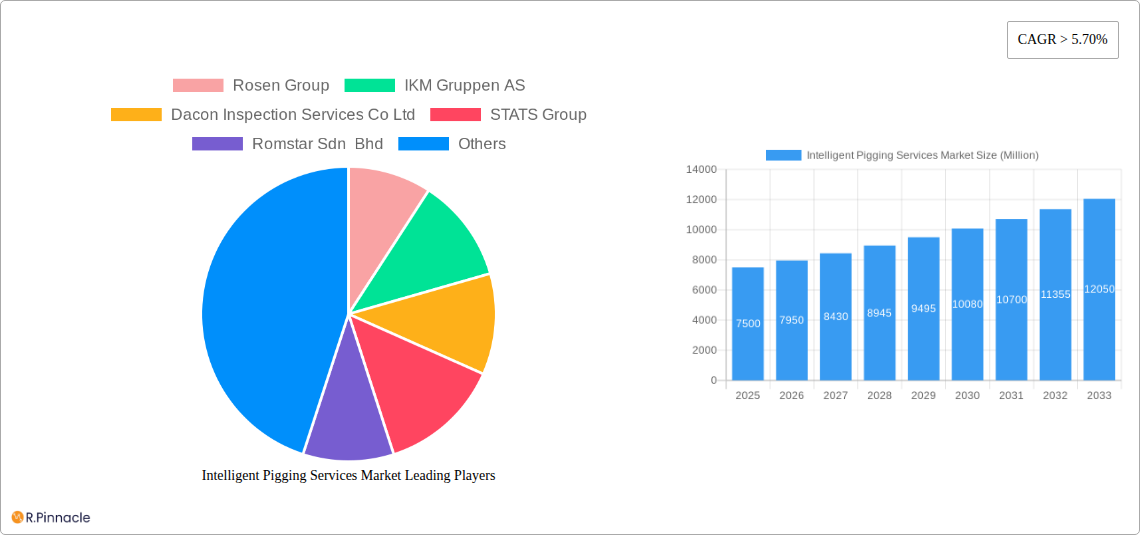
The competitive landscape is marked by the presence of both established players and emerging service providers. Major companies such as Rosen Group, IKM Gruppen AS, and Baker Hughes Company are leveraging their technological expertise and global reach to maintain their market positions. The ongoing development of advanced sensor technologies and data analytics solutions within intelligent pigging systems is further fueling market innovation. The increasing integration of artificial intelligence (AI) and machine learning (ML) in data analysis is enhancing the efficiency and accuracy of pipeline inspections, leading to improved risk assessment and predictive maintenance strategies. Future market expansion will depend on technological advancements, regulatory compliance, and the continuous growth of oil and gas exploration and production activities globally. Expansion into renewable energy infrastructure inspection also presents a significant opportunity for growth.
Intelligent Pigging Services Market Report: 2019-2033
This comprehensive report provides an in-depth analysis of the Intelligent Pigging Services Market, offering actionable insights for industry professionals and investors. Covering the period from 2019 to 2033, with a base year of 2025 and a forecast period of 2025-2033, this report meticulously examines market dynamics, key players, and future growth potential. The global Intelligent Pigging Services market is projected to reach xx Million by 2033, exhibiting a CAGR of xx% during the forecast period.
Intelligent Pigging Services Market Structure & Innovation Trends
This section analyzes the competitive landscape, innovation drivers, and regulatory influences shaping the Intelligent Pigging Services market. The market exhibits a moderately concentrated structure, with key players such as Rosen Group, IKM Gruppen AS, and Baker Hughes Company holding significant market share. However, the presence of numerous smaller, specialized companies fosters competition. Market share data for 2024 reveals Rosen Group at approximately xx%, IKM Gruppen AS at xx%, and Baker Hughes at xx%, with the remaining share distributed among other players. Innovation is driven by the need for enhanced detection capabilities, improved data analysis, and reduced operational costs. Recent M&A activity includes the acquisition of [Company A] by [Company B] in [Year] for an estimated value of xx Million, highlighting the strategic consolidation within the industry. Regulatory frameworks, particularly concerning pipeline safety and environmental regulations, significantly influence market growth. The development of more sophisticated intelligent pigging technologies is creating substitutes for traditional inspection methods, driving market expansion. The end-user demographic comprises primarily oil and gas companies, pipeline operators, and inspection service providers.
Intelligent Pigging Services Market Dynamics & Trends
The Intelligent Pigging Services market is experiencing robust growth fueled by several key factors. Increasing investments in pipeline infrastructure, particularly in emerging economies, are driving demand for efficient and reliable pipeline inspection services. Technological advancements, such as the integration of advanced sensors and data analytics, are enhancing the accuracy and efficiency of intelligent pigging operations. Growing concerns about pipeline safety and environmental compliance are pushing adoption rates upwards. Furthermore, the rising complexity of pipeline networks is escalating the need for sophisticated inspection techniques. Consumer preferences are shifting towards integrated services that encompass not only data acquisition but also analysis and reporting, driving the adoption of comprehensive service packages. Competitive dynamics are characterized by continuous innovation, strategic partnerships, and a focus on developing advanced technologies. The market penetration of intelligent pigging technologies is expected to further increase, exceeding xx% by 2033.
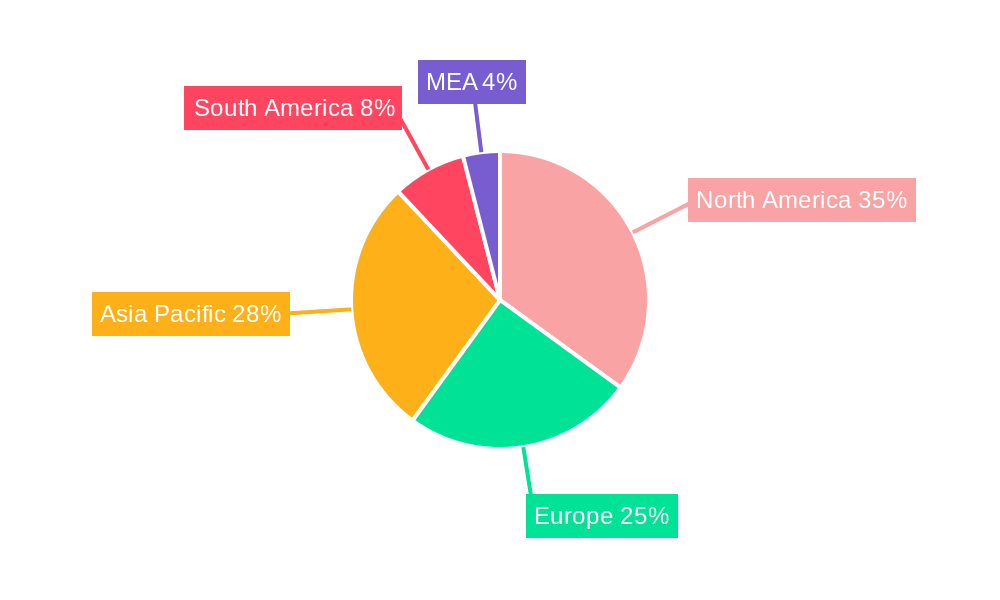
Dominant Regions & Segments in Intelligent Pigging Services Market
North America currently holds the largest market share in the Intelligent Pigging Services market, driven by extensive pipeline networks, stringent regulatory requirements, and significant investments in infrastructure modernization.
- Key Drivers in North America: Robust oil and gas industry, stringent pipeline safety regulations, and technological advancements.
- Key Drivers in Europe: Aging pipeline infrastructure requiring refurbishment, increasing emphasis on environmental compliance, and investments in renewable energy infrastructure (gas pipelines).
- Key Drivers in Asia Pacific: Rapid industrialization, expanding energy demand, and investment in pipeline construction.
Within segments:
- Pigging Type: Intelligent pigging dominates due to its advanced capabilities, followed by caliper pigging.
- Application: Crack & leakage detection and metal loss/corrosion detection are major applications.
- Pipeline Fluid Type: Oil pipelines currently account for a larger market share compared to gas pipelines, though both segments demonstrate substantial growth potential.
The detailed dominance analysis reveals a strong correlation between regional economic growth and pipeline infrastructure development, directly impacting the demand for intelligent pigging services.
Intelligent Pigging Services Market Product Innovations
Recent product innovations focus on enhancing the accuracy, speed, and efficiency of intelligent pigging operations. This includes the development of advanced sensors capable of detecting a wider range of anomalies, sophisticated data analysis algorithms that improve the interpretation of inspection data, and more efficient pigging tools that reduce downtime and costs. These innovations are providing competitive advantages by enabling faster inspections, improving detection rates, and reducing overall operational expenses, aligning perfectly with market demand for enhanced pipeline safety and operational efficiency.
Report Scope & Segmentation Analysis
This report segments the Intelligent Pigging Services market by pigging type (Intelligent Pigging, Caliper Pigging, Others), application (Crack & Leakage Detection, Metal Loss/Corrosion Detection, Geometry Measurement & Bend Detection, Others), and pipeline fluid type (Oil, Gas). Each segment is analyzed in terms of market size, growth projections, and competitive dynamics. The market for Intelligent Pigging is expected to grow at a faster rate than caliper pigging due to its advanced capabilities. Crack & Leakage detection constitutes a significant portion of the application segment, driven by safety concerns. Oil pipelines represent a larger market share currently, but the gas pipeline segment shows considerable growth potential.
Key Drivers of Intelligent Pigging Services Market Growth
The growth of the Intelligent Pigging Services market is primarily driven by several factors: the increasing need for efficient and reliable pipeline inspection to ensure safety and prevent environmental damage; stringent government regulations promoting pipeline safety and maintenance; technological advancements leading to improved accuracy and efficiency of intelligent pigging tools; rising investments in pipeline infrastructure globally, particularly in developing economies.
Challenges in the Intelligent Pigging Services Market Sector
Challenges include the high initial investment costs of intelligent pigging equipment, the complexity of data analysis and interpretation, and the potential for environmental disruptions during pigging operations. Competition from alternative inspection methods and the need for skilled personnel are also significant constraints. These factors can impact market penetration and limit the overall growth potential. The impact of these challenges is estimated to reduce overall market growth by approximately xx% during the forecast period.
Emerging Opportunities in Intelligent Pigging Services Market
Emerging opportunities lie in the development of advanced data analytics capabilities, the integration of intelligent pigging with other pipeline monitoring technologies, and the expansion into new geographical markets, particularly in regions with rapidly developing pipeline infrastructure. The increasing demand for integrated pipeline inspection and management solutions also presents significant growth opportunities.
Leading Players in the Intelligent Pigging Services Market Market
- Rosen Group
- IKM Gruppen AS
- Dacon Inspection Services Co Ltd
- STATS Group
- Romstar Sdn Bhd
- Penspen Limited
- Oil States Industries
- Rouge Pipeline & Process Services
- Baker Hughes Company
- Enduro Pipeline Services Inc
- Onstream Pipeline Inspection Ltd
- T D Williamson Inc
- NDT Global Services Ltd
Key Developments in Intelligent Pigging Services Market Industry
- January 2023: Rosen Group launched a new intelligent pigging technology with enhanced detection capabilities.
- May 2022: Baker Hughes acquired a smaller intelligent pigging company, expanding its service portfolio.
- October 2021: New safety regulations were implemented in [Region], impacting the adoption of intelligent pigging technology.
Future Outlook for Intelligent Pigging Services Market Market
The future outlook for the Intelligent Pigging Services market is positive, driven by continuous technological advancements, increasing pipeline infrastructure investment, and growing emphasis on pipeline safety and environmental compliance. Strategic partnerships and acquisitions will further consolidate the market landscape. The market is poised for significant growth, driven by the adoption of advanced technologies and expansion into new regions.
Intelligent Pigging Services Market Segmentation
-
1. Pigging Type
-
1.1. Intelligent Pigging
- 1.1.1. Magnetic Flux Leakage (MFL) Pigging
- 1.1.2. Ultrasonic Test Pigging
- 1.1.3. Caliper Pigging
- 1.2. Others
-
1.1. Intelligent Pigging
-
2. Application
- 2.1. Crack & Leakage Detection
- 2.2. Metal Loss/Corrosion Detection
- 2.3. Geometry Measurement & Bend Detection
- 2.4. Others
-
3. Pipeline Fluid Type
- 3.1. Oil
- 3.2. Gas
Intelligent Pigging Services Market Segmentation By Geography
- 1. North America
- 2. Europe
- 3. Asia Pacific
- 4. Middle East and Africa
- 5. South America
Intelligent Pigging Services Market REPORT HIGHLIGHTS
| Aspects | Details |
|---|---|
| Study Period | 2019-2033 |
| Base Year | 2024 |
| Estimated Year | 2025 |
| Forecast Period | 2025-2033 |
| Historical Period | 2019-2024 |
| Growth Rate | CAGR of > 5.70% from 2019-2033 |
| Segmentation |
|
Table of Contents
- 1. Introduction
- 1.1. Research Scope
- 1.2. Market Segmentation
- 1.3. Research Methodology
- 1.4. Definitions and Assumptions
- 2. Executive Summary
- 2.1. Introduction
- 3. Market Dynamics
- 3.1. Introduction
- 3.2. Market Drivers
- 3.2.1. 4.; Growing Demand for Renewable Energy4.; Upcoming Investments in the Energy Sector and Supportive Renewable Energy Policies
- 3.3. Market Restrains
- 3.3.1. 4.; High Initial Investment Cost and Long Investment Return Period on Projects
- 3.4. Market Trends
- 3.4.1. Intelligent Pigging Segment to Dominate the Market
- 4. Market Factor Analysis
- 4.1. Porters Five Forces
- 4.2. Supply/Value Chain
- 4.3. PESTEL analysis
- 4.4. Market Entropy
- 4.5. Patent/Trademark Analysis
- 5. Global Intelligent Pigging Services Market Analysis, Insights and Forecast, 2019-2031
- 5.1. Market Analysis, Insights and Forecast - by Pigging Type
- 5.1.1. Intelligent Pigging
- 5.1.1.1. Magnetic Flux Leakage (MFL) Pigging
- 5.1.1.2. Ultrasonic Test Pigging
- 5.1.1.3. Caliper Pigging
- 5.1.2. Others
- 5.1.1. Intelligent Pigging
- 5.2. Market Analysis, Insights and Forecast - by Application
- 5.2.1. Crack & Leakage Detection
- 5.2.2. Metal Loss/Corrosion Detection
- 5.2.3. Geometry Measurement & Bend Detection
- 5.2.4. Others
- 5.3. Market Analysis, Insights and Forecast - by Pipeline Fluid Type
- 5.3.1. Oil
- 5.3.2. Gas
- 5.4. Market Analysis, Insights and Forecast - by Region
- 5.4.1. North America
- 5.4.2. Europe
- 5.4.3. Asia Pacific
- 5.4.4. Middle East and Africa
- 5.4.5. South America
- 5.1. Market Analysis, Insights and Forecast - by Pigging Type
- 6. North America Intelligent Pigging Services Market Analysis, Insights and Forecast, 2019-2031
- 6.1. Market Analysis, Insights and Forecast - by Pigging Type
- 6.1.1. Intelligent Pigging
- 6.1.1.1. Magnetic Flux Leakage (MFL) Pigging
- 6.1.1.2. Ultrasonic Test Pigging
- 6.1.1.3. Caliper Pigging
- 6.1.2. Others
- 6.1.1. Intelligent Pigging
- 6.2. Market Analysis, Insights and Forecast - by Application
- 6.2.1. Crack & Leakage Detection
- 6.2.2. Metal Loss/Corrosion Detection
- 6.2.3. Geometry Measurement & Bend Detection
- 6.2.4. Others
- 6.3. Market Analysis, Insights and Forecast - by Pipeline Fluid Type
- 6.3.1. Oil
- 6.3.2. Gas
- 6.1. Market Analysis, Insights and Forecast - by Pigging Type
- 7. Europe Intelligent Pigging Services Market Analysis, Insights and Forecast, 2019-2031
- 7.1. Market Analysis, Insights and Forecast - by Pigging Type
- 7.1.1. Intelligent Pigging
- 7.1.1.1. Magnetic Flux Leakage (MFL) Pigging
- 7.1.1.2. Ultrasonic Test Pigging
- 7.1.1.3. Caliper Pigging
- 7.1.2. Others
- 7.1.1. Intelligent Pigging
- 7.2. Market Analysis, Insights and Forecast - by Application
- 7.2.1. Crack & Leakage Detection
- 7.2.2. Metal Loss/Corrosion Detection
- 7.2.3. Geometry Measurement & Bend Detection
- 7.2.4. Others
- 7.3. Market Analysis, Insights and Forecast - by Pipeline Fluid Type
- 7.3.1. Oil
- 7.3.2. Gas
- 7.1. Market Analysis, Insights and Forecast - by Pigging Type
- 8. Asia Pacific Intelligent Pigging Services Market Analysis, Insights and Forecast, 2019-2031
- 8.1. Market Analysis, Insights and Forecast - by Pigging Type
- 8.1.1. Intelligent Pigging
- 8.1.1.1. Magnetic Flux Leakage (MFL) Pigging
- 8.1.1.2. Ultrasonic Test Pigging
- 8.1.1.3. Caliper Pigging
- 8.1.2. Others
- 8.1.1. Intelligent Pigging
- 8.2. Market Analysis, Insights and Forecast - by Application
- 8.2.1. Crack & Leakage Detection
- 8.2.2. Metal Loss/Corrosion Detection
- 8.2.3. Geometry Measurement & Bend Detection
- 8.2.4. Others
- 8.3. Market Analysis, Insights and Forecast - by Pipeline Fluid Type
- 8.3.1. Oil
- 8.3.2. Gas
- 8.1. Market Analysis, Insights and Forecast - by Pigging Type
- 9. Middle East and Africa Intelligent Pigging Services Market Analysis, Insights and Forecast, 2019-2031
- 9.1. Market Analysis, Insights and Forecast - by Pigging Type
- 9.1.1. Intelligent Pigging
- 9.1.1.1. Magnetic Flux Leakage (MFL) Pigging
- 9.1.1.2. Ultrasonic Test Pigging
- 9.1.1.3. Caliper Pigging
- 9.1.2. Others
- 9.1.1. Intelligent Pigging
- 9.2. Market Analysis, Insights and Forecast - by Application
- 9.2.1. Crack & Leakage Detection
- 9.2.2. Metal Loss/Corrosion Detection
- 9.2.3. Geometry Measurement & Bend Detection
- 9.2.4. Others
- 9.3. Market Analysis, Insights and Forecast - by Pipeline Fluid Type
- 9.3.1. Oil
- 9.3.2. Gas
- 9.1. Market Analysis, Insights and Forecast - by Pigging Type
- 10. South America Intelligent Pigging Services Market Analysis, Insights and Forecast, 2019-2031
- 10.1. Market Analysis, Insights and Forecast - by Pigging Type
- 10.1.1. Intelligent Pigging
- 10.1.1.1. Magnetic Flux Leakage (MFL) Pigging
- 10.1.1.2. Ultrasonic Test Pigging
- 10.1.1.3. Caliper Pigging
- 10.1.2. Others
- 10.1.1. Intelligent Pigging
- 10.2. Market Analysis, Insights and Forecast - by Application
- 10.2.1. Crack & Leakage Detection
- 10.2.2. Metal Loss/Corrosion Detection
- 10.2.3. Geometry Measurement & Bend Detection
- 10.2.4. Others
- 10.3. Market Analysis, Insights and Forecast - by Pipeline Fluid Type
- 10.3.1. Oil
- 10.3.2. Gas
- 10.1. Market Analysis, Insights and Forecast - by Pigging Type
- 11. North America Intelligent Pigging Services Market Analysis, Insights and Forecast, 2019-2031
- 11.1. Market Analysis, Insights and Forecast - By Country/Sub-region
- 11.1.1 United States
- 11.1.2 Canada
- 11.1.3 Mexico
- 12. Europe Intelligent Pigging Services Market Analysis, Insights and Forecast, 2019-2031
- 12.1. Market Analysis, Insights and Forecast - By Country/Sub-region
- 12.1.1 Germany
- 12.1.2 United Kingdom
- 12.1.3 France
- 12.1.4 Spain
- 12.1.5 Italy
- 12.1.6 Spain
- 12.1.7 Belgium
- 12.1.8 Netherland
- 12.1.9 Nordics
- 12.1.10 Rest of Europe
- 13. Asia Pacific Intelligent Pigging Services Market Analysis, Insights and Forecast, 2019-2031
- 13.1. Market Analysis, Insights and Forecast - By Country/Sub-region
- 13.1.1 China
- 13.1.2 Japan
- 13.1.3 India
- 13.1.4 South Korea
- 13.1.5 Southeast Asia
- 13.1.6 Australia
- 13.1.7 Indonesia
- 13.1.8 Phillipes
- 13.1.9 Singapore
- 13.1.10 Thailandc
- 13.1.11 Rest of Asia Pacific
- 14. South America Intelligent Pigging Services Market Analysis, Insights and Forecast, 2019-2031
- 14.1. Market Analysis, Insights and Forecast - By Country/Sub-region
- 14.1.1 Brazil
- 14.1.2 Argentina
- 14.1.3 Peru
- 14.1.4 Chile
- 14.1.5 Colombia
- 14.1.6 Ecuador
- 14.1.7 Venezuela
- 14.1.8 Rest of South America
- 15. MEA Intelligent Pigging Services Market Analysis, Insights and Forecast, 2019-2031
- 15.1. Market Analysis, Insights and Forecast - By Country/Sub-region
- 15.1.1 United Arab Emirates
- 15.1.2 Saudi Arabia
- 15.1.3 South Africa
- 15.1.4 Rest of Middle East and Africa
- 16. Competitive Analysis
- 16.1. Global Market Share Analysis 2024
- 16.2. Company Profiles
- 16.2.1 Rosen Group
- 16.2.1.1. Overview
- 16.2.1.2. Products
- 16.2.1.3. SWOT Analysis
- 16.2.1.4. Recent Developments
- 16.2.1.5. Financials (Based on Availability)
- 16.2.2 IKM Gruppen AS
- 16.2.2.1. Overview
- 16.2.2.2. Products
- 16.2.2.3. SWOT Analysis
- 16.2.2.4. Recent Developments
- 16.2.2.5. Financials (Based on Availability)
- 16.2.3 Dacon Inspection Services Co Ltd
- 16.2.3.1. Overview
- 16.2.3.2. Products
- 16.2.3.3. SWOT Analysis
- 16.2.3.4. Recent Developments
- 16.2.3.5. Financials (Based on Availability)
- 16.2.4 STATS Group
- 16.2.4.1. Overview
- 16.2.4.2. Products
- 16.2.4.3. SWOT Analysis
- 16.2.4.4. Recent Developments
- 16.2.4.5. Financials (Based on Availability)
- 16.2.5 Romstar Sdn Bhd
- 16.2.5.1. Overview
- 16.2.5.2. Products
- 16.2.5.3. SWOT Analysis
- 16.2.5.4. Recent Developments
- 16.2.5.5. Financials (Based on Availability)
- 16.2.6 Penspen Limited
- 16.2.6.1. Overview
- 16.2.6.2. Products
- 16.2.6.3. SWOT Analysis
- 16.2.6.4. Recent Developments
- 16.2.6.5. Financials (Based on Availability)
- 16.2.7 Oil States Industries
- 16.2.7.1. Overview
- 16.2.7.2. Products
- 16.2.7.3. SWOT Analysis
- 16.2.7.4. Recent Developments
- 16.2.7.5. Financials (Based on Availability)
- 16.2.8 Rouge Pipeline & Process Services
- 16.2.8.1. Overview
- 16.2.8.2. Products
- 16.2.8.3. SWOT Analysis
- 16.2.8.4. Recent Developments
- 16.2.8.5. Financials (Based on Availability)
- 16.2.9 Baker Hughes Company
- 16.2.9.1. Overview
- 16.2.9.2. Products
- 16.2.9.3. SWOT Analysis
- 16.2.9.4. Recent Developments
- 16.2.9.5. Financials (Based on Availability)
- 16.2.10 Enduro Pipeline Services Inc
- 16.2.10.1. Overview
- 16.2.10.2. Products
- 16.2.10.3. SWOT Analysis
- 16.2.10.4. Recent Developments
- 16.2.10.5. Financials (Based on Availability)
- 16.2.11 Onstream Pipeline Inspection Ltd
- 16.2.11.1. Overview
- 16.2.11.2. Products
- 16.2.11.3. SWOT Analysis
- 16.2.11.4. Recent Developments
- 16.2.11.5. Financials (Based on Availability)
- 16.2.12 T D Williamson Inc
- 16.2.12.1. Overview
- 16.2.12.2. Products
- 16.2.12.3. SWOT Analysis
- 16.2.12.4. Recent Developments
- 16.2.12.5. Financials (Based on Availability)
- 16.2.13 NDT Global Services Ltd
- 16.2.13.1. Overview
- 16.2.13.2. Products
- 16.2.13.3. SWOT Analysis
- 16.2.13.4. Recent Developments
- 16.2.13.5. Financials (Based on Availability)
- 16.2.1 Rosen Group
List of Figures
- Figure 1: Global Intelligent Pigging Services Market Revenue Breakdown (Million, %) by Region 2024 & 2032
- Figure 2: North America Intelligent Pigging Services Market Revenue (Million), by Country 2024 & 2032
- Figure 3: North America Intelligent Pigging Services Market Revenue Share (%), by Country 2024 & 2032
- Figure 4: Europe Intelligent Pigging Services Market Revenue (Million), by Country 2024 & 2032
- Figure 5: Europe Intelligent Pigging Services Market Revenue Share (%), by Country 2024 & 2032
- Figure 6: Asia Pacific Intelligent Pigging Services Market Revenue (Million), by Country 2024 & 2032
- Figure 7: Asia Pacific Intelligent Pigging Services Market Revenue Share (%), by Country 2024 & 2032
- Figure 8: South America Intelligent Pigging Services Market Revenue (Million), by Country 2024 & 2032
- Figure 9: South America Intelligent Pigging Services Market Revenue Share (%), by Country 2024 & 2032
- Figure 10: MEA Intelligent Pigging Services Market Revenue (Million), by Country 2024 & 2032
- Figure 11: MEA Intelligent Pigging Services Market Revenue Share (%), by Country 2024 & 2032
- Figure 12: North America Intelligent Pigging Services Market Revenue (Million), by Pigging Type 2024 & 2032
- Figure 13: North America Intelligent Pigging Services Market Revenue Share (%), by Pigging Type 2024 & 2032
- Figure 14: North America Intelligent Pigging Services Market Revenue (Million), by Application 2024 & 2032
- Figure 15: North America Intelligent Pigging Services Market Revenue Share (%), by Application 2024 & 2032
- Figure 16: North America Intelligent Pigging Services Market Revenue (Million), by Pipeline Fluid Type 2024 & 2032
- Figure 17: North America Intelligent Pigging Services Market Revenue Share (%), by Pipeline Fluid Type 2024 & 2032
- Figure 18: North America Intelligent Pigging Services Market Revenue (Million), by Country 2024 & 2032
- Figure 19: North America Intelligent Pigging Services Market Revenue Share (%), by Country 2024 & 2032
- Figure 20: Europe Intelligent Pigging Services Market Revenue (Million), by Pigging Type 2024 & 2032
- Figure 21: Europe Intelligent Pigging Services Market Revenue Share (%), by Pigging Type 2024 & 2032
- Figure 22: Europe Intelligent Pigging Services Market Revenue (Million), by Application 2024 & 2032
- Figure 23: Europe Intelligent Pigging Services Market Revenue Share (%), by Application 2024 & 2032
- Figure 24: Europe Intelligent Pigging Services Market Revenue (Million), by Pipeline Fluid Type 2024 & 2032
- Figure 25: Europe Intelligent Pigging Services Market Revenue Share (%), by Pipeline Fluid Type 2024 & 2032
- Figure 26: Europe Intelligent Pigging Services Market Revenue (Million), by Country 2024 & 2032
- Figure 27: Europe Intelligent Pigging Services Market Revenue Share (%), by Country 2024 & 2032
- Figure 28: Asia Pacific Intelligent Pigging Services Market Revenue (Million), by Pigging Type 2024 & 2032
- Figure 29: Asia Pacific Intelligent Pigging Services Market Revenue Share (%), by Pigging Type 2024 & 2032
- Figure 30: Asia Pacific Intelligent Pigging Services Market Revenue (Million), by Application 2024 & 2032
- Figure 31: Asia Pacific Intelligent Pigging Services Market Revenue Share (%), by Application 2024 & 2032
- Figure 32: Asia Pacific Intelligent Pigging Services Market Revenue (Million), by Pipeline Fluid Type 2024 & 2032
- Figure 33: Asia Pacific Intelligent Pigging Services Market Revenue Share (%), by Pipeline Fluid Type 2024 & 2032
- Figure 34: Asia Pacific Intelligent Pigging Services Market Revenue (Million), by Country 2024 & 2032
- Figure 35: Asia Pacific Intelligent Pigging Services Market Revenue Share (%), by Country 2024 & 2032
- Figure 36: Middle East and Africa Intelligent Pigging Services Market Revenue (Million), by Pigging Type 2024 & 2032
- Figure 37: Middle East and Africa Intelligent Pigging Services Market Revenue Share (%), by Pigging Type 2024 & 2032
- Figure 38: Middle East and Africa Intelligent Pigging Services Market Revenue (Million), by Application 2024 & 2032
- Figure 39: Middle East and Africa Intelligent Pigging Services Market Revenue Share (%), by Application 2024 & 2032
- Figure 40: Middle East and Africa Intelligent Pigging Services Market Revenue (Million), by Pipeline Fluid Type 2024 & 2032
- Figure 41: Middle East and Africa Intelligent Pigging Services Market Revenue Share (%), by Pipeline Fluid Type 2024 & 2032
- Figure 42: Middle East and Africa Intelligent Pigging Services Market Revenue (Million), by Country 2024 & 2032
- Figure 43: Middle East and Africa Intelligent Pigging Services Market Revenue Share (%), by Country 2024 & 2032
- Figure 44: South America Intelligent Pigging Services Market Revenue (Million), by Pigging Type 2024 & 2032
- Figure 45: South America Intelligent Pigging Services Market Revenue Share (%), by Pigging Type 2024 & 2032
- Figure 46: South America Intelligent Pigging Services Market Revenue (Million), by Application 2024 & 2032
- Figure 47: South America Intelligent Pigging Services Market Revenue Share (%), by Application 2024 & 2032
- Figure 48: South America Intelligent Pigging Services Market Revenue (Million), by Pipeline Fluid Type 2024 & 2032
- Figure 49: South America Intelligent Pigging Services Market Revenue Share (%), by Pipeline Fluid Type 2024 & 2032
- Figure 50: South America Intelligent Pigging Services Market Revenue (Million), by Country 2024 & 2032
- Figure 51: South America Intelligent Pigging Services Market Revenue Share (%), by Country 2024 & 2032
List of Tables
- Table 1: Global Intelligent Pigging Services Market Revenue Million Forecast, by Region 2019 & 2032
- Table 2: Global Intelligent Pigging Services Market Revenue Million Forecast, by Pigging Type 2019 & 2032
- Table 3: Global Intelligent Pigging Services Market Revenue Million Forecast, by Application 2019 & 2032
- Table 4: Global Intelligent Pigging Services Market Revenue Million Forecast, by Pipeline Fluid Type 2019 & 2032
- Table 5: Global Intelligent Pigging Services Market Revenue Million Forecast, by Region 2019 & 2032
- Table 6: Global Intelligent Pigging Services Market Revenue Million Forecast, by Country 2019 & 2032
- Table 7: United States Intelligent Pigging Services Market Revenue (Million) Forecast, by Application 2019 & 2032
- Table 8: Canada Intelligent Pigging Services Market Revenue (Million) Forecast, by Application 2019 & 2032
- Table 9: Mexico Intelligent Pigging Services Market Revenue (Million) Forecast, by Application 2019 & 2032
- Table 10: Global Intelligent Pigging Services Market Revenue Million Forecast, by Country 2019 & 2032
- Table 11: Germany Intelligent Pigging Services Market Revenue (Million) Forecast, by Application 2019 & 2032
- Table 12: United Kingdom Intelligent Pigging Services Market Revenue (Million) Forecast, by Application 2019 & 2032
- Table 13: France Intelligent Pigging Services Market Revenue (Million) Forecast, by Application 2019 & 2032
- Table 14: Spain Intelligent Pigging Services Market Revenue (Million) Forecast, by Application 2019 & 2032
- Table 15: Italy Intelligent Pigging Services Market Revenue (Million) Forecast, by Application 2019 & 2032
- Table 16: Spain Intelligent Pigging Services Market Revenue (Million) Forecast, by Application 2019 & 2032
- Table 17: Belgium Intelligent Pigging Services Market Revenue (Million) Forecast, by Application 2019 & 2032
- Table 18: Netherland Intelligent Pigging Services Market Revenue (Million) Forecast, by Application 2019 & 2032
- Table 19: Nordics Intelligent Pigging Services Market Revenue (Million) Forecast, by Application 2019 & 2032
- Table 20: Rest of Europe Intelligent Pigging Services Market Revenue (Million) Forecast, by Application 2019 & 2032
- Table 21: Global Intelligent Pigging Services Market Revenue Million Forecast, by Country 2019 & 2032
- Table 22: China Intelligent Pigging Services Market Revenue (Million) Forecast, by Application 2019 & 2032
- Table 23: Japan Intelligent Pigging Services Market Revenue (Million) Forecast, by Application 2019 & 2032
- Table 24: India Intelligent Pigging Services Market Revenue (Million) Forecast, by Application 2019 & 2032
- Table 25: South Korea Intelligent Pigging Services Market Revenue (Million) Forecast, by Application 2019 & 2032
- Table 26: Southeast Asia Intelligent Pigging Services Market Revenue (Million) Forecast, by Application 2019 & 2032
- Table 27: Australia Intelligent Pigging Services Market Revenue (Million) Forecast, by Application 2019 & 2032
- Table 28: Indonesia Intelligent Pigging Services Market Revenue (Million) Forecast, by Application 2019 & 2032
- Table 29: Phillipes Intelligent Pigging Services Market Revenue (Million) Forecast, by Application 2019 & 2032
- Table 30: Singapore Intelligent Pigging Services Market Revenue (Million) Forecast, by Application 2019 & 2032
- Table 31: Thailandc Intelligent Pigging Services Market Revenue (Million) Forecast, by Application 2019 & 2032
- Table 32: Rest of Asia Pacific Intelligent Pigging Services Market Revenue (Million) Forecast, by Application 2019 & 2032
- Table 33: Global Intelligent Pigging Services Market Revenue Million Forecast, by Country 2019 & 2032
- Table 34: Brazil Intelligent Pigging Services Market Revenue (Million) Forecast, by Application 2019 & 2032
- Table 35: Argentina Intelligent Pigging Services Market Revenue (Million) Forecast, by Application 2019 & 2032
- Table 36: Peru Intelligent Pigging Services Market Revenue (Million) Forecast, by Application 2019 & 2032
- Table 37: Chile Intelligent Pigging Services Market Revenue (Million) Forecast, by Application 2019 & 2032
- Table 38: Colombia Intelligent Pigging Services Market Revenue (Million) Forecast, by Application 2019 & 2032
- Table 39: Ecuador Intelligent Pigging Services Market Revenue (Million) Forecast, by Application 2019 & 2032
- Table 40: Venezuela Intelligent Pigging Services Market Revenue (Million) Forecast, by Application 2019 & 2032
- Table 41: Rest of South America Intelligent Pigging Services Market Revenue (Million) Forecast, by Application 2019 & 2032
- Table 42: Global Intelligent Pigging Services Market Revenue Million Forecast, by Country 2019 & 2032
- Table 43: United Arab Emirates Intelligent Pigging Services Market Revenue (Million) Forecast, by Application 2019 & 2032
- Table 44: Saudi Arabia Intelligent Pigging Services Market Revenue (Million) Forecast, by Application 2019 & 2032
- Table 45: South Africa Intelligent Pigging Services Market Revenue (Million) Forecast, by Application 2019 & 2032
- Table 46: Rest of Middle East and Africa Intelligent Pigging Services Market Revenue (Million) Forecast, by Application 2019 & 2032
- Table 47: Global Intelligent Pigging Services Market Revenue Million Forecast, by Pigging Type 2019 & 2032
- Table 48: Global Intelligent Pigging Services Market Revenue Million Forecast, by Application 2019 & 2032
- Table 49: Global Intelligent Pigging Services Market Revenue Million Forecast, by Pipeline Fluid Type 2019 & 2032
- Table 50: Global Intelligent Pigging Services Market Revenue Million Forecast, by Country 2019 & 2032
- Table 51: Global Intelligent Pigging Services Market Revenue Million Forecast, by Pigging Type 2019 & 2032
- Table 52: Global Intelligent Pigging Services Market Revenue Million Forecast, by Application 2019 & 2032
- Table 53: Global Intelligent Pigging Services Market Revenue Million Forecast, by Pipeline Fluid Type 2019 & 2032
- Table 54: Global Intelligent Pigging Services Market Revenue Million Forecast, by Country 2019 & 2032
- Table 55: Global Intelligent Pigging Services Market Revenue Million Forecast, by Pigging Type 2019 & 2032
- Table 56: Global Intelligent Pigging Services Market Revenue Million Forecast, by Application 2019 & 2032
- Table 57: Global Intelligent Pigging Services Market Revenue Million Forecast, by Pipeline Fluid Type 2019 & 2032
- Table 58: Global Intelligent Pigging Services Market Revenue Million Forecast, by Country 2019 & 2032
- Table 59: Global Intelligent Pigging Services Market Revenue Million Forecast, by Pigging Type 2019 & 2032
- Table 60: Global Intelligent Pigging Services Market Revenue Million Forecast, by Application 2019 & 2032
- Table 61: Global Intelligent Pigging Services Market Revenue Million Forecast, by Pipeline Fluid Type 2019 & 2032
- Table 62: Global Intelligent Pigging Services Market Revenue Million Forecast, by Country 2019 & 2032
- Table 63: Global Intelligent Pigging Services Market Revenue Million Forecast, by Pigging Type 2019 & 2032
- Table 64: Global Intelligent Pigging Services Market Revenue Million Forecast, by Application 2019 & 2032
- Table 65: Global Intelligent Pigging Services Market Revenue Million Forecast, by Pipeline Fluid Type 2019 & 2032
- Table 66: Global Intelligent Pigging Services Market Revenue Million Forecast, by Country 2019 & 2032
Frequently Asked Questions
1. What is the projected Compound Annual Growth Rate (CAGR) of the Intelligent Pigging Services Market?
The projected CAGR is approximately > 5.70%.
2. Which companies are prominent players in the Intelligent Pigging Services Market?
Key companies in the market include Rosen Group, IKM Gruppen AS, Dacon Inspection Services Co Ltd, STATS Group, Romstar Sdn Bhd, Penspen Limited, Oil States Industries, Rouge Pipeline & Process Services, Baker Hughes Company, Enduro Pipeline Services Inc, Onstream Pipeline Inspection Ltd, T D Williamson Inc, NDT Global Services Ltd.
3. What are the main segments of the Intelligent Pigging Services Market?
The market segments include Pigging Type, Application, Pipeline Fluid Type.
4. Can you provide details about the market size?
The market size is estimated to be USD XX Million as of 2022.
5. What are some drivers contributing to market growth?
4.; Growing Demand for Renewable Energy4.; Upcoming Investments in the Energy Sector and Supportive Renewable Energy Policies.
6. What are the notable trends driving market growth?
Intelligent Pigging Segment to Dominate the Market.
7. Are there any restraints impacting market growth?
4.; High Initial Investment Cost and Long Investment Return Period on Projects.
8. Can you provide examples of recent developments in the market?
N/A
9. What pricing options are available for accessing the report?
Pricing options include single-user, multi-user, and enterprise licenses priced at USD 4750, USD 5250, and USD 8750 respectively.
10. Is the market size provided in terms of value or volume?
The market size is provided in terms of value, measured in Million.
11. Are there any specific market keywords associated with the report?
Yes, the market keyword associated with the report is "Intelligent Pigging Services Market," which aids in identifying and referencing the specific market segment covered.
12. How do I determine which pricing option suits my needs best?
The pricing options vary based on user requirements and access needs. Individual users may opt for single-user licenses, while businesses requiring broader access may choose multi-user or enterprise licenses for cost-effective access to the report.
13. Are there any additional resources or data provided in the Intelligent Pigging Services Market report?
While the report offers comprehensive insights, it's advisable to review the specific contents or supplementary materials provided to ascertain if additional resources or data are available.
14. How can I stay updated on further developments or reports in the Intelligent Pigging Services Market?
To stay informed about further developments, trends, and reports in the Intelligent Pigging Services Market, consider subscribing to industry newsletters, following relevant companies and organizations, or regularly checking reputable industry news sources and publications.
Methodology
Step 1 - Identification of Relevant Samples Size from Population Database


Step 2 - Approaches for Defining Global Market Size (Value, Volume* & Price*)

Note*: In applicable scenarios
Step 3 - Data Sources
Primary Research
- Web Analytics
- Survey Reports
- Research Institute
- Latest Research Reports
- Opinion Leaders
Secondary Research
- Annual Reports
- White Paper
- Latest Press Release
- Industry Association
- Paid Database
- Investor Presentations

Step 4 - Data Triangulation
Involves using different sources of information in order to increase the validity of a study
These sources are likely to be stakeholders in a program - participants, other researchers, program staff, other community members, and so on.
Then we put all data in single framework & apply various statistical tools to find out the dynamic on the market.
During the analysis stage, feedback from the stakeholder groups would be compared to determine areas of agreement as well as areas of divergence


