
Key Insights
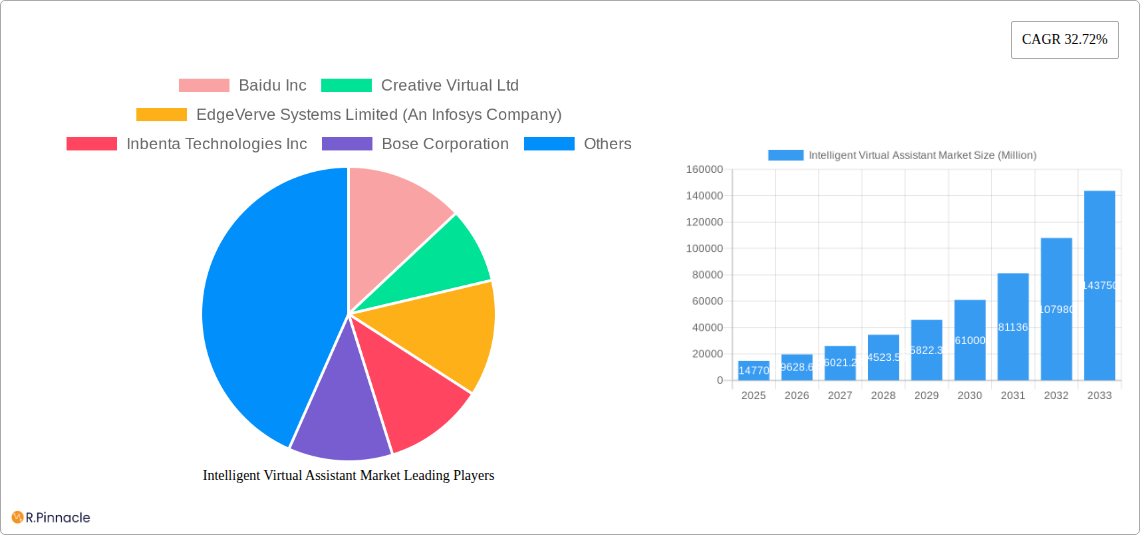
The Intelligent Virtual Assistant (IVA) market is experiencing robust growth, projected to reach a market size of $14.77 billion in 2025 and exhibiting a Compound Annual Growth Rate (CAGR) of 32.72%. This expansion is driven by several key factors. The increasing adoption of chatbots across various industries, from customer service and e-commerce to healthcare and finance, is a major contributor. The seamless integration of IVAs into smart speakers further fuels market growth, providing users with convenient voice-controlled access to information and services. Furthermore, advancements in natural language processing (NLP) and machine learning (ML) are enhancing the capabilities of IVAs, leading to more natural and effective human-computer interactions. The rise of sophisticated text-to-speech and speech-to-text technologies are also instrumental in improving user experience and broadening the appeal of IVAs across diverse demographics. While data privacy concerns and the need for robust security measures represent potential restraints, the overall market trajectory remains overwhelmingly positive.
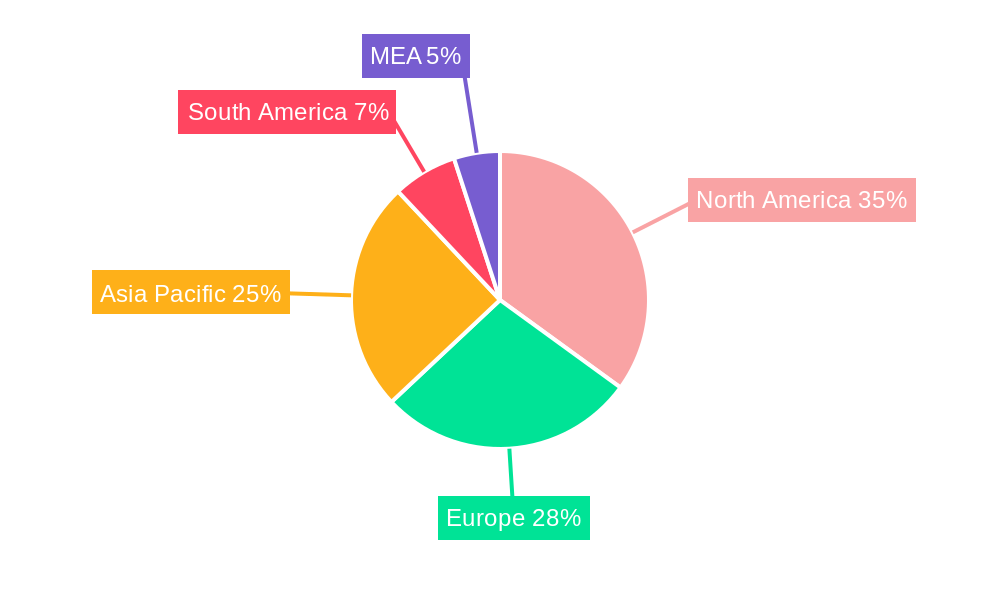
The regional distribution of the IVA market reflects the global digital transformation. North America currently holds a significant market share, driven by early adoption and technological advancements. However, the Asia-Pacific region is expected to witness the fastest growth due to rapid digitalization and increasing smartphone penetration, particularly in countries like China and India. Europe follows closely, with strong growth projected across multiple countries. The competitive landscape is dynamic, with major players like Amazon, Google, Apple, and IBM competing alongside specialized IVA providers such as Creative Virtual, Kore.ai, and others. The continuous innovation in AI technologies, coupled with expanding applications across diverse sectors, points towards a sustained period of high growth for the IVA market throughout the forecast period (2025-2033). This growth is likely to be fueled by further refinements in NLP and ML algorithms, resulting in more contextually aware and personalized IVA experiences.
Intelligent Virtual Assistant Market Report: 2019-2033
This comprehensive report provides a detailed analysis of the Intelligent Virtual Assistant (IVA) market, offering invaluable insights for industry professionals, investors, and strategists. The study covers the period 2019-2033, with a focus on the forecast period 2025-2033, and a base year of 2025. We delve into market dynamics, segmentation, key players, and future opportunities, providing actionable data to navigate this rapidly evolving landscape. The market is expected to reach xx Million by 2033.
Intelligent Virtual Assistant Market Market Structure & Innovation Trends
The Intelligent Virtual Assistant market is characterized by a dynamic interplay of established tech giants and emerging innovative companies. Market concentration is moderate, with several key players holding significant market share, but a substantial number of smaller players contributing to overall growth. The market is witnessing continuous innovation, driven by advancements in Artificial Intelligence (AI), Natural Language Processing (NLP), and Machine Learning (ML). Regulatory frameworks concerning data privacy and security are significantly influencing market development. Product substitutes, such as traditional customer service channels, face increasing competition due to IVAs' efficiency and cost-effectiveness. The end-user demographic is expanding rapidly, encompassing individuals and businesses across various sectors. M&A activity has been significant, with deal values reaching xx Million in recent years, as larger companies seek to consolidate their market position and acquire innovative technologies.
- Market Share: Amazon, Google, and IBM currently hold a dominant market share, estimated at xx%, xx%, and xx% respectively in 2025.
- M&A Activity: Significant M&A activity has been observed in the last five years, with deals primarily focused on acquiring smaller companies with specialized AI technologies. Average deal value (2019-2024) was approximately xx Million.
Intelligent Virtual Assistant Market Market Dynamics & Trends
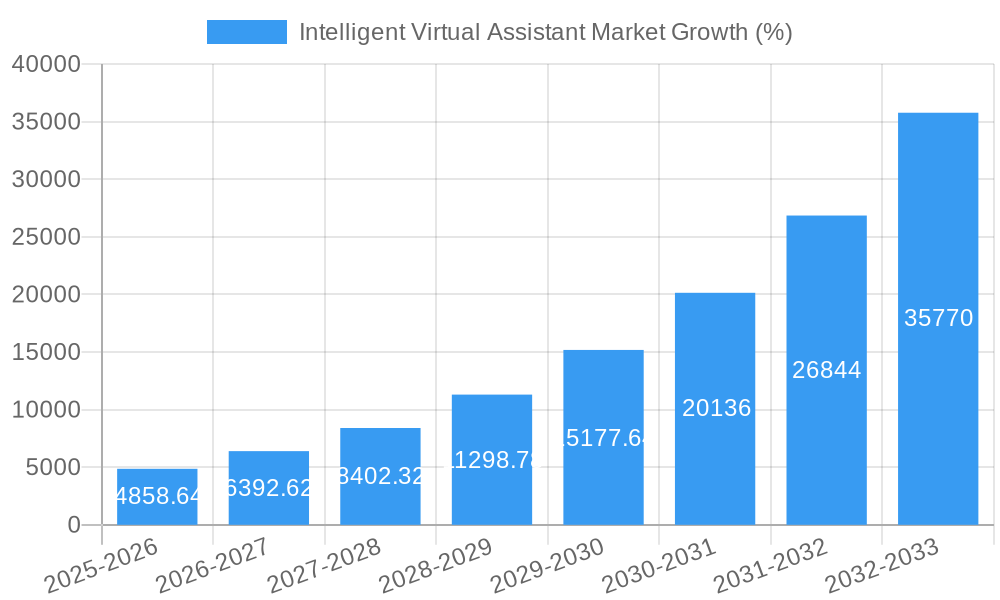
The Intelligent Virtual Assistant market is experiencing robust growth, driven by several key factors. The increasing adoption of smartphones and smart devices fuels demand for convenient and personalized user experiences. Technological disruptions, including advancements in AI, NLP, and ML, are continually enhancing the capabilities and functionalities of IVAs. Consumer preferences are shifting towards seamless, omnichannel interactions, further boosting the market's expansion. Competitive dynamics are intense, with companies investing heavily in R&D to develop innovative features and improve user experiences. The market is projected to exhibit a Compound Annual Growth Rate (CAGR) of xx% during the forecast period (2025-2033), with market penetration expected to reach xx% by 2033.
Dominant Regions & Segments in Intelligent Virtual Assistant Market
North America currently dominates the Intelligent Virtual Assistant market, driven by high technological adoption, robust infrastructure, and significant investments in AI and related technologies. Within North America, the United States is the leading country. However, Asia Pacific is expected to witness significant growth over the forecast period.
- By End-User: The Chatbots segment is currently dominant, driven by its widespread adoption across various industries. However, the Smart Speakers segment demonstrates significant growth potential.
- By Product: Chatbots hold the largest market share due to their versatility and widespread applicability. However, Smart Speakers are expected to experience substantial growth.
- By User Interface: Text-to-Text remains the most prevalent interface. However, the Text-to-Speech and Automatic Speech Recognition segments are rapidly gaining traction due to advancements in speech recognition technology.
Key Drivers:
- North America: Strong technological infrastructure, high consumer disposable income, early adoption of AI technologies.
- Asia Pacific: Rapid urbanization, growing smartphone penetration, increasing internet accessibility.
Intelligent Virtual Assistant Market Product Innovations
Recent product innovations focus on enhancing natural language understanding, improving personalization, and expanding functionalities. We are seeing IVAs integrated with more platforms and devices, and the use of AI to enable proactive assistance and predictive capabilities. These innovations are improving the market fit of IVAs by addressing specific industry needs and enhancing user experience. The focus is on creating more human-like interactions and integrating IVAs seamlessly into existing workflows.
Report Scope & Segmentation Analysis
This report segments the Intelligent Virtual Assistant market by End-User (Chatbots, Smart Speakers), Product (Chatbots, Smart Speakers), and User Interface (Text-to-Text, Text-to-Speech, Automatic Speech Recognition). Each segment is analyzed in detail, including growth projections, market sizes, and competitive landscapes. Market sizes are provided for each segment for the historical period (2019-2024) and the forecast period (2025-2033). Competitive dynamics within each segment are analyzed to identify key players and their strategies.
Key Drivers of Intelligent Virtual Assistant Market Growth
Technological advancements in AI, NLP, and ML are the primary drivers of market growth, enabling more sophisticated and human-like interactions. Increasing consumer demand for personalized and convenient services also fuels expansion. Favorable regulatory environments in some regions are promoting the adoption of IVAs, while economic factors such as increased investment in technology are also contributing to growth.
Challenges in the Intelligent Virtual Assistant Market Sector
Data privacy and security concerns remain significant challenges. Supply chain disruptions can impact the availability of components required for IVA development and deployment. Intense competition among established players and new entrants poses a challenge to maintaining market share. The high cost of development and implementation of sophisticated IVA systems may also limit wider adoption in some segments.
Emerging Opportunities in Intelligent Virtual Assistant Market
Integration of IVAs with Internet of Things (IoT) devices presents a significant opportunity. Expansion into new markets, such as healthcare and education, also offer substantial potential. The development of more personalized and context-aware IVAs will further drive market growth, as will advances in multi-lingual support and improved accessibility features.
Leading Players in the Intelligent Virtual Assistant Market Market
- Baidu Inc
- Creative Virtual Ltd
- EdgeVerve Systems Limited (An Infosys Company)
- Inbenta Technologies Inc
- Bose Corporation
- Kore ai Inc
- Harman-Kardon Inc
- IBM Corporation
- SMOOCH ai
- Google LLC (Alphabet Inc)
- Ipsoft Inc
- Sonos Inc
- Xiaomi Inc
- Avaamo Inc
- Amazon com Inc
- Serviceaide Inc
- Alibaba Group
- Apple Inc
Key Developments in Intelligent Virtual Assistant Market Industry
- February 2022: IBM and TD Securities collaborated on an AI-powered virtual assistant (IBM Watson Assistant) for TD Precious Metals, enhancing customer service.
- May 2022: Sonos announced development of its own voice assistant, "Sonos Voice," for music management on its platform.
Future Outlook for Intelligent Virtual Assistant Market Market
The Intelligent Virtual Assistant market is poised for continued robust growth, driven by technological innovation and increasing consumer adoption. The focus on personalization, seamless integration across platforms, and the expansion into new applications will unlock significant market potential. Strategic partnerships and investments in R&D will further fuel this growth, shaping the future of customer interaction and business operations.
Intelligent Virtual Assistant Market Segmentation
-
1. Product
- 1.1. Chatbots
- 1.2. Smart Speakers
-
2. User Interface
- 2.1. Text-to-Text
- 2.2. Text-to-Speech
- 2.3. Automatic Speech Recognition
-
3. End-User
-
3.1. Chatbots
- 3.1.1. Retail
- 3.1.2. BFSI
- 3.1.3. Healthcare
- 3.1.4. Telecom
- 3.1.5. Travel and Hospitality
- 3.1.6. Other End-User Industries
-
3.2. Smart Speakers
- 3.2.1. Personal
- 3.2.2. Commercial
-
3.1. Chatbots
Intelligent Virtual Assistant Market Segmentation By Geography
-
1. North America
- 1.1. United States
- 1.2. Canada
-
2. Europe
- 2.1. Germany
- 2.2. United Kingdom
- 2.3. France
- 2.4. Spain
- 2.5. Rest of Europe
-
3. Asia Pacific
- 3.1. China
- 3.2. Japan
- 3.3. India
- 3.4. Rest of Asia Pacific
-
4. Latin America
- 4.1. Brazil
- 4.2. Argentina
- 4.3. Rest of Latin America
-
5. Middle East and Africa
- 5.1. UAE
- 5.2. Saudi Arabia
- 5.3. South Africa
- 5.4. Rest of Middle East and Africa
Intelligent Virtual Assistant Market REPORT HIGHLIGHTS
| Aspects | Details |
|---|---|
| Study Period | 2019-2033 |
| Base Year | 2024 |
| Estimated Year | 2025 |
| Forecast Period | 2025-2033 |
| Historical Period | 2019-2024 |
| Growth Rate | CAGR of 32.72% from 2019-2033 |
| Segmentation |
|
Table of Contents
- 1. Introduction
- 1.1. Research Scope
- 1.2. Market Segmentation
- 1.3. Research Methodology
- 1.4. Definitions and Assumptions
- 2. Executive Summary
- 2.1. Introduction
- 3. Market Dynamics
- 3.1. Introduction
- 3.2. Market Drivers
- 3.2.1. Increasing Focus to Improve Customer Experience across Professional Services; Smart Speakers to Drive the Market Growth
- 3.3. Market Restrains
- 3.3.1. Increasing Preference for Live Person Interaction
- 3.4. Market Trends
- 3.4.1. Smart Speakers to Drive the Market Growth
- 4. Market Factor Analysis
- 4.1. Porters Five Forces
- 4.2. Supply/Value Chain
- 4.3. PESTEL analysis
- 4.4. Market Entropy
- 4.5. Patent/Trademark Analysis
- 5. Global Intelligent Virtual Assistant Market Analysis, Insights and Forecast, 2019-2031
- 5.1. Market Analysis, Insights and Forecast - by Product
- 5.1.1. Chatbots
- 5.1.2. Smart Speakers
- 5.2. Market Analysis, Insights and Forecast - by User Interface
- 5.2.1. Text-to-Text
- 5.2.2. Text-to-Speech
- 5.2.3. Automatic Speech Recognition
- 5.3. Market Analysis, Insights and Forecast - by End-User
- 5.3.1. Chatbots
- 5.3.1.1. Retail
- 5.3.1.2. BFSI
- 5.3.1.3. Healthcare
- 5.3.1.4. Telecom
- 5.3.1.5. Travel and Hospitality
- 5.3.1.6. Other End-User Industries
- 5.3.2. Smart Speakers
- 5.3.2.1. Personal
- 5.3.2.2. Commercial
- 5.3.1. Chatbots
- 5.4. Market Analysis, Insights and Forecast - by Region
- 5.4.1. North America
- 5.4.2. Europe
- 5.4.3. Asia Pacific
- 5.4.4. Latin America
- 5.4.5. Middle East and Africa
- 5.1. Market Analysis, Insights and Forecast - by Product
- 6. North America Intelligent Virtual Assistant Market Analysis, Insights and Forecast, 2019-2031
- 6.1. Market Analysis, Insights and Forecast - by Product
- 6.1.1. Chatbots
- 6.1.2. Smart Speakers
- 6.2. Market Analysis, Insights and Forecast - by User Interface
- 6.2.1. Text-to-Text
- 6.2.2. Text-to-Speech
- 6.2.3. Automatic Speech Recognition
- 6.3. Market Analysis, Insights and Forecast - by End-User
- 6.3.1. Chatbots
- 6.3.1.1. Retail
- 6.3.1.2. BFSI
- 6.3.1.3. Healthcare
- 6.3.1.4. Telecom
- 6.3.1.5. Travel and Hospitality
- 6.3.1.6. Other End-User Industries
- 6.3.2. Smart Speakers
- 6.3.2.1. Personal
- 6.3.2.2. Commercial
- 6.3.1. Chatbots
- 6.1. Market Analysis, Insights and Forecast - by Product
- 7. Europe Intelligent Virtual Assistant Market Analysis, Insights and Forecast, 2019-2031
- 7.1. Market Analysis, Insights and Forecast - by Product
- 7.1.1. Chatbots
- 7.1.2. Smart Speakers
- 7.2. Market Analysis, Insights and Forecast - by User Interface
- 7.2.1. Text-to-Text
- 7.2.2. Text-to-Speech
- 7.2.3. Automatic Speech Recognition
- 7.3. Market Analysis, Insights and Forecast - by End-User
- 7.3.1. Chatbots
- 7.3.1.1. Retail
- 7.3.1.2. BFSI
- 7.3.1.3. Healthcare
- 7.3.1.4. Telecom
- 7.3.1.5. Travel and Hospitality
- 7.3.1.6. Other End-User Industries
- 7.3.2. Smart Speakers
- 7.3.2.1. Personal
- 7.3.2.2. Commercial
- 7.3.1. Chatbots
- 7.1. Market Analysis, Insights and Forecast - by Product
- 8. Asia Pacific Intelligent Virtual Assistant Market Analysis, Insights and Forecast, 2019-2031
- 8.1. Market Analysis, Insights and Forecast - by Product
- 8.1.1. Chatbots
- 8.1.2. Smart Speakers
- 8.2. Market Analysis, Insights and Forecast - by User Interface
- 8.2.1. Text-to-Text
- 8.2.2. Text-to-Speech
- 8.2.3. Automatic Speech Recognition
- 8.3. Market Analysis, Insights and Forecast - by End-User
- 8.3.1. Chatbots
- 8.3.1.1. Retail
- 8.3.1.2. BFSI
- 8.3.1.3. Healthcare
- 8.3.1.4. Telecom
- 8.3.1.5. Travel and Hospitality
- 8.3.1.6. Other End-User Industries
- 8.3.2. Smart Speakers
- 8.3.2.1. Personal
- 8.3.2.2. Commercial
- 8.3.1. Chatbots
- 8.1. Market Analysis, Insights and Forecast - by Product
- 9. Latin America Intelligent Virtual Assistant Market Analysis, Insights and Forecast, 2019-2031
- 9.1. Market Analysis, Insights and Forecast - by Product
- 9.1.1. Chatbots
- 9.1.2. Smart Speakers
- 9.2. Market Analysis, Insights and Forecast - by User Interface
- 9.2.1. Text-to-Text
- 9.2.2. Text-to-Speech
- 9.2.3. Automatic Speech Recognition
- 9.3. Market Analysis, Insights and Forecast - by End-User
- 9.3.1. Chatbots
- 9.3.1.1. Retail
- 9.3.1.2. BFSI
- 9.3.1.3. Healthcare
- 9.3.1.4. Telecom
- 9.3.1.5. Travel and Hospitality
- 9.3.1.6. Other End-User Industries
- 9.3.2. Smart Speakers
- 9.3.2.1. Personal
- 9.3.2.2. Commercial
- 9.3.1. Chatbots
- 9.1. Market Analysis, Insights and Forecast - by Product
- 10. Middle East and Africa Intelligent Virtual Assistant Market Analysis, Insights and Forecast, 2019-2031
- 10.1. Market Analysis, Insights and Forecast - by Product
- 10.1.1. Chatbots
- 10.1.2. Smart Speakers
- 10.2. Market Analysis, Insights and Forecast - by User Interface
- 10.2.1. Text-to-Text
- 10.2.2. Text-to-Speech
- 10.2.3. Automatic Speech Recognition
- 10.3. Market Analysis, Insights and Forecast - by End-User
- 10.3.1. Chatbots
- 10.3.1.1. Retail
- 10.3.1.2. BFSI
- 10.3.1.3. Healthcare
- 10.3.1.4. Telecom
- 10.3.1.5. Travel and Hospitality
- 10.3.1.6. Other End-User Industries
- 10.3.2. Smart Speakers
- 10.3.2.1. Personal
- 10.3.2.2. Commercial
- 10.3.1. Chatbots
- 10.1. Market Analysis, Insights and Forecast - by Product
- 11. North America Intelligent Virtual Assistant Market Analysis, Insights and Forecast, 2019-2031
- 11.1. Market Analysis, Insights and Forecast - By Country/Sub-region
- 11.1.1 United States
- 11.1.2 Canada
- 11.1.3 Mexico
- 12. Europe Intelligent Virtual Assistant Market Analysis, Insights and Forecast, 2019-2031
- 12.1. Market Analysis, Insights and Forecast - By Country/Sub-region
- 12.1.1 Germany
- 12.1.2 United Kingdom
- 12.1.3 France
- 12.1.4 Spain
- 12.1.5 Italy
- 12.1.6 Spain
- 12.1.7 Belgium
- 12.1.8 Netherland
- 12.1.9 Nordics
- 12.1.10 Rest of Europe
- 13. Asia Pacific Intelligent Virtual Assistant Market Analysis, Insights and Forecast, 2019-2031
- 13.1. Market Analysis, Insights and Forecast - By Country/Sub-region
- 13.1.1 China
- 13.1.2 Japan
- 13.1.3 India
- 13.1.4 South Korea
- 13.1.5 Southeast Asia
- 13.1.6 Australia
- 13.1.7 Indonesia
- 13.1.8 Phillipes
- 13.1.9 Singapore
- 13.1.10 Thailandc
- 13.1.11 Rest of Asia Pacific
- 14. South America Intelligent Virtual Assistant Market Analysis, Insights and Forecast, 2019-2031
- 14.1. Market Analysis, Insights and Forecast - By Country/Sub-region
- 14.1.1 Brazil
- 14.1.2 Argentina
- 14.1.3 Peru
- 14.1.4 Chile
- 14.1.5 Colombia
- 14.1.6 Ecuador
- 14.1.7 Venezuela
- 14.1.8 Rest of South America
- 15. North America Intelligent Virtual Assistant Market Analysis, Insights and Forecast, 2019-2031
- 15.1. Market Analysis, Insights and Forecast - By Country/Sub-region
- 15.1.1 United States
- 15.1.2 Canada
- 15.1.3 Mexico
- 16. MEA Intelligent Virtual Assistant Market Analysis, Insights and Forecast, 2019-2031
- 16.1. Market Analysis, Insights and Forecast - By Country/Sub-region
- 16.1.1 United Arab Emirates
- 16.1.2 Saudi Arabia
- 16.1.3 South Africa
- 16.1.4 Rest of Middle East and Africa
- 17. Competitive Analysis
- 17.1. Global Market Share Analysis 2024
- 17.2. Company Profiles
- 17.2.1 Baidu Inc
- 17.2.1.1. Overview
- 17.2.1.2. Products
- 17.2.1.3. SWOT Analysis
- 17.2.1.4. Recent Developments
- 17.2.1.5. Financials (Based on Availability)
- 17.2.2 Creative Virtual Ltd
- 17.2.2.1. Overview
- 17.2.2.2. Products
- 17.2.2.3. SWOT Analysis
- 17.2.2.4. Recent Developments
- 17.2.2.5. Financials (Based on Availability)
- 17.2.3 EdgeVerve Systems Limited (An Infosys Company)
- 17.2.3.1. Overview
- 17.2.3.2. Products
- 17.2.3.3. SWOT Analysis
- 17.2.3.4. Recent Developments
- 17.2.3.5. Financials (Based on Availability)
- 17.2.4 Inbenta Technologies Inc
- 17.2.4.1. Overview
- 17.2.4.2. Products
- 17.2.4.3. SWOT Analysis
- 17.2.4.4. Recent Developments
- 17.2.4.5. Financials (Based on Availability)
- 17.2.5 Bose Corporation
- 17.2.5.1. Overview
- 17.2.5.2. Products
- 17.2.5.3. SWOT Analysis
- 17.2.5.4. Recent Developments
- 17.2.5.5. Financials (Based on Availability)
- 17.2.6 Kore ai Inc
- 17.2.6.1. Overview
- 17.2.6.2. Products
- 17.2.6.3. SWOT Analysis
- 17.2.6.4. Recent Developments
- 17.2.6.5. Financials (Based on Availability)
- 17.2.7 Harman-Kardon Inc
- 17.2.7.1. Overview
- 17.2.7.2. Products
- 17.2.7.3. SWOT Analysis
- 17.2.7.4. Recent Developments
- 17.2.7.5. Financials (Based on Availability)
- 17.2.8 IBM Corporation
- 17.2.8.1. Overview
- 17.2.8.2. Products
- 17.2.8.3. SWOT Analysis
- 17.2.8.4. Recent Developments
- 17.2.8.5. Financials (Based on Availability)
- 17.2.9 SMOOCH ai
- 17.2.9.1. Overview
- 17.2.9.2. Products
- 17.2.9.3. SWOT Analysis
- 17.2.9.4. Recent Developments
- 17.2.9.5. Financials (Based on Availability)
- 17.2.10 Google LLC (Alphabet Inc )
- 17.2.10.1. Overview
- 17.2.10.2. Products
- 17.2.10.3. SWOT Analysis
- 17.2.10.4. Recent Developments
- 17.2.10.5. Financials (Based on Availability)
- 17.2.11 Ipsoft Inc
- 17.2.11.1. Overview
- 17.2.11.2. Products
- 17.2.11.3. SWOT Analysis
- 17.2.11.4. Recent Developments
- 17.2.11.5. Financials (Based on Availability)
- 17.2.12 Sonos Inc
- 17.2.12.1. Overview
- 17.2.12.2. Products
- 17.2.12.3. SWOT Analysis
- 17.2.12.4. Recent Developments
- 17.2.12.5. Financials (Based on Availability)
- 17.2.13 Xiaomi Inc
- 17.2.13.1. Overview
- 17.2.13.2. Products
- 17.2.13.3. SWOT Analysis
- 17.2.13.4. Recent Developments
- 17.2.13.5. Financials (Based on Availability)
- 17.2.14 Avaamo Inc
- 17.2.14.1. Overview
- 17.2.14.2. Products
- 17.2.14.3. SWOT Analysis
- 17.2.14.4. Recent Developments
- 17.2.14.5. Financials (Based on Availability)
- 17.2.15 Amazon com Inc
- 17.2.15.1. Overview
- 17.2.15.2. Products
- 17.2.15.3. SWOT Analysis
- 17.2.15.4. Recent Developments
- 17.2.15.5. Financials (Based on Availability)
- 17.2.16 Serviceaide Inc
- 17.2.16.1. Overview
- 17.2.16.2. Products
- 17.2.16.3. SWOT Analysis
- 17.2.16.4. Recent Developments
- 17.2.16.5. Financials (Based on Availability)
- 17.2.17 Alibaba Group
- 17.2.17.1. Overview
- 17.2.17.2. Products
- 17.2.17.3. SWOT Analysis
- 17.2.17.4. Recent Developments
- 17.2.17.5. Financials (Based on Availability)
- 17.2.18 Apple Inc
- 17.2.18.1. Overview
- 17.2.18.2. Products
- 17.2.18.3. SWOT Analysis
- 17.2.18.4. Recent Developments
- 17.2.18.5. Financials (Based on Availability)
- 17.2.1 Baidu Inc
List of Figures
- Figure 1: Global Intelligent Virtual Assistant Market Revenue Breakdown (Million, %) by Region 2024 & 2032
- Figure 2: Global Intelligent Virtual Assistant Market Volume Breakdown (K Unit, %) by Region 2024 & 2032
- Figure 3: North America Intelligent Virtual Assistant Market Revenue (Million), by Country 2024 & 2032
- Figure 4: North America Intelligent Virtual Assistant Market Volume (K Unit), by Country 2024 & 2032
- Figure 5: North America Intelligent Virtual Assistant Market Revenue Share (%), by Country 2024 & 2032
- Figure 6: North America Intelligent Virtual Assistant Market Volume Share (%), by Country 2024 & 2032
- Figure 7: Europe Intelligent Virtual Assistant Market Revenue (Million), by Country 2024 & 2032
- Figure 8: Europe Intelligent Virtual Assistant Market Volume (K Unit), by Country 2024 & 2032
- Figure 9: Europe Intelligent Virtual Assistant Market Revenue Share (%), by Country 2024 & 2032
- Figure 10: Europe Intelligent Virtual Assistant Market Volume Share (%), by Country 2024 & 2032
- Figure 11: Asia Pacific Intelligent Virtual Assistant Market Revenue (Million), by Country 2024 & 2032
- Figure 12: Asia Pacific Intelligent Virtual Assistant Market Volume (K Unit), by Country 2024 & 2032
- Figure 13: Asia Pacific Intelligent Virtual Assistant Market Revenue Share (%), by Country 2024 & 2032
- Figure 14: Asia Pacific Intelligent Virtual Assistant Market Volume Share (%), by Country 2024 & 2032
- Figure 15: South America Intelligent Virtual Assistant Market Revenue (Million), by Country 2024 & 2032
- Figure 16: South America Intelligent Virtual Assistant Market Volume (K Unit), by Country 2024 & 2032
- Figure 17: South America Intelligent Virtual Assistant Market Revenue Share (%), by Country 2024 & 2032
- Figure 18: South America Intelligent Virtual Assistant Market Volume Share (%), by Country 2024 & 2032
- Figure 19: North America Intelligent Virtual Assistant Market Revenue (Million), by Country 2024 & 2032
- Figure 20: North America Intelligent Virtual Assistant Market Volume (K Unit), by Country 2024 & 2032
- Figure 21: North America Intelligent Virtual Assistant Market Revenue Share (%), by Country 2024 & 2032
- Figure 22: North America Intelligent Virtual Assistant Market Volume Share (%), by Country 2024 & 2032
- Figure 23: MEA Intelligent Virtual Assistant Market Revenue (Million), by Country 2024 & 2032
- Figure 24: MEA Intelligent Virtual Assistant Market Volume (K Unit), by Country 2024 & 2032
- Figure 25: MEA Intelligent Virtual Assistant Market Revenue Share (%), by Country 2024 & 2032
- Figure 26: MEA Intelligent Virtual Assistant Market Volume Share (%), by Country 2024 & 2032
- Figure 27: North America Intelligent Virtual Assistant Market Revenue (Million), by Product 2024 & 2032
- Figure 28: North America Intelligent Virtual Assistant Market Volume (K Unit), by Product 2024 & 2032
- Figure 29: North America Intelligent Virtual Assistant Market Revenue Share (%), by Product 2024 & 2032
- Figure 30: North America Intelligent Virtual Assistant Market Volume Share (%), by Product 2024 & 2032
- Figure 31: North America Intelligent Virtual Assistant Market Revenue (Million), by User Interface 2024 & 2032
- Figure 32: North America Intelligent Virtual Assistant Market Volume (K Unit), by User Interface 2024 & 2032
- Figure 33: North America Intelligent Virtual Assistant Market Revenue Share (%), by User Interface 2024 & 2032
- Figure 34: North America Intelligent Virtual Assistant Market Volume Share (%), by User Interface 2024 & 2032
- Figure 35: North America Intelligent Virtual Assistant Market Revenue (Million), by End-User 2024 & 2032
- Figure 36: North America Intelligent Virtual Assistant Market Volume (K Unit), by End-User 2024 & 2032
- Figure 37: North America Intelligent Virtual Assistant Market Revenue Share (%), by End-User 2024 & 2032
- Figure 38: North America Intelligent Virtual Assistant Market Volume Share (%), by End-User 2024 & 2032
- Figure 39: North America Intelligent Virtual Assistant Market Revenue (Million), by Country 2024 & 2032
- Figure 40: North America Intelligent Virtual Assistant Market Volume (K Unit), by Country 2024 & 2032
- Figure 41: North America Intelligent Virtual Assistant Market Revenue Share (%), by Country 2024 & 2032
- Figure 42: North America Intelligent Virtual Assistant Market Volume Share (%), by Country 2024 & 2032
- Figure 43: Europe Intelligent Virtual Assistant Market Revenue (Million), by Product 2024 & 2032
- Figure 44: Europe Intelligent Virtual Assistant Market Volume (K Unit), by Product 2024 & 2032
- Figure 45: Europe Intelligent Virtual Assistant Market Revenue Share (%), by Product 2024 & 2032
- Figure 46: Europe Intelligent Virtual Assistant Market Volume Share (%), by Product 2024 & 2032
- Figure 47: Europe Intelligent Virtual Assistant Market Revenue (Million), by User Interface 2024 & 2032
- Figure 48: Europe Intelligent Virtual Assistant Market Volume (K Unit), by User Interface 2024 & 2032
- Figure 49: Europe Intelligent Virtual Assistant Market Revenue Share (%), by User Interface 2024 & 2032
- Figure 50: Europe Intelligent Virtual Assistant Market Volume Share (%), by User Interface 2024 & 2032
- Figure 51: Europe Intelligent Virtual Assistant Market Revenue (Million), by End-User 2024 & 2032
- Figure 52: Europe Intelligent Virtual Assistant Market Volume (K Unit), by End-User 2024 & 2032
- Figure 53: Europe Intelligent Virtual Assistant Market Revenue Share (%), by End-User 2024 & 2032
- Figure 54: Europe Intelligent Virtual Assistant Market Volume Share (%), by End-User 2024 & 2032
- Figure 55: Europe Intelligent Virtual Assistant Market Revenue (Million), by Country 2024 & 2032
- Figure 56: Europe Intelligent Virtual Assistant Market Volume (K Unit), by Country 2024 & 2032
- Figure 57: Europe Intelligent Virtual Assistant Market Revenue Share (%), by Country 2024 & 2032
- Figure 58: Europe Intelligent Virtual Assistant Market Volume Share (%), by Country 2024 & 2032
- Figure 59: Asia Pacific Intelligent Virtual Assistant Market Revenue (Million), by Product 2024 & 2032
- Figure 60: Asia Pacific Intelligent Virtual Assistant Market Volume (K Unit), by Product 2024 & 2032
- Figure 61: Asia Pacific Intelligent Virtual Assistant Market Revenue Share (%), by Product 2024 & 2032
- Figure 62: Asia Pacific Intelligent Virtual Assistant Market Volume Share (%), by Product 2024 & 2032
- Figure 63: Asia Pacific Intelligent Virtual Assistant Market Revenue (Million), by User Interface 2024 & 2032
- Figure 64: Asia Pacific Intelligent Virtual Assistant Market Volume (K Unit), by User Interface 2024 & 2032
- Figure 65: Asia Pacific Intelligent Virtual Assistant Market Revenue Share (%), by User Interface 2024 & 2032
- Figure 66: Asia Pacific Intelligent Virtual Assistant Market Volume Share (%), by User Interface 2024 & 2032
- Figure 67: Asia Pacific Intelligent Virtual Assistant Market Revenue (Million), by End-User 2024 & 2032
- Figure 68: Asia Pacific Intelligent Virtual Assistant Market Volume (K Unit), by End-User 2024 & 2032
- Figure 69: Asia Pacific Intelligent Virtual Assistant Market Revenue Share (%), by End-User 2024 & 2032
- Figure 70: Asia Pacific Intelligent Virtual Assistant Market Volume Share (%), by End-User 2024 & 2032
- Figure 71: Asia Pacific Intelligent Virtual Assistant Market Revenue (Million), by Country 2024 & 2032
- Figure 72: Asia Pacific Intelligent Virtual Assistant Market Volume (K Unit), by Country 2024 & 2032
- Figure 73: Asia Pacific Intelligent Virtual Assistant Market Revenue Share (%), by Country 2024 & 2032
- Figure 74: Asia Pacific Intelligent Virtual Assistant Market Volume Share (%), by Country 2024 & 2032
- Figure 75: Latin America Intelligent Virtual Assistant Market Revenue (Million), by Product 2024 & 2032
- Figure 76: Latin America Intelligent Virtual Assistant Market Volume (K Unit), by Product 2024 & 2032
- Figure 77: Latin America Intelligent Virtual Assistant Market Revenue Share (%), by Product 2024 & 2032
- Figure 78: Latin America Intelligent Virtual Assistant Market Volume Share (%), by Product 2024 & 2032
- Figure 79: Latin America Intelligent Virtual Assistant Market Revenue (Million), by User Interface 2024 & 2032
- Figure 80: Latin America Intelligent Virtual Assistant Market Volume (K Unit), by User Interface 2024 & 2032
- Figure 81: Latin America Intelligent Virtual Assistant Market Revenue Share (%), by User Interface 2024 & 2032
- Figure 82: Latin America Intelligent Virtual Assistant Market Volume Share (%), by User Interface 2024 & 2032
- Figure 83: Latin America Intelligent Virtual Assistant Market Revenue (Million), by End-User 2024 & 2032
- Figure 84: Latin America Intelligent Virtual Assistant Market Volume (K Unit), by End-User 2024 & 2032
- Figure 85: Latin America Intelligent Virtual Assistant Market Revenue Share (%), by End-User 2024 & 2032
- Figure 86: Latin America Intelligent Virtual Assistant Market Volume Share (%), by End-User 2024 & 2032
- Figure 87: Latin America Intelligent Virtual Assistant Market Revenue (Million), by Country 2024 & 2032
- Figure 88: Latin America Intelligent Virtual Assistant Market Volume (K Unit), by Country 2024 & 2032
- Figure 89: Latin America Intelligent Virtual Assistant Market Revenue Share (%), by Country 2024 & 2032
- Figure 90: Latin America Intelligent Virtual Assistant Market Volume Share (%), by Country 2024 & 2032
- Figure 91: Middle East and Africa Intelligent Virtual Assistant Market Revenue (Million), by Product 2024 & 2032
- Figure 92: Middle East and Africa Intelligent Virtual Assistant Market Volume (K Unit), by Product 2024 & 2032
- Figure 93: Middle East and Africa Intelligent Virtual Assistant Market Revenue Share (%), by Product 2024 & 2032
- Figure 94: Middle East and Africa Intelligent Virtual Assistant Market Volume Share (%), by Product 2024 & 2032
- Figure 95: Middle East and Africa Intelligent Virtual Assistant Market Revenue (Million), by User Interface 2024 & 2032
- Figure 96: Middle East and Africa Intelligent Virtual Assistant Market Volume (K Unit), by User Interface 2024 & 2032
- Figure 97: Middle East and Africa Intelligent Virtual Assistant Market Revenue Share (%), by User Interface 2024 & 2032
- Figure 98: Middle East and Africa Intelligent Virtual Assistant Market Volume Share (%), by User Interface 2024 & 2032
- Figure 99: Middle East and Africa Intelligent Virtual Assistant Market Revenue (Million), by End-User 2024 & 2032
- Figure 100: Middle East and Africa Intelligent Virtual Assistant Market Volume (K Unit), by End-User 2024 & 2032
- Figure 101: Middle East and Africa Intelligent Virtual Assistant Market Revenue Share (%), by End-User 2024 & 2032
- Figure 102: Middle East and Africa Intelligent Virtual Assistant Market Volume Share (%), by End-User 2024 & 2032
- Figure 103: Middle East and Africa Intelligent Virtual Assistant Market Revenue (Million), by Country 2024 & 2032
- Figure 104: Middle East and Africa Intelligent Virtual Assistant Market Volume (K Unit), by Country 2024 & 2032
- Figure 105: Middle East and Africa Intelligent Virtual Assistant Market Revenue Share (%), by Country 2024 & 2032
- Figure 106: Middle East and Africa Intelligent Virtual Assistant Market Volume Share (%), by Country 2024 & 2032
List of Tables
- Table 1: Global Intelligent Virtual Assistant Market Revenue Million Forecast, by Region 2019 & 2032
- Table 2: Global Intelligent Virtual Assistant Market Volume K Unit Forecast, by Region 2019 & 2032
- Table 3: Global Intelligent Virtual Assistant Market Revenue Million Forecast, by Product 2019 & 2032
- Table 4: Global Intelligent Virtual Assistant Market Volume K Unit Forecast, by Product 2019 & 2032
- Table 5: Global Intelligent Virtual Assistant Market Revenue Million Forecast, by User Interface 2019 & 2032
- Table 6: Global Intelligent Virtual Assistant Market Volume K Unit Forecast, by User Interface 2019 & 2032
- Table 7: Global Intelligent Virtual Assistant Market Revenue Million Forecast, by End-User 2019 & 2032
- Table 8: Global Intelligent Virtual Assistant Market Volume K Unit Forecast, by End-User 2019 & 2032
- Table 9: Global Intelligent Virtual Assistant Market Revenue Million Forecast, by Region 2019 & 2032
- Table 10: Global Intelligent Virtual Assistant Market Volume K Unit Forecast, by Region 2019 & 2032
- Table 11: Global Intelligent Virtual Assistant Market Revenue Million Forecast, by Country 2019 & 2032
- Table 12: Global Intelligent Virtual Assistant Market Volume K Unit Forecast, by Country 2019 & 2032
- Table 13: United States Intelligent Virtual Assistant Market Revenue (Million) Forecast, by Application 2019 & 2032
- Table 14: United States Intelligent Virtual Assistant Market Volume (K Unit) Forecast, by Application 2019 & 2032
- Table 15: Canada Intelligent Virtual Assistant Market Revenue (Million) Forecast, by Application 2019 & 2032
- Table 16: Canada Intelligent Virtual Assistant Market Volume (K Unit) Forecast, by Application 2019 & 2032
- Table 17: Mexico Intelligent Virtual Assistant Market Revenue (Million) Forecast, by Application 2019 & 2032
- Table 18: Mexico Intelligent Virtual Assistant Market Volume (K Unit) Forecast, by Application 2019 & 2032
- Table 19: Global Intelligent Virtual Assistant Market Revenue Million Forecast, by Country 2019 & 2032
- Table 20: Global Intelligent Virtual Assistant Market Volume K Unit Forecast, by Country 2019 & 2032
- Table 21: Germany Intelligent Virtual Assistant Market Revenue (Million) Forecast, by Application 2019 & 2032
- Table 22: Germany Intelligent Virtual Assistant Market Volume (K Unit) Forecast, by Application 2019 & 2032
- Table 23: United Kingdom Intelligent Virtual Assistant Market Revenue (Million) Forecast, by Application 2019 & 2032
- Table 24: United Kingdom Intelligent Virtual Assistant Market Volume (K Unit) Forecast, by Application 2019 & 2032
- Table 25: France Intelligent Virtual Assistant Market Revenue (Million) Forecast, by Application 2019 & 2032
- Table 26: France Intelligent Virtual Assistant Market Volume (K Unit) Forecast, by Application 2019 & 2032
- Table 27: Spain Intelligent Virtual Assistant Market Revenue (Million) Forecast, by Application 2019 & 2032
- Table 28: Spain Intelligent Virtual Assistant Market Volume (K Unit) Forecast, by Application 2019 & 2032
- Table 29: Italy Intelligent Virtual Assistant Market Revenue (Million) Forecast, by Application 2019 & 2032
- Table 30: Italy Intelligent Virtual Assistant Market Volume (K Unit) Forecast, by Application 2019 & 2032
- Table 31: Spain Intelligent Virtual Assistant Market Revenue (Million) Forecast, by Application 2019 & 2032
- Table 32: Spain Intelligent Virtual Assistant Market Volume (K Unit) Forecast, by Application 2019 & 2032
- Table 33: Belgium Intelligent Virtual Assistant Market Revenue (Million) Forecast, by Application 2019 & 2032
- Table 34: Belgium Intelligent Virtual Assistant Market Volume (K Unit) Forecast, by Application 2019 & 2032
- Table 35: Netherland Intelligent Virtual Assistant Market Revenue (Million) Forecast, by Application 2019 & 2032
- Table 36: Netherland Intelligent Virtual Assistant Market Volume (K Unit) Forecast, by Application 2019 & 2032
- Table 37: Nordics Intelligent Virtual Assistant Market Revenue (Million) Forecast, by Application 2019 & 2032
- Table 38: Nordics Intelligent Virtual Assistant Market Volume (K Unit) Forecast, by Application 2019 & 2032
- Table 39: Rest of Europe Intelligent Virtual Assistant Market Revenue (Million) Forecast, by Application 2019 & 2032
- Table 40: Rest of Europe Intelligent Virtual Assistant Market Volume (K Unit) Forecast, by Application 2019 & 2032
- Table 41: Global Intelligent Virtual Assistant Market Revenue Million Forecast, by Country 2019 & 2032
- Table 42: Global Intelligent Virtual Assistant Market Volume K Unit Forecast, by Country 2019 & 2032
- Table 43: China Intelligent Virtual Assistant Market Revenue (Million) Forecast, by Application 2019 & 2032
- Table 44: China Intelligent Virtual Assistant Market Volume (K Unit) Forecast, by Application 2019 & 2032
- Table 45: Japan Intelligent Virtual Assistant Market Revenue (Million) Forecast, by Application 2019 & 2032
- Table 46: Japan Intelligent Virtual Assistant Market Volume (K Unit) Forecast, by Application 2019 & 2032
- Table 47: India Intelligent Virtual Assistant Market Revenue (Million) Forecast, by Application 2019 & 2032
- Table 48: India Intelligent Virtual Assistant Market Volume (K Unit) Forecast, by Application 2019 & 2032
- Table 49: South Korea Intelligent Virtual Assistant Market Revenue (Million) Forecast, by Application 2019 & 2032
- Table 50: South Korea Intelligent Virtual Assistant Market Volume (K Unit) Forecast, by Application 2019 & 2032
- Table 51: Southeast Asia Intelligent Virtual Assistant Market Revenue (Million) Forecast, by Application 2019 & 2032
- Table 52: Southeast Asia Intelligent Virtual Assistant Market Volume (K Unit) Forecast, by Application 2019 & 2032
- Table 53: Australia Intelligent Virtual Assistant Market Revenue (Million) Forecast, by Application 2019 & 2032
- Table 54: Australia Intelligent Virtual Assistant Market Volume (K Unit) Forecast, by Application 2019 & 2032
- Table 55: Indonesia Intelligent Virtual Assistant Market Revenue (Million) Forecast, by Application 2019 & 2032
- Table 56: Indonesia Intelligent Virtual Assistant Market Volume (K Unit) Forecast, by Application 2019 & 2032
- Table 57: Phillipes Intelligent Virtual Assistant Market Revenue (Million) Forecast, by Application 2019 & 2032
- Table 58: Phillipes Intelligent Virtual Assistant Market Volume (K Unit) Forecast, by Application 2019 & 2032
- Table 59: Singapore Intelligent Virtual Assistant Market Revenue (Million) Forecast, by Application 2019 & 2032
- Table 60: Singapore Intelligent Virtual Assistant Market Volume (K Unit) Forecast, by Application 2019 & 2032
- Table 61: Thailandc Intelligent Virtual Assistant Market Revenue (Million) Forecast, by Application 2019 & 2032
- Table 62: Thailandc Intelligent Virtual Assistant Market Volume (K Unit) Forecast, by Application 2019 & 2032
- Table 63: Rest of Asia Pacific Intelligent Virtual Assistant Market Revenue (Million) Forecast, by Application 2019 & 2032
- Table 64: Rest of Asia Pacific Intelligent Virtual Assistant Market Volume (K Unit) Forecast, by Application 2019 & 2032
- Table 65: Global Intelligent Virtual Assistant Market Revenue Million Forecast, by Country 2019 & 2032
- Table 66: Global Intelligent Virtual Assistant Market Volume K Unit Forecast, by Country 2019 & 2032
- Table 67: Brazil Intelligent Virtual Assistant Market Revenue (Million) Forecast, by Application 2019 & 2032
- Table 68: Brazil Intelligent Virtual Assistant Market Volume (K Unit) Forecast, by Application 2019 & 2032
- Table 69: Argentina Intelligent Virtual Assistant Market Revenue (Million) Forecast, by Application 2019 & 2032
- Table 70: Argentina Intelligent Virtual Assistant Market Volume (K Unit) Forecast, by Application 2019 & 2032
- Table 71: Peru Intelligent Virtual Assistant Market Revenue (Million) Forecast, by Application 2019 & 2032
- Table 72: Peru Intelligent Virtual Assistant Market Volume (K Unit) Forecast, by Application 2019 & 2032
- Table 73: Chile Intelligent Virtual Assistant Market Revenue (Million) Forecast, by Application 2019 & 2032
- Table 74: Chile Intelligent Virtual Assistant Market Volume (K Unit) Forecast, by Application 2019 & 2032
- Table 75: Colombia Intelligent Virtual Assistant Market Revenue (Million) Forecast, by Application 2019 & 2032
- Table 76: Colombia Intelligent Virtual Assistant Market Volume (K Unit) Forecast, by Application 2019 & 2032
- Table 77: Ecuador Intelligent Virtual Assistant Market Revenue (Million) Forecast, by Application 2019 & 2032
- Table 78: Ecuador Intelligent Virtual Assistant Market Volume (K Unit) Forecast, by Application 2019 & 2032
- Table 79: Venezuela Intelligent Virtual Assistant Market Revenue (Million) Forecast, by Application 2019 & 2032
- Table 80: Venezuela Intelligent Virtual Assistant Market Volume (K Unit) Forecast, by Application 2019 & 2032
- Table 81: Rest of South America Intelligent Virtual Assistant Market Revenue (Million) Forecast, by Application 2019 & 2032
- Table 82: Rest of South America Intelligent Virtual Assistant Market Volume (K Unit) Forecast, by Application 2019 & 2032
- Table 83: Global Intelligent Virtual Assistant Market Revenue Million Forecast, by Country 2019 & 2032
- Table 84: Global Intelligent Virtual Assistant Market Volume K Unit Forecast, by Country 2019 & 2032
- Table 85: United States Intelligent Virtual Assistant Market Revenue (Million) Forecast, by Application 2019 & 2032
- Table 86: United States Intelligent Virtual Assistant Market Volume (K Unit) Forecast, by Application 2019 & 2032
- Table 87: Canada Intelligent Virtual Assistant Market Revenue (Million) Forecast, by Application 2019 & 2032
- Table 88: Canada Intelligent Virtual Assistant Market Volume (K Unit) Forecast, by Application 2019 & 2032
- Table 89: Mexico Intelligent Virtual Assistant Market Revenue (Million) Forecast, by Application 2019 & 2032
- Table 90: Mexico Intelligent Virtual Assistant Market Volume (K Unit) Forecast, by Application 2019 & 2032
- Table 91: Global Intelligent Virtual Assistant Market Revenue Million Forecast, by Country 2019 & 2032
- Table 92: Global Intelligent Virtual Assistant Market Volume K Unit Forecast, by Country 2019 & 2032
- Table 93: United Arab Emirates Intelligent Virtual Assistant Market Revenue (Million) Forecast, by Application 2019 & 2032
- Table 94: United Arab Emirates Intelligent Virtual Assistant Market Volume (K Unit) Forecast, by Application 2019 & 2032
- Table 95: Saudi Arabia Intelligent Virtual Assistant Market Revenue (Million) Forecast, by Application 2019 & 2032
- Table 96: Saudi Arabia Intelligent Virtual Assistant Market Volume (K Unit) Forecast, by Application 2019 & 2032
- Table 97: South Africa Intelligent Virtual Assistant Market Revenue (Million) Forecast, by Application 2019 & 2032
- Table 98: South Africa Intelligent Virtual Assistant Market Volume (K Unit) Forecast, by Application 2019 & 2032
- Table 99: Rest of Middle East and Africa Intelligent Virtual Assistant Market Revenue (Million) Forecast, by Application 2019 & 2032
- Table 100: Rest of Middle East and Africa Intelligent Virtual Assistant Market Volume (K Unit) Forecast, by Application 2019 & 2032
- Table 101: Global Intelligent Virtual Assistant Market Revenue Million Forecast, by Product 2019 & 2032
- Table 102: Global Intelligent Virtual Assistant Market Volume K Unit Forecast, by Product 2019 & 2032
- Table 103: Global Intelligent Virtual Assistant Market Revenue Million Forecast, by User Interface 2019 & 2032
- Table 104: Global Intelligent Virtual Assistant Market Volume K Unit Forecast, by User Interface 2019 & 2032
- Table 105: Global Intelligent Virtual Assistant Market Revenue Million Forecast, by End-User 2019 & 2032
- Table 106: Global Intelligent Virtual Assistant Market Volume K Unit Forecast, by End-User 2019 & 2032
- Table 107: Global Intelligent Virtual Assistant Market Revenue Million Forecast, by Country 2019 & 2032
- Table 108: Global Intelligent Virtual Assistant Market Volume K Unit Forecast, by Country 2019 & 2032
- Table 109: United States Intelligent Virtual Assistant Market Revenue (Million) Forecast, by Application 2019 & 2032
- Table 110: United States Intelligent Virtual Assistant Market Volume (K Unit) Forecast, by Application 2019 & 2032
- Table 111: Canada Intelligent Virtual Assistant Market Revenue (Million) Forecast, by Application 2019 & 2032
- Table 112: Canada Intelligent Virtual Assistant Market Volume (K Unit) Forecast, by Application 2019 & 2032
- Table 113: Global Intelligent Virtual Assistant Market Revenue Million Forecast, by Product 2019 & 2032
- Table 114: Global Intelligent Virtual Assistant Market Volume K Unit Forecast, by Product 2019 & 2032
- Table 115: Global Intelligent Virtual Assistant Market Revenue Million Forecast, by User Interface 2019 & 2032
- Table 116: Global Intelligent Virtual Assistant Market Volume K Unit Forecast, by User Interface 2019 & 2032
- Table 117: Global Intelligent Virtual Assistant Market Revenue Million Forecast, by End-User 2019 & 2032
- Table 118: Global Intelligent Virtual Assistant Market Volume K Unit Forecast, by End-User 2019 & 2032
- Table 119: Global Intelligent Virtual Assistant Market Revenue Million Forecast, by Country 2019 & 2032
- Table 120: Global Intelligent Virtual Assistant Market Volume K Unit Forecast, by Country 2019 & 2032
- Table 121: Germany Intelligent Virtual Assistant Market Revenue (Million) Forecast, by Application 2019 & 2032
- Table 122: Germany Intelligent Virtual Assistant Market Volume (K Unit) Forecast, by Application 2019 & 2032
- Table 123: United Kingdom Intelligent Virtual Assistant Market Revenue (Million) Forecast, by Application 2019 & 2032
- Table 124: United Kingdom Intelligent Virtual Assistant Market Volume (K Unit) Forecast, by Application 2019 & 2032
- Table 125: France Intelligent Virtual Assistant Market Revenue (Million) Forecast, by Application 2019 & 2032
- Table 126: France Intelligent Virtual Assistant Market Volume (K Unit) Forecast, by Application 2019 & 2032
- Table 127: Spain Intelligent Virtual Assistant Market Revenue (Million) Forecast, by Application 2019 & 2032
- Table 128: Spain Intelligent Virtual Assistant Market Volume (K Unit) Forecast, by Application 2019 & 2032
- Table 129: Rest of Europe Intelligent Virtual Assistant Market Revenue (Million) Forecast, by Application 2019 & 2032
- Table 130: Rest of Europe Intelligent Virtual Assistant Market Volume (K Unit) Forecast, by Application 2019 & 2032
- Table 131: Global Intelligent Virtual Assistant Market Revenue Million Forecast, by Product 2019 & 2032
- Table 132: Global Intelligent Virtual Assistant Market Volume K Unit Forecast, by Product 2019 & 2032
- Table 133: Global Intelligent Virtual Assistant Market Revenue Million Forecast, by User Interface 2019 & 2032
- Table 134: Global Intelligent Virtual Assistant Market Volume K Unit Forecast, by User Interface 2019 & 2032
- Table 135: Global Intelligent Virtual Assistant Market Revenue Million Forecast, by End-User 2019 & 2032
- Table 136: Global Intelligent Virtual Assistant Market Volume K Unit Forecast, by End-User 2019 & 2032
- Table 137: Global Intelligent Virtual Assistant Market Revenue Million Forecast, by Country 2019 & 2032
- Table 138: Global Intelligent Virtual Assistant Market Volume K Unit Forecast, by Country 2019 & 2032
- Table 139: China Intelligent Virtual Assistant Market Revenue (Million) Forecast, by Application 2019 & 2032
- Table 140: China Intelligent Virtual Assistant Market Volume (K Unit) Forecast, by Application 2019 & 2032
- Table 141: Japan Intelligent Virtual Assistant Market Revenue (Million) Forecast, by Application 2019 & 2032
- Table 142: Japan Intelligent Virtual Assistant Market Volume (K Unit) Forecast, by Application 2019 & 2032
- Table 143: India Intelligent Virtual Assistant Market Revenue (Million) Forecast, by Application 2019 & 2032
- Table 144: India Intelligent Virtual Assistant Market Volume (K Unit) Forecast, by Application 2019 & 2032
- Table 145: Rest of Asia Pacific Intelligent Virtual Assistant Market Revenue (Million) Forecast, by Application 2019 & 2032
- Table 146: Rest of Asia Pacific Intelligent Virtual Assistant Market Volume (K Unit) Forecast, by Application 2019 & 2032
- Table 147: Global Intelligent Virtual Assistant Market Revenue Million Forecast, by Product 2019 & 2032
- Table 148: Global Intelligent Virtual Assistant Market Volume K Unit Forecast, by Product 2019 & 2032
- Table 149: Global Intelligent Virtual Assistant Market Revenue Million Forecast, by User Interface 2019 & 2032
- Table 150: Global Intelligent Virtual Assistant Market Volume K Unit Forecast, by User Interface 2019 & 2032
- Table 151: Global Intelligent Virtual Assistant Market Revenue Million Forecast, by End-User 2019 & 2032
- Table 152: Global Intelligent Virtual Assistant Market Volume K Unit Forecast, by End-User 2019 & 2032
- Table 153: Global Intelligent Virtual Assistant Market Revenue Million Forecast, by Country 2019 & 2032
- Table 154: Global Intelligent Virtual Assistant Market Volume K Unit Forecast, by Country 2019 & 2032
- Table 155: Brazil Intelligent Virtual Assistant Market Revenue (Million) Forecast, by Application 2019 & 2032
- Table 156: Brazil Intelligent Virtual Assistant Market Volume (K Unit) Forecast, by Application 2019 & 2032
- Table 157: Argentina Intelligent Virtual Assistant Market Revenue (Million) Forecast, by Application 2019 & 2032
- Table 158: Argentina Intelligent Virtual Assistant Market Volume (K Unit) Forecast, by Application 2019 & 2032
- Table 159: Rest of Latin America Intelligent Virtual Assistant Market Revenue (Million) Forecast, by Application 2019 & 2032
- Table 160: Rest of Latin America Intelligent Virtual Assistant Market Volume (K Unit) Forecast, by Application 2019 & 2032
- Table 161: Global Intelligent Virtual Assistant Market Revenue Million Forecast, by Product 2019 & 2032
- Table 162: Global Intelligent Virtual Assistant Market Volume K Unit Forecast, by Product 2019 & 2032
- Table 163: Global Intelligent Virtual Assistant Market Revenue Million Forecast, by User Interface 2019 & 2032
- Table 164: Global Intelligent Virtual Assistant Market Volume K Unit Forecast, by User Interface 2019 & 2032
- Table 165: Global Intelligent Virtual Assistant Market Revenue Million Forecast, by End-User 2019 & 2032
- Table 166: Global Intelligent Virtual Assistant Market Volume K Unit Forecast, by End-User 2019 & 2032
- Table 167: Global Intelligent Virtual Assistant Market Revenue Million Forecast, by Country 2019 & 2032
- Table 168: Global Intelligent Virtual Assistant Market Volume K Unit Forecast, by Country 2019 & 2032
- Table 169: UAE Intelligent Virtual Assistant Market Revenue (Million) Forecast, by Application 2019 & 2032
- Table 170: UAE Intelligent Virtual Assistant Market Volume (K Unit) Forecast, by Application 2019 & 2032
- Table 171: Saudi Arabia Intelligent Virtual Assistant Market Revenue (Million) Forecast, by Application 2019 & 2032
- Table 172: Saudi Arabia Intelligent Virtual Assistant Market Volume (K Unit) Forecast, by Application 2019 & 2032
- Table 173: South Africa Intelligent Virtual Assistant Market Revenue (Million) Forecast, by Application 2019 & 2032
- Table 174: South Africa Intelligent Virtual Assistant Market Volume (K Unit) Forecast, by Application 2019 & 2032
- Table 175: Rest of Middle East and Africa Intelligent Virtual Assistant Market Revenue (Million) Forecast, by Application 2019 & 2032
- Table 176: Rest of Middle East and Africa Intelligent Virtual Assistant Market Volume (K Unit) Forecast, by Application 2019 & 2032
Frequently Asked Questions
1. What is the projected Compound Annual Growth Rate (CAGR) of the Intelligent Virtual Assistant Market?
The projected CAGR is approximately 32.72%.
2. Which companies are prominent players in the Intelligent Virtual Assistant Market?
Key companies in the market include Baidu Inc, Creative Virtual Ltd, EdgeVerve Systems Limited (An Infosys Company), Inbenta Technologies Inc, Bose Corporation, Kore ai Inc, Harman-Kardon Inc, IBM Corporation, SMOOCH ai, Google LLC (Alphabet Inc ), Ipsoft Inc, Sonos Inc, Xiaomi Inc, Avaamo Inc, Amazon com Inc, Serviceaide Inc, Alibaba Group, Apple Inc.
3. What are the main segments of the Intelligent Virtual Assistant Market?
The market segments include Product, User Interface, End-User.
4. Can you provide details about the market size?
The market size is estimated to be USD 14.77 Million as of 2022.
5. What are some drivers contributing to market growth?
Increasing Focus to Improve Customer Experience across Professional Services; Smart Speakers to Drive the Market Growth.
6. What are the notable trends driving market growth?
Smart Speakers to Drive the Market Growth.
7. Are there any restraints impacting market growth?
Increasing Preference for Live Person Interaction.
8. Can you provide examples of recent developments in the market?
February 2022: IBM and TD Securities collaborated to create an AI-powered virtual assistant powered by IBM Watson Assistant that can assist consumers with inquiries on the TD Precious Metals digital shop, including frequently asked questions, to help simplify the purchasing experience.
9. What pricing options are available for accessing the report?
Pricing options include single-user, multi-user, and enterprise licenses priced at USD 4750, USD 5250, and USD 8750 respectively.
10. Is the market size provided in terms of value or volume?
The market size is provided in terms of value, measured in Million and volume, measured in K Unit.
11. Are there any specific market keywords associated with the report?
Yes, the market keyword associated with the report is "Intelligent Virtual Assistant Market," which aids in identifying and referencing the specific market segment covered.
12. How do I determine which pricing option suits my needs best?
The pricing options vary based on user requirements and access needs. Individual users may opt for single-user licenses, while businesses requiring broader access may choose multi-user or enterprise licenses for cost-effective access to the report.
13. Are there any additional resources or data provided in the Intelligent Virtual Assistant Market report?
While the report offers comprehensive insights, it's advisable to review the specific contents or supplementary materials provided to ascertain if additional resources or data are available.
14. How can I stay updated on further developments or reports in the Intelligent Virtual Assistant Market?
To stay informed about further developments, trends, and reports in the Intelligent Virtual Assistant Market, consider subscribing to industry newsletters, following relevant companies and organizations, or regularly checking reputable industry news sources and publications.
Methodology
Step 1 - Identification of Relevant Samples Size from Population Database


Step 2 - Approaches for Defining Global Market Size (Value, Volume* & Price*)

Note*: In applicable scenarios
Step 3 - Data Sources
Primary Research
- Web Analytics
- Survey Reports
- Research Institute
- Latest Research Reports
- Opinion Leaders
Secondary Research
- Annual Reports
- White Paper
- Latest Press Release
- Industry Association
- Paid Database
- Investor Presentations

Step 4 - Data Triangulation
Involves using different sources of information in order to increase the validity of a study
These sources are likely to be stakeholders in a program - participants, other researchers, program staff, other community members, and so on.
Then we put all data in single framework & apply various statistical tools to find out the dynamic on the market.
During the analysis stage, feedback from the stakeholder groups would be compared to determine areas of agreement as well as areas of divergence


