
Key Insights
The intelligent well completion market is experiencing robust growth, driven by increasing demand for enhanced oil and gas recovery techniques and the need for improved reservoir management. The market's compound annual growth rate (CAGR) exceeding 3.50% indicates a sustained upward trajectory, projected to continue through 2033. Key drivers include the rising adoption of sophisticated technologies like smart sensors, advanced analytics, and automation to optimize production, reduce operational costs, and extend the lifespan of oil and gas wells. The onshore segment currently dominates the market due to easier accessibility and established infrastructure; however, the offshore segment is poised for significant growth, driven by technological advancements enabling efficient operations in challenging environments. Hardware components, such as advanced downhole tools and sensors, represent a larger market share currently, but the software segment, encompassing data analytics and remote monitoring solutions, is experiencing faster growth fueled by the increasing availability of data and the need for real-time insights. Major players, including Schlumberger, Halliburton, and Baker Hughes, are actively investing in research and development to maintain their competitive edge. Geographic analysis reveals North America as a dominant market, followed by the Asia-Pacific region, fueled by increasing energy demands and exploration activities in countries like China and India. However, Europe and the Middle East and Africa regions also present significant growth opportunities. Restraints on market growth include high initial investment costs associated with intelligent well completion technologies and the complexities involved in their implementation.
The market segmentation, comprising onshore and offshore applications and hardware and software components, offers diverse investment opportunities. The forecast period of 2025-2033 presents significant potential for growth, particularly in the software and offshore segments. Companies are focusing on integrating advanced analytics, machine learning, and artificial intelligence into their intelligent well completion solutions, leading to more efficient reservoir management and optimized production. This integration of data-driven insights with advanced hardware is crucial in optimizing well performance and maximizing resource extraction. Furthermore, the ongoing focus on environmental sustainability and regulations is also influencing the adoption of more efficient and environmentally friendly technologies within the intelligent well completion market, further boosting its growth.
This comprehensive report provides an in-depth analysis of the Intelligent Well Completion industry, offering invaluable insights for industry professionals, investors, and strategists. The study covers the period from 2019 to 2033, with a base year of 2025 and a forecast period spanning 2025-2033. The report uses data from 2019-2024 as its historical period and projects market values in Millions.
Intelligent Well Completion Industry Market Structure & Innovation Trends
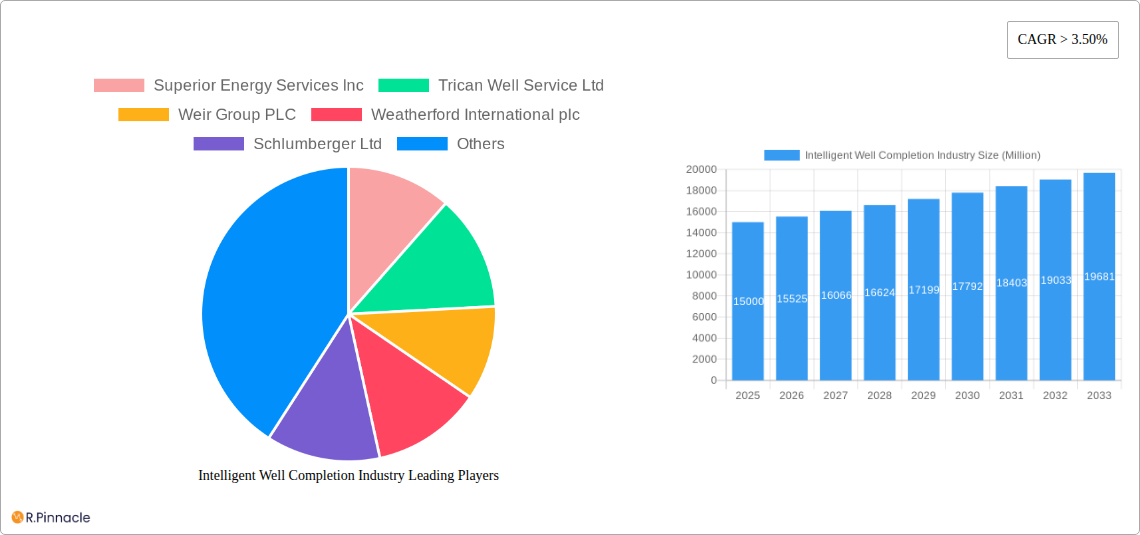
The Intelligent Well Completion market is characterized by a moderately concentrated structure with key players including Superior Energy Services Inc, Trican Well Service Ltd, Weir Group PLC, Weatherford International plc, Schlumberger Ltd, Packers Plus Energy Services Inc, Baker Hughes Company, Halliburton Company, National-Oilwell Varco Inc, Schoeller-Bleckmann Oilfield Equipment AG, and Welltec A/S. Market share among these companies fluctuates, with Schlumberger and Halliburton consistently holding significant positions. The total market size in 2025 is estimated at xx Million. Innovation is driven by the increasing demand for enhanced oil recovery, stricter environmental regulations, and the need for improved operational efficiency.
Mergers and acquisitions (M&A) play a crucial role in shaping the market landscape. Recent deals have focused on technology integration and expansion into new geographical markets. While precise M&A deal values for this specific sector are not readily available and require further dedicated research, the total value across the oil and gas services sector for the last five years is estimated at approximately xx Million.
- Market Concentration: Moderately concentrated, with a few dominant players.
- Innovation Drivers: Enhanced oil recovery, environmental regulations, operational efficiency.
- Regulatory Frameworks: Vary by region, impacting technology adoption and operational costs.
- Product Substitutes: Limited direct substitutes, competition primarily from conventional well completion methods.
- End-User Demographics: Primarily oil and gas exploration and production companies, with a growing contribution from independent operators.
- M&A Activity: Ongoing consolidation, driven by technology integration and market expansion.
Intelligent Well Completion Industry Market Dynamics & Trends
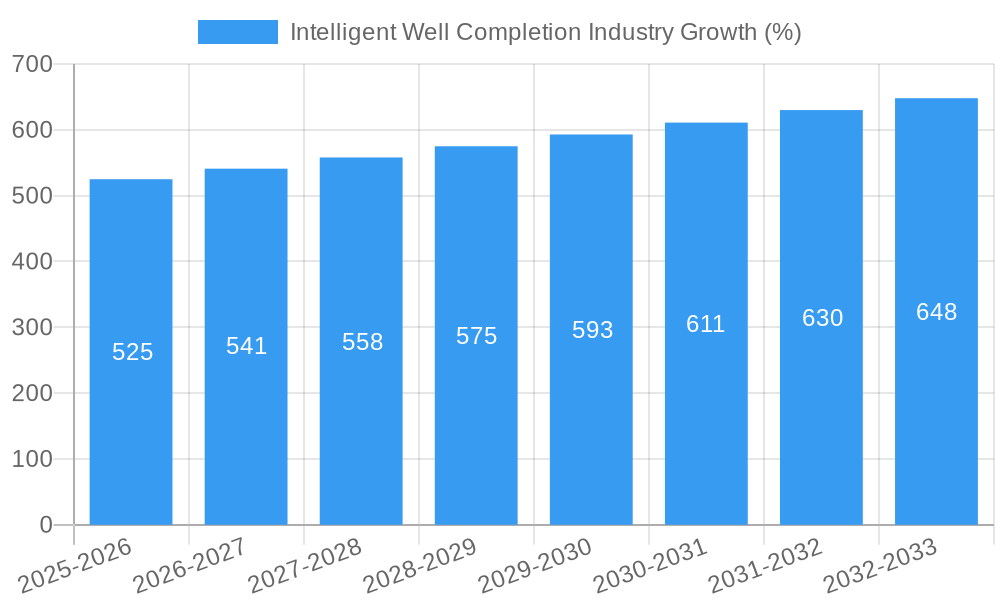
The Intelligent Well Completion market exhibits a robust growth trajectory, fueled by several key factors. Technological advancements, including the development of sophisticated sensors, data analytics, and automation technologies, are significantly improving well completion processes, leading to increased production efficiency and reduced operational costs. The rising demand for oil and gas globally is also a major driver of market growth. The global market is projected to witness a compound annual growth rate (CAGR) of xx% during the forecast period (2025-2033), reaching an estimated value of xx Million by 2033. Market penetration remains highest in established oil and gas producing regions, but is steadily increasing in emerging markets. Competitive dynamics are largely shaped by technological innovation, service quality, and global reach.
Dominant Regions & Segments in Intelligent Well Completion Industry
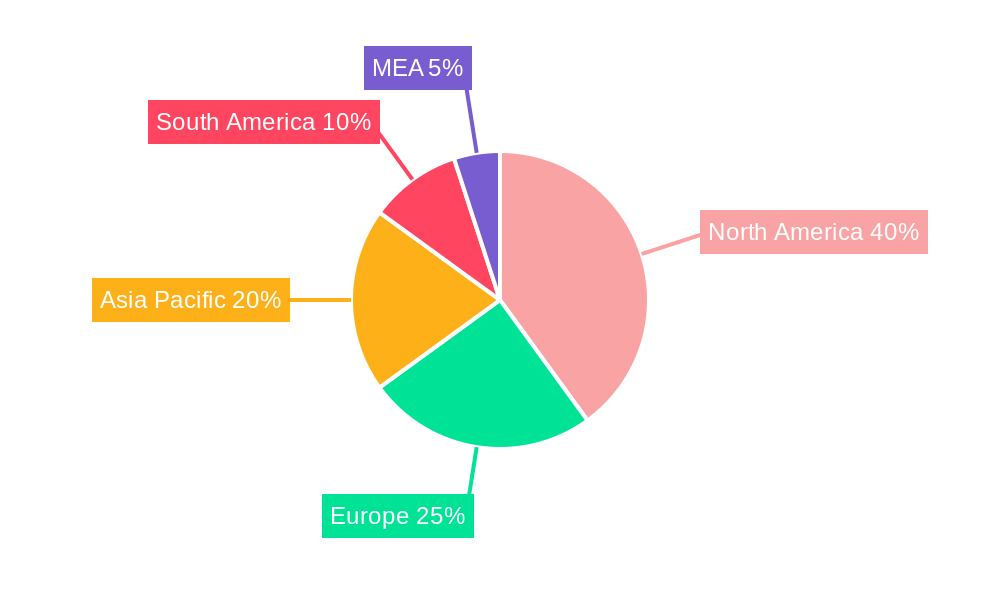
The onshore segment currently dominates the Intelligent Well Completion market, driven by the larger number of existing onshore wells and ongoing exploration activities. However, the offshore segment is projected to experience faster growth due to increasing investment in offshore oil and gas projects, particularly in deepwater areas. Within components, the hardware segment holds the largest market share, however software solutions are experiencing significant growth due to their potential for improved data analysis and efficiency gains. The North American region currently holds a leading position, driven by robust oil and gas production and a strong technological base.
- Key Drivers of Onshore Dominance: Established infrastructure, high concentration of oil and gas wells.
- Key Drivers of Hardware Dominance: Critical role in well completion processes, established technology base.
- Key Drivers of North American Leadership: Strong domestic oil and gas production, advanced technological capabilities.
- Growth Projections: Onshore segment expected to continue dominance, but offshore segment to show higher growth rates.
- Market Size: Specific figures for each region and segment require more dedicated research and are estimated at xx Million for the total onshore segment in 2025.
Intelligent Well Completion Industry Product Innovations
Recent product innovations have focused on enhancing reservoir contact, improving real-time data acquisition, and minimizing environmental impact. For example, Halliburton's StrataStar service offers advanced reservoir visualization capabilities, while Baker Hughes' new software focuses on enhancing efficiency and reducing emissions. These innovations reflect a broader trend toward data-driven decision-making and environmentally responsible operations. The market is also witnessing the rise of integrated solutions that combine hardware and software components for improved workflow and efficiency.
Report Scope & Segmentation Analysis
This report segments the Intelligent Well Completion market by Application (Onshore and Offshore) and Component (Hardware and Software). Each segment is analyzed based on historical data, current market size, and growth projections for the forecast period. Competitive dynamics are assessed within each segment to provide a comprehensive understanding of the market landscape. The report identifies key market trends and provides detailed insight into the current competitive landscape.
Application: The onshore segment is projected to grow steadily. The offshore segment is expected to demonstrate faster growth due to increasing offshore exploration and production activities.
Component: The hardware segment comprises a larger market share. However, the software segment is anticipated to exhibit rapid growth owing to the increasing adoption of data-driven technologies.
Key Drivers of Intelligent Well Completion Industry Growth
Several factors are driving the growth of the Intelligent Well Completion industry. Technological advancements such as advanced sensors, data analytics, and automation are improving well completion processes. The rising global demand for oil and gas, particularly in emerging markets, is also a significant driver. Furthermore, increasing government regulations related to emission reductions and enhanced oil recovery are creating a favorable environment for the adoption of intelligent well completion technologies.
Challenges in the Intelligent Well Completion Industry Sector
The Intelligent Well Completion industry faces several challenges. Supply chain disruptions can impact the availability and cost of critical components. Stringent regulatory requirements can increase compliance costs and complexity. Intense competition from established players and new entrants can put pressure on profitability. These factors can affect market growth and lead to price volatility for the services and equipment in the industry estimated at a loss of xx Million dollars annually.
Emerging Opportunities in Intelligent Well Completion Industry
Emerging opportunities include the expansion into unconventional resources, such as shale gas and tight oil, and growing adoption in emerging markets with developing oil and gas industries. Advances in artificial intelligence (AI) and machine learning (ML) are expected to further improve decision-making and optimize well completion processes. Moreover, the development of eco-friendly completion fluids and technologies is creating new avenues for growth.
Leading Players in the Intelligent Well Completion Industry Market
- Superior Energy Services Inc
- Trican Well Service Ltd
- Weir Group PLC
- Weatherford International plc
- Schlumberger Ltd
- Packers Plus Energy Services Inc
- Baker Hughes Company
- Halliburton Company
- National-Oilwell Varco Inc
- Schoeller-Bleckmann Oilfield Equipment AG
- Welltec A/S
Key Developments in Intelligent Well Completion Industry
- April 2022: Halliburton introduced StrataStar, a deep azimuthal resistivity service enhancing reservoir contact and real-time reserve evaluation. This significantly improved the capabilities of Halliburton's iStar intelligent drilling and logging platform, leading to increased market share.
- February 2023: Baker Hughes launched new software designed to improve efficiency and reduce emissions from well completion, positively impacting environmental concerns and operational costs. This enhanced its competitive standing within the market.
Future Outlook for Intelligent Well Completion Industry Market
The future of the Intelligent Well Completion industry appears bright. Continued technological innovation, rising global energy demand, and increased regulatory pressure will drive market growth. Strategic opportunities exist in expanding into emerging markets, developing integrated solutions, and leveraging AI and ML for improved efficiency and decision-making. The market is poised for continued expansion, with significant potential for growth and innovation over the next decade.
Intelligent Well Completion Industry Segmentation
- 1. Production Analysis
- 2. Consumption Analysis
- 3. Import Market Analysis (Value & Volume)
- 4. Export Market Analysis (Value & Volume)
- 5. Price Trend Analysis
Intelligent Well Completion Industry Segmentation By Geography
- 1. North America
- 2. Europe
- 3. Asia Pacific
- 4. South America
- 5. Middle East and Africa
Intelligent Well Completion Industry REPORT HIGHLIGHTS
| Aspects | Details |
|---|---|
| Study Period | 2019-2033 |
| Base Year | 2024 |
| Estimated Year | 2025 |
| Forecast Period | 2025-2033 |
| Historical Period | 2019-2024 |
| Growth Rate | CAGR of > 3.50% from 2019-2033 |
| Segmentation |
|
Table of Contents
- 1. Introduction
- 1.1. Research Scope
- 1.2. Market Segmentation
- 1.3. Research Methodology
- 1.4. Definitions and Assumptions
- 2. Executive Summary
- 2.1. Introduction
- 3. Market Dynamics
- 3.1. Introduction
- 3.2. Market Drivers
- 3.2.1. 4.; Global Inclination toward Renewable-based Power Generation4.; Increased Power Demand in Line with the Increasing Population
- 3.3. Market Restrains
- 3.3.1. 4.; High Initial Cost
- 3.4. Market Trends
- 3.4.1. Offshore to be the Fastest Growing Segment
- 4. Market Factor Analysis
- 4.1. Porters Five Forces
- 4.2. Supply/Value Chain
- 4.3. PESTEL analysis
- 4.4. Market Entropy
- 4.5. Patent/Trademark Analysis
- 5. Global Intelligent Well Completion Industry Analysis, Insights and Forecast, 2019-2031
- 5.1. Market Analysis, Insights and Forecast - by Production Analysis
- 5.2. Market Analysis, Insights and Forecast - by Consumption Analysis
- 5.3. Market Analysis, Insights and Forecast - by Import Market Analysis (Value & Volume)
- 5.4. Market Analysis, Insights and Forecast - by Export Market Analysis (Value & Volume)
- 5.5. Market Analysis, Insights and Forecast - by Price Trend Analysis
- 5.6. Market Analysis, Insights and Forecast - by Region
- 5.6.1. North America
- 5.6.2. Europe
- 5.6.3. Asia Pacific
- 5.6.4. South America
- 5.6.5. Middle East and Africa
- 5.1. Market Analysis, Insights and Forecast - by Production Analysis
- 6. North America Intelligent Well Completion Industry Analysis, Insights and Forecast, 2019-2031
- 6.1. Market Analysis, Insights and Forecast - by Production Analysis
- 6.2. Market Analysis, Insights and Forecast - by Consumption Analysis
- 6.3. Market Analysis, Insights and Forecast - by Import Market Analysis (Value & Volume)
- 6.4. Market Analysis, Insights and Forecast - by Export Market Analysis (Value & Volume)
- 6.5. Market Analysis, Insights and Forecast - by Price Trend Analysis
- 6.1. Market Analysis, Insights and Forecast - by Production Analysis
- 7. Europe Intelligent Well Completion Industry Analysis, Insights and Forecast, 2019-2031
- 7.1. Market Analysis, Insights and Forecast - by Production Analysis
- 7.2. Market Analysis, Insights and Forecast - by Consumption Analysis
- 7.3. Market Analysis, Insights and Forecast - by Import Market Analysis (Value & Volume)
- 7.4. Market Analysis, Insights and Forecast - by Export Market Analysis (Value & Volume)
- 7.5. Market Analysis, Insights and Forecast - by Price Trend Analysis
- 7.1. Market Analysis, Insights and Forecast - by Production Analysis
- 8. Asia Pacific Intelligent Well Completion Industry Analysis, Insights and Forecast, 2019-2031
- 8.1. Market Analysis, Insights and Forecast - by Production Analysis
- 8.2. Market Analysis, Insights and Forecast - by Consumption Analysis
- 8.3. Market Analysis, Insights and Forecast - by Import Market Analysis (Value & Volume)
- 8.4. Market Analysis, Insights and Forecast - by Export Market Analysis (Value & Volume)
- 8.5. Market Analysis, Insights and Forecast - by Price Trend Analysis
- 8.1. Market Analysis, Insights and Forecast - by Production Analysis
- 9. South America Intelligent Well Completion Industry Analysis, Insights and Forecast, 2019-2031
- 9.1. Market Analysis, Insights and Forecast - by Production Analysis
- 9.2. Market Analysis, Insights and Forecast - by Consumption Analysis
- 9.3. Market Analysis, Insights and Forecast - by Import Market Analysis (Value & Volume)
- 9.4. Market Analysis, Insights and Forecast - by Export Market Analysis (Value & Volume)
- 9.5. Market Analysis, Insights and Forecast - by Price Trend Analysis
- 9.1. Market Analysis, Insights and Forecast - by Production Analysis
- 10. Middle East and Africa Intelligent Well Completion Industry Analysis, Insights and Forecast, 2019-2031
- 10.1. Market Analysis, Insights and Forecast - by Production Analysis
- 10.2. Market Analysis, Insights and Forecast - by Consumption Analysis
- 10.3. Market Analysis, Insights and Forecast - by Import Market Analysis (Value & Volume)
- 10.4. Market Analysis, Insights and Forecast - by Export Market Analysis (Value & Volume)
- 10.5. Market Analysis, Insights and Forecast - by Price Trend Analysis
- 10.1. Market Analysis, Insights and Forecast - by Production Analysis
- 11. North America Intelligent Well Completion Industry Analysis, Insights and Forecast, 2019-2031
- 11.1. Market Analysis, Insights and Forecast - By Country/Sub-region
- 11.1.1 United States
- 11.1.2 Canada
- 11.1.3 Mexico
- 12. Europe Intelligent Well Completion Industry Analysis, Insights and Forecast, 2019-2031
- 12.1. Market Analysis, Insights and Forecast - By Country/Sub-region
- 12.1.1 Germany
- 12.1.2 United Kingdom
- 12.1.3 France
- 12.1.4 Spain
- 12.1.5 Italy
- 12.1.6 Spain
- 12.1.7 Belgium
- 12.1.8 Netherland
- 12.1.9 Nordics
- 12.1.10 Rest of Europe
- 13. Asia Pacific Intelligent Well Completion Industry Analysis, Insights and Forecast, 2019-2031
- 13.1. Market Analysis, Insights and Forecast - By Country/Sub-region
- 13.1.1 China
- 13.1.2 Japan
- 13.1.3 India
- 13.1.4 South Korea
- 13.1.5 Southeast Asia
- 13.1.6 Australia
- 13.1.7 Indonesia
- 13.1.8 Phillipes
- 13.1.9 Singapore
- 13.1.10 Thailandc
- 13.1.11 Rest of Asia Pacific
- 14. South America Intelligent Well Completion Industry Analysis, Insights and Forecast, 2019-2031
- 14.1. Market Analysis, Insights and Forecast - By Country/Sub-region
- 14.1.1 Brazil
- 14.1.2 Argentina
- 14.1.3 Peru
- 14.1.4 Chile
- 14.1.5 Colombia
- 14.1.6 Ecuador
- 14.1.7 Venezuela
- 14.1.8 Rest of South America
- 15. North America Intelligent Well Completion Industry Analysis, Insights and Forecast, 2019-2031
- 15.1. Market Analysis, Insights and Forecast - By Country/Sub-region
- 15.1.1 United States
- 15.1.2 Canada
- 15.1.3 Mexico
- 16. MEA Intelligent Well Completion Industry Analysis, Insights and Forecast, 2019-2031
- 16.1. Market Analysis, Insights and Forecast - By Country/Sub-region
- 16.1.1 United Arab Emirates
- 16.1.2 Saudi Arabia
- 16.1.3 South Africa
- 16.1.4 Rest of Middle East and Africa
- 17. Competitive Analysis
- 17.1. Global Market Share Analysis 2024
- 17.2. Company Profiles
- 17.2.1 Superior Energy Services Inc
- 17.2.1.1. Overview
- 17.2.1.2. Products
- 17.2.1.3. SWOT Analysis
- 17.2.1.4. Recent Developments
- 17.2.1.5. Financials (Based on Availability)
- 17.2.2 Trican Well Service Ltd
- 17.2.2.1. Overview
- 17.2.2.2. Products
- 17.2.2.3. SWOT Analysis
- 17.2.2.4. Recent Developments
- 17.2.2.5. Financials (Based on Availability)
- 17.2.3 Weir Group PLC
- 17.2.3.1. Overview
- 17.2.3.2. Products
- 17.2.3.3. SWOT Analysis
- 17.2.3.4. Recent Developments
- 17.2.3.5. Financials (Based on Availability)
- 17.2.4 Weatherford International plc
- 17.2.4.1. Overview
- 17.2.4.2. Products
- 17.2.4.3. SWOT Analysis
- 17.2.4.4. Recent Developments
- 17.2.4.5. Financials (Based on Availability)
- 17.2.5 Schlumberger Ltd
- 17.2.5.1. Overview
- 17.2.5.2. Products
- 17.2.5.3. SWOT Analysis
- 17.2.5.4. Recent Developments
- 17.2.5.5. Financials (Based on Availability)
- 17.2.6 Packers Plus Energy Services Inc
- 17.2.6.1. Overview
- 17.2.6.2. Products
- 17.2.6.3. SWOT Analysis
- 17.2.6.4. Recent Developments
- 17.2.6.5. Financials (Based on Availability)
- 17.2.7 Baker Hughes Company
- 17.2.7.1. Overview
- 17.2.7.2. Products
- 17.2.7.3. SWOT Analysis
- 17.2.7.4. Recent Developments
- 17.2.7.5. Financials (Based on Availability)
- 17.2.8 Halliburton Company
- 17.2.8.1. Overview
- 17.2.8.2. Products
- 17.2.8.3. SWOT Analysis
- 17.2.8.4. Recent Developments
- 17.2.8.5. Financials (Based on Availability)
- 17.2.9 National-Oilwell Varco Inc
- 17.2.9.1. Overview
- 17.2.9.2. Products
- 17.2.9.3. SWOT Analysis
- 17.2.9.4. Recent Developments
- 17.2.9.5. Financials (Based on Availability)
- 17.2.10 Schoeller-Bleckmann Oilfield Equipment AG
- 17.2.10.1. Overview
- 17.2.10.2. Products
- 17.2.10.3. SWOT Analysis
- 17.2.10.4. Recent Developments
- 17.2.10.5. Financials (Based on Availability)
- 17.2.11 Welltec A/S*List Not Exhaustive
- 17.2.11.1. Overview
- 17.2.11.2. Products
- 17.2.11.3. SWOT Analysis
- 17.2.11.4. Recent Developments
- 17.2.11.5. Financials (Based on Availability)
- 17.2.1 Superior Energy Services Inc
List of Figures
- Figure 1: Global Intelligent Well Completion Industry Revenue Breakdown (Million, %) by Region 2024 & 2032
- Figure 2: North America Intelligent Well Completion Industry Revenue (Million), by Country 2024 & 2032
- Figure 3: North America Intelligent Well Completion Industry Revenue Share (%), by Country 2024 & 2032
- Figure 4: Europe Intelligent Well Completion Industry Revenue (Million), by Country 2024 & 2032
- Figure 5: Europe Intelligent Well Completion Industry Revenue Share (%), by Country 2024 & 2032
- Figure 6: Asia Pacific Intelligent Well Completion Industry Revenue (Million), by Country 2024 & 2032
- Figure 7: Asia Pacific Intelligent Well Completion Industry Revenue Share (%), by Country 2024 & 2032
- Figure 8: South America Intelligent Well Completion Industry Revenue (Million), by Country 2024 & 2032
- Figure 9: South America Intelligent Well Completion Industry Revenue Share (%), by Country 2024 & 2032
- Figure 10: North America Intelligent Well Completion Industry Revenue (Million), by Country 2024 & 2032
- Figure 11: North America Intelligent Well Completion Industry Revenue Share (%), by Country 2024 & 2032
- Figure 12: MEA Intelligent Well Completion Industry Revenue (Million), by Country 2024 & 2032
- Figure 13: MEA Intelligent Well Completion Industry Revenue Share (%), by Country 2024 & 2032
- Figure 14: North America Intelligent Well Completion Industry Revenue (Million), by Production Analysis 2024 & 2032
- Figure 15: North America Intelligent Well Completion Industry Revenue Share (%), by Production Analysis 2024 & 2032
- Figure 16: North America Intelligent Well Completion Industry Revenue (Million), by Consumption Analysis 2024 & 2032
- Figure 17: North America Intelligent Well Completion Industry Revenue Share (%), by Consumption Analysis 2024 & 2032
- Figure 18: North America Intelligent Well Completion Industry Revenue (Million), by Import Market Analysis (Value & Volume) 2024 & 2032
- Figure 19: North America Intelligent Well Completion Industry Revenue Share (%), by Import Market Analysis (Value & Volume) 2024 & 2032
- Figure 20: North America Intelligent Well Completion Industry Revenue (Million), by Export Market Analysis (Value & Volume) 2024 & 2032
- Figure 21: North America Intelligent Well Completion Industry Revenue Share (%), by Export Market Analysis (Value & Volume) 2024 & 2032
- Figure 22: North America Intelligent Well Completion Industry Revenue (Million), by Price Trend Analysis 2024 & 2032
- Figure 23: North America Intelligent Well Completion Industry Revenue Share (%), by Price Trend Analysis 2024 & 2032
- Figure 24: North America Intelligent Well Completion Industry Revenue (Million), by Country 2024 & 2032
- Figure 25: North America Intelligent Well Completion Industry Revenue Share (%), by Country 2024 & 2032
- Figure 26: Europe Intelligent Well Completion Industry Revenue (Million), by Production Analysis 2024 & 2032
- Figure 27: Europe Intelligent Well Completion Industry Revenue Share (%), by Production Analysis 2024 & 2032
- Figure 28: Europe Intelligent Well Completion Industry Revenue (Million), by Consumption Analysis 2024 & 2032
- Figure 29: Europe Intelligent Well Completion Industry Revenue Share (%), by Consumption Analysis 2024 & 2032
- Figure 30: Europe Intelligent Well Completion Industry Revenue (Million), by Import Market Analysis (Value & Volume) 2024 & 2032
- Figure 31: Europe Intelligent Well Completion Industry Revenue Share (%), by Import Market Analysis (Value & Volume) 2024 & 2032
- Figure 32: Europe Intelligent Well Completion Industry Revenue (Million), by Export Market Analysis (Value & Volume) 2024 & 2032
- Figure 33: Europe Intelligent Well Completion Industry Revenue Share (%), by Export Market Analysis (Value & Volume) 2024 & 2032
- Figure 34: Europe Intelligent Well Completion Industry Revenue (Million), by Price Trend Analysis 2024 & 2032
- Figure 35: Europe Intelligent Well Completion Industry Revenue Share (%), by Price Trend Analysis 2024 & 2032
- Figure 36: Europe Intelligent Well Completion Industry Revenue (Million), by Country 2024 & 2032
- Figure 37: Europe Intelligent Well Completion Industry Revenue Share (%), by Country 2024 & 2032
- Figure 38: Asia Pacific Intelligent Well Completion Industry Revenue (Million), by Production Analysis 2024 & 2032
- Figure 39: Asia Pacific Intelligent Well Completion Industry Revenue Share (%), by Production Analysis 2024 & 2032
- Figure 40: Asia Pacific Intelligent Well Completion Industry Revenue (Million), by Consumption Analysis 2024 & 2032
- Figure 41: Asia Pacific Intelligent Well Completion Industry Revenue Share (%), by Consumption Analysis 2024 & 2032
- Figure 42: Asia Pacific Intelligent Well Completion Industry Revenue (Million), by Import Market Analysis (Value & Volume) 2024 & 2032
- Figure 43: Asia Pacific Intelligent Well Completion Industry Revenue Share (%), by Import Market Analysis (Value & Volume) 2024 & 2032
- Figure 44: Asia Pacific Intelligent Well Completion Industry Revenue (Million), by Export Market Analysis (Value & Volume) 2024 & 2032
- Figure 45: Asia Pacific Intelligent Well Completion Industry Revenue Share (%), by Export Market Analysis (Value & Volume) 2024 & 2032
- Figure 46: Asia Pacific Intelligent Well Completion Industry Revenue (Million), by Price Trend Analysis 2024 & 2032
- Figure 47: Asia Pacific Intelligent Well Completion Industry Revenue Share (%), by Price Trend Analysis 2024 & 2032
- Figure 48: Asia Pacific Intelligent Well Completion Industry Revenue (Million), by Country 2024 & 2032
- Figure 49: Asia Pacific Intelligent Well Completion Industry Revenue Share (%), by Country 2024 & 2032
- Figure 50: South America Intelligent Well Completion Industry Revenue (Million), by Production Analysis 2024 & 2032
- Figure 51: South America Intelligent Well Completion Industry Revenue Share (%), by Production Analysis 2024 & 2032
- Figure 52: South America Intelligent Well Completion Industry Revenue (Million), by Consumption Analysis 2024 & 2032
- Figure 53: South America Intelligent Well Completion Industry Revenue Share (%), by Consumption Analysis 2024 & 2032
- Figure 54: South America Intelligent Well Completion Industry Revenue (Million), by Import Market Analysis (Value & Volume) 2024 & 2032
- Figure 55: South America Intelligent Well Completion Industry Revenue Share (%), by Import Market Analysis (Value & Volume) 2024 & 2032
- Figure 56: South America Intelligent Well Completion Industry Revenue (Million), by Export Market Analysis (Value & Volume) 2024 & 2032
- Figure 57: South America Intelligent Well Completion Industry Revenue Share (%), by Export Market Analysis (Value & Volume) 2024 & 2032
- Figure 58: South America Intelligent Well Completion Industry Revenue (Million), by Price Trend Analysis 2024 & 2032
- Figure 59: South America Intelligent Well Completion Industry Revenue Share (%), by Price Trend Analysis 2024 & 2032
- Figure 60: South America Intelligent Well Completion Industry Revenue (Million), by Country 2024 & 2032
- Figure 61: South America Intelligent Well Completion Industry Revenue Share (%), by Country 2024 & 2032
- Figure 62: Middle East and Africa Intelligent Well Completion Industry Revenue (Million), by Production Analysis 2024 & 2032
- Figure 63: Middle East and Africa Intelligent Well Completion Industry Revenue Share (%), by Production Analysis 2024 & 2032
- Figure 64: Middle East and Africa Intelligent Well Completion Industry Revenue (Million), by Consumption Analysis 2024 & 2032
- Figure 65: Middle East and Africa Intelligent Well Completion Industry Revenue Share (%), by Consumption Analysis 2024 & 2032
- Figure 66: Middle East and Africa Intelligent Well Completion Industry Revenue (Million), by Import Market Analysis (Value & Volume) 2024 & 2032
- Figure 67: Middle East and Africa Intelligent Well Completion Industry Revenue Share (%), by Import Market Analysis (Value & Volume) 2024 & 2032
- Figure 68: Middle East and Africa Intelligent Well Completion Industry Revenue (Million), by Export Market Analysis (Value & Volume) 2024 & 2032
- Figure 69: Middle East and Africa Intelligent Well Completion Industry Revenue Share (%), by Export Market Analysis (Value & Volume) 2024 & 2032
- Figure 70: Middle East and Africa Intelligent Well Completion Industry Revenue (Million), by Price Trend Analysis 2024 & 2032
- Figure 71: Middle East and Africa Intelligent Well Completion Industry Revenue Share (%), by Price Trend Analysis 2024 & 2032
- Figure 72: Middle East and Africa Intelligent Well Completion Industry Revenue (Million), by Country 2024 & 2032
- Figure 73: Middle East and Africa Intelligent Well Completion Industry Revenue Share (%), by Country 2024 & 2032
List of Tables
- Table 1: Global Intelligent Well Completion Industry Revenue Million Forecast, by Region 2019 & 2032
- Table 2: Global Intelligent Well Completion Industry Revenue Million Forecast, by Production Analysis 2019 & 2032
- Table 3: Global Intelligent Well Completion Industry Revenue Million Forecast, by Consumption Analysis 2019 & 2032
- Table 4: Global Intelligent Well Completion Industry Revenue Million Forecast, by Import Market Analysis (Value & Volume) 2019 & 2032
- Table 5: Global Intelligent Well Completion Industry Revenue Million Forecast, by Export Market Analysis (Value & Volume) 2019 & 2032
- Table 6: Global Intelligent Well Completion Industry Revenue Million Forecast, by Price Trend Analysis 2019 & 2032
- Table 7: Global Intelligent Well Completion Industry Revenue Million Forecast, by Region 2019 & 2032
- Table 8: Global Intelligent Well Completion Industry Revenue Million Forecast, by Country 2019 & 2032
- Table 9: United States Intelligent Well Completion Industry Revenue (Million) Forecast, by Application 2019 & 2032
- Table 10: Canada Intelligent Well Completion Industry Revenue (Million) Forecast, by Application 2019 & 2032
- Table 11: Mexico Intelligent Well Completion Industry Revenue (Million) Forecast, by Application 2019 & 2032
- Table 12: Global Intelligent Well Completion Industry Revenue Million Forecast, by Country 2019 & 2032
- Table 13: Germany Intelligent Well Completion Industry Revenue (Million) Forecast, by Application 2019 & 2032
- Table 14: United Kingdom Intelligent Well Completion Industry Revenue (Million) Forecast, by Application 2019 & 2032
- Table 15: France Intelligent Well Completion Industry Revenue (Million) Forecast, by Application 2019 & 2032
- Table 16: Spain Intelligent Well Completion Industry Revenue (Million) Forecast, by Application 2019 & 2032
- Table 17: Italy Intelligent Well Completion Industry Revenue (Million) Forecast, by Application 2019 & 2032
- Table 18: Spain Intelligent Well Completion Industry Revenue (Million) Forecast, by Application 2019 & 2032
- Table 19: Belgium Intelligent Well Completion Industry Revenue (Million) Forecast, by Application 2019 & 2032
- Table 20: Netherland Intelligent Well Completion Industry Revenue (Million) Forecast, by Application 2019 & 2032
- Table 21: Nordics Intelligent Well Completion Industry Revenue (Million) Forecast, by Application 2019 & 2032
- Table 22: Rest of Europe Intelligent Well Completion Industry Revenue (Million) Forecast, by Application 2019 & 2032
- Table 23: Global Intelligent Well Completion Industry Revenue Million Forecast, by Country 2019 & 2032
- Table 24: China Intelligent Well Completion Industry Revenue (Million) Forecast, by Application 2019 & 2032
- Table 25: Japan Intelligent Well Completion Industry Revenue (Million) Forecast, by Application 2019 & 2032
- Table 26: India Intelligent Well Completion Industry Revenue (Million) Forecast, by Application 2019 & 2032
- Table 27: South Korea Intelligent Well Completion Industry Revenue (Million) Forecast, by Application 2019 & 2032
- Table 28: Southeast Asia Intelligent Well Completion Industry Revenue (Million) Forecast, by Application 2019 & 2032
- Table 29: Australia Intelligent Well Completion Industry Revenue (Million) Forecast, by Application 2019 & 2032
- Table 30: Indonesia Intelligent Well Completion Industry Revenue (Million) Forecast, by Application 2019 & 2032
- Table 31: Phillipes Intelligent Well Completion Industry Revenue (Million) Forecast, by Application 2019 & 2032
- Table 32: Singapore Intelligent Well Completion Industry Revenue (Million) Forecast, by Application 2019 & 2032
- Table 33: Thailandc Intelligent Well Completion Industry Revenue (Million) Forecast, by Application 2019 & 2032
- Table 34: Rest of Asia Pacific Intelligent Well Completion Industry Revenue (Million) Forecast, by Application 2019 & 2032
- Table 35: Global Intelligent Well Completion Industry Revenue Million Forecast, by Country 2019 & 2032
- Table 36: Brazil Intelligent Well Completion Industry Revenue (Million) Forecast, by Application 2019 & 2032
- Table 37: Argentina Intelligent Well Completion Industry Revenue (Million) Forecast, by Application 2019 & 2032
- Table 38: Peru Intelligent Well Completion Industry Revenue (Million) Forecast, by Application 2019 & 2032
- Table 39: Chile Intelligent Well Completion Industry Revenue (Million) Forecast, by Application 2019 & 2032
- Table 40: Colombia Intelligent Well Completion Industry Revenue (Million) Forecast, by Application 2019 & 2032
- Table 41: Ecuador Intelligent Well Completion Industry Revenue (Million) Forecast, by Application 2019 & 2032
- Table 42: Venezuela Intelligent Well Completion Industry Revenue (Million) Forecast, by Application 2019 & 2032
- Table 43: Rest of South America Intelligent Well Completion Industry Revenue (Million) Forecast, by Application 2019 & 2032
- Table 44: Global Intelligent Well Completion Industry Revenue Million Forecast, by Country 2019 & 2032
- Table 45: United States Intelligent Well Completion Industry Revenue (Million) Forecast, by Application 2019 & 2032
- Table 46: Canada Intelligent Well Completion Industry Revenue (Million) Forecast, by Application 2019 & 2032
- Table 47: Mexico Intelligent Well Completion Industry Revenue (Million) Forecast, by Application 2019 & 2032
- Table 48: Global Intelligent Well Completion Industry Revenue Million Forecast, by Country 2019 & 2032
- Table 49: United Arab Emirates Intelligent Well Completion Industry Revenue (Million) Forecast, by Application 2019 & 2032
- Table 50: Saudi Arabia Intelligent Well Completion Industry Revenue (Million) Forecast, by Application 2019 & 2032
- Table 51: South Africa Intelligent Well Completion Industry Revenue (Million) Forecast, by Application 2019 & 2032
- Table 52: Rest of Middle East and Africa Intelligent Well Completion Industry Revenue (Million) Forecast, by Application 2019 & 2032
- Table 53: Global Intelligent Well Completion Industry Revenue Million Forecast, by Production Analysis 2019 & 2032
- Table 54: Global Intelligent Well Completion Industry Revenue Million Forecast, by Consumption Analysis 2019 & 2032
- Table 55: Global Intelligent Well Completion Industry Revenue Million Forecast, by Import Market Analysis (Value & Volume) 2019 & 2032
- Table 56: Global Intelligent Well Completion Industry Revenue Million Forecast, by Export Market Analysis (Value & Volume) 2019 & 2032
- Table 57: Global Intelligent Well Completion Industry Revenue Million Forecast, by Price Trend Analysis 2019 & 2032
- Table 58: Global Intelligent Well Completion Industry Revenue Million Forecast, by Country 2019 & 2032
- Table 59: Global Intelligent Well Completion Industry Revenue Million Forecast, by Production Analysis 2019 & 2032
- Table 60: Global Intelligent Well Completion Industry Revenue Million Forecast, by Consumption Analysis 2019 & 2032
- Table 61: Global Intelligent Well Completion Industry Revenue Million Forecast, by Import Market Analysis (Value & Volume) 2019 & 2032
- Table 62: Global Intelligent Well Completion Industry Revenue Million Forecast, by Export Market Analysis (Value & Volume) 2019 & 2032
- Table 63: Global Intelligent Well Completion Industry Revenue Million Forecast, by Price Trend Analysis 2019 & 2032
- Table 64: Global Intelligent Well Completion Industry Revenue Million Forecast, by Country 2019 & 2032
- Table 65: Global Intelligent Well Completion Industry Revenue Million Forecast, by Production Analysis 2019 & 2032
- Table 66: Global Intelligent Well Completion Industry Revenue Million Forecast, by Consumption Analysis 2019 & 2032
- Table 67: Global Intelligent Well Completion Industry Revenue Million Forecast, by Import Market Analysis (Value & Volume) 2019 & 2032
- Table 68: Global Intelligent Well Completion Industry Revenue Million Forecast, by Export Market Analysis (Value & Volume) 2019 & 2032
- Table 69: Global Intelligent Well Completion Industry Revenue Million Forecast, by Price Trend Analysis 2019 & 2032
- Table 70: Global Intelligent Well Completion Industry Revenue Million Forecast, by Country 2019 & 2032
- Table 71: Global Intelligent Well Completion Industry Revenue Million Forecast, by Production Analysis 2019 & 2032
- Table 72: Global Intelligent Well Completion Industry Revenue Million Forecast, by Consumption Analysis 2019 & 2032
- Table 73: Global Intelligent Well Completion Industry Revenue Million Forecast, by Import Market Analysis (Value & Volume) 2019 & 2032
- Table 74: Global Intelligent Well Completion Industry Revenue Million Forecast, by Export Market Analysis (Value & Volume) 2019 & 2032
- Table 75: Global Intelligent Well Completion Industry Revenue Million Forecast, by Price Trend Analysis 2019 & 2032
- Table 76: Global Intelligent Well Completion Industry Revenue Million Forecast, by Country 2019 & 2032
- Table 77: Global Intelligent Well Completion Industry Revenue Million Forecast, by Production Analysis 2019 & 2032
- Table 78: Global Intelligent Well Completion Industry Revenue Million Forecast, by Consumption Analysis 2019 & 2032
- Table 79: Global Intelligent Well Completion Industry Revenue Million Forecast, by Import Market Analysis (Value & Volume) 2019 & 2032
- Table 80: Global Intelligent Well Completion Industry Revenue Million Forecast, by Export Market Analysis (Value & Volume) 2019 & 2032
- Table 81: Global Intelligent Well Completion Industry Revenue Million Forecast, by Price Trend Analysis 2019 & 2032
- Table 82: Global Intelligent Well Completion Industry Revenue Million Forecast, by Country 2019 & 2032
Frequently Asked Questions
1. What is the projected Compound Annual Growth Rate (CAGR) of the Intelligent Well Completion Industry?
The projected CAGR is approximately > 3.50%.
2. Which companies are prominent players in the Intelligent Well Completion Industry?
Key companies in the market include Superior Energy Services Inc, Trican Well Service Ltd, Weir Group PLC, Weatherford International plc, Schlumberger Ltd, Packers Plus Energy Services Inc, Baker Hughes Company, Halliburton Company, National-Oilwell Varco Inc, Schoeller-Bleckmann Oilfield Equipment AG, Welltec A/S*List Not Exhaustive.
3. What are the main segments of the Intelligent Well Completion Industry?
The market segments include Production Analysis, Consumption Analysis, Import Market Analysis (Value & Volume), Export Market Analysis (Value & Volume), Price Trend Analysis.
4. Can you provide details about the market size?
The market size is estimated to be USD XX Million as of 2022.
5. What are some drivers contributing to market growth?
4.; Global Inclination toward Renewable-based Power Generation4.; Increased Power Demand in Line with the Increasing Population.
6. What are the notable trends driving market growth?
Offshore to be the Fastest Growing Segment.
7. Are there any restraints impacting market growth?
4.; High Initial Cost.
8. Can you provide examples of recent developments in the market?
April 2022: Halliburton introduced StrataSta, a deep azimuthal resistivity service that provides multilayer visualization to maximize well contact with the reservoir and improve real-time reserve evaluation. The StrataStar service is an addition to Halliburton's iStar intelligent drilling and logging platform.
9. What pricing options are available for accessing the report?
Pricing options include single-user, multi-user, and enterprise licenses priced at USD 4750, USD 5250, and USD 8750 respectively.
10. Is the market size provided in terms of value or volume?
The market size is provided in terms of value, measured in Million.
11. Are there any specific market keywords associated with the report?
Yes, the market keyword associated with the report is "Intelligent Well Completion Industry," which aids in identifying and referencing the specific market segment covered.
12. How do I determine which pricing option suits my needs best?
The pricing options vary based on user requirements and access needs. Individual users may opt for single-user licenses, while businesses requiring broader access may choose multi-user or enterprise licenses for cost-effective access to the report.
13. Are there any additional resources or data provided in the Intelligent Well Completion Industry report?
While the report offers comprehensive insights, it's advisable to review the specific contents or supplementary materials provided to ascertain if additional resources or data are available.
14. How can I stay updated on further developments or reports in the Intelligent Well Completion Industry?
To stay informed about further developments, trends, and reports in the Intelligent Well Completion Industry, consider subscribing to industry newsletters, following relevant companies and organizations, or regularly checking reputable industry news sources and publications.
Methodology
Step 1 - Identification of Relevant Samples Size from Population Database


Step 2 - Approaches for Defining Global Market Size (Value, Volume* & Price*)

Note*: In applicable scenarios
Step 3 - Data Sources
Primary Research
- Web Analytics
- Survey Reports
- Research Institute
- Latest Research Reports
- Opinion Leaders
Secondary Research
- Annual Reports
- White Paper
- Latest Press Release
- Industry Association
- Paid Database
- Investor Presentations

Step 4 - Data Triangulation
Involves using different sources of information in order to increase the validity of a study
These sources are likely to be stakeholders in a program - participants, other researchers, program staff, other community members, and so on.
Then we put all data in single framework & apply various statistical tools to find out the dynamic on the market.
During the analysis stage, feedback from the stakeholder groups would be compared to determine areas of agreement as well as areas of divergence


