
Key Insights
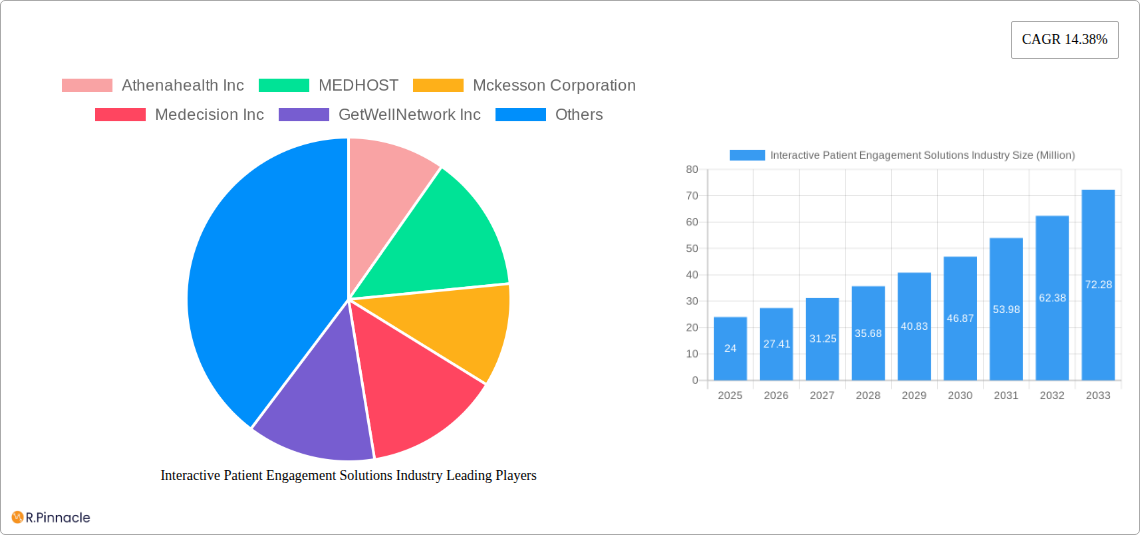
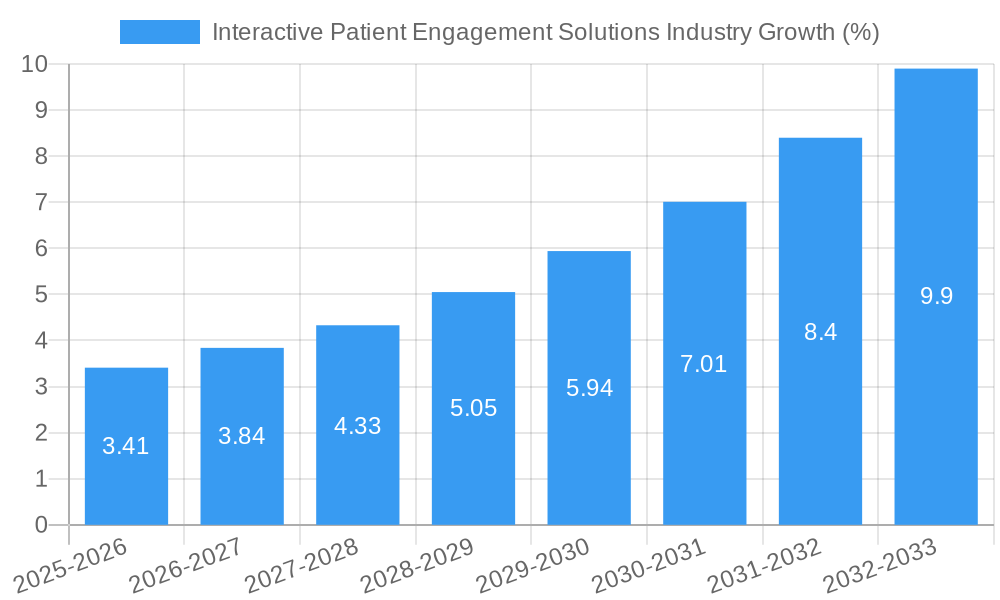
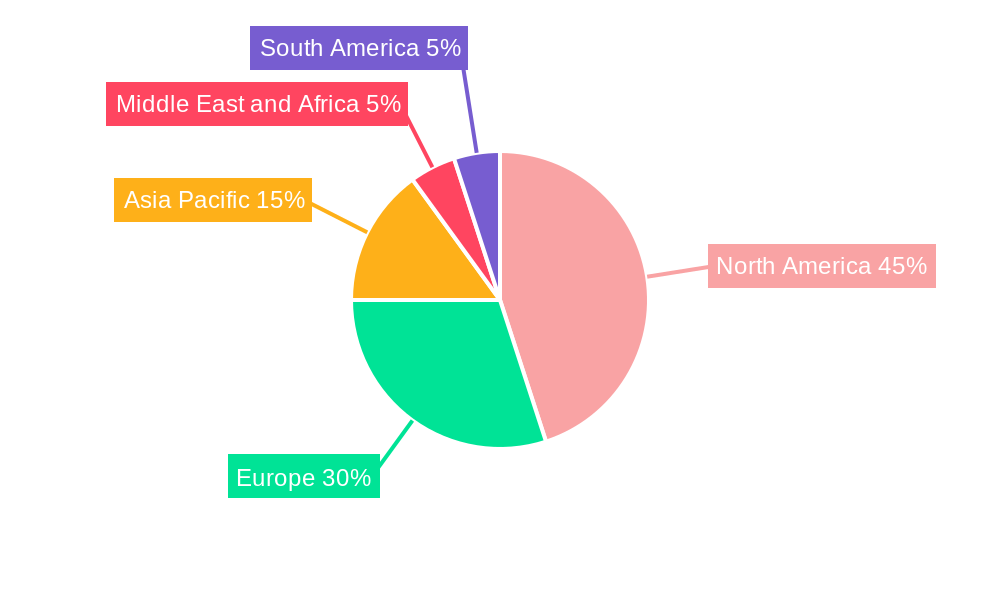
The Interactive Patient Engagement Solutions (IPES) market is experiencing robust growth, projected to reach \$24.00 million in 2025 and exhibiting a Compound Annual Growth Rate (CAGR) of 14.38% from 2025 to 2033. This expansion is fueled by several key drivers. The increasing prevalence of chronic diseases necessitates proactive patient management, driving demand for remote monitoring and telehealth platforms. Furthermore, the rising adoption of electronic health records (EHRs) and the shift towards value-based care models create opportunities for seamless integration of IPES into existing healthcare workflows. Patient empowerment and the desire for personalized healthcare experiences also contribute significantly to market growth. Growth is particularly strong in the cloud-based delivery mode, reflecting the advantages of scalability, accessibility, and cost-effectiveness. The software segment is anticipated to lead market growth, driven by the increasing sophistication of patient engagement applications, while the health and fitness management application segment is witnessing strong adoption rates. North America currently holds a dominant market share, followed by Europe and Asia Pacific, with significant growth potential in emerging markets.
The market's segmentation reveals further insights into its dynamic nature. While hardware components remain important, the software and service segments are experiencing faster growth rates, reflecting the increasing importance of data analytics, personalized communication tools, and remote patient monitoring capabilities. Among applications, social management tools are witnessing increased use for patient support groups and community building, while the home healthcare management segment benefits from the aging population and increasing preference for in-home care. Key players in the market, such as Athenahealth, McKesson, and Cerner, are investing heavily in innovation and strategic partnerships to maintain their competitive edge. However, challenges such as data security concerns, the need for interoperability between different systems, and the varying levels of technological literacy among patients and healthcare providers represent potential restraints to market growth. Overcoming these challenges through robust data security protocols, seamless integration with existing healthcare infrastructure, and targeted user education will be crucial for continued market expansion.
Interactive Patient Engagement Solutions Industry Report: 2019-2033
This comprehensive report provides an in-depth analysis of the Interactive Patient Engagement Solutions industry, projecting a market value of $XX Million by 2033. It covers market structure, dynamics, dominant segments, key players, and future outlook, offering actionable insights for industry professionals. The study period spans 2019-2033, with 2025 as the base and estimated year.
Interactive Patient Engagement Solutions Industry Market Structure & Innovation Trends
The Interactive Patient Engagement Solutions market is characterized by a moderately concentrated structure, with key players such as Athenahealth Inc, MEDHOST, McKesson Corporation, Medecision Inc, GetWellNetwork Inc, Orion Health Ltd, Cerner Corporation, Welvu, Lincor Solutions, Yourcareuniverse Inc, Allscripts Healthcare Solutions Inc, and IBM holding significant market share. Market share estimates for 2025 place the top three players (McKesson, Cerner, and Athenahealth) at approximately XX%, XX%, and XX% respectively, while the remainder of the market is fragmented amongst other competitors. Innovation is driven by the need for improved patient experience, increasing adoption of telehealth, and the growing emphasis on value-based care. Regulatory frameworks, such as HIPAA and GDPR, significantly impact market dynamics. Product substitutes include traditional communication methods and basic patient portals, however, the sophistication and personalization of interactive solutions are key competitive differentiators. The industry has witnessed several mergers and acquisitions (M&A) in recent years, with deal values totaling $XX Million in 2024. Key factors influencing M&A activity include expansion into new markets, technological advancements, and consolidation of market share.
Interactive Patient Engagement Solutions Industry Market Dynamics & Trends
The Interactive Patient Engagement Solutions market is experiencing robust growth, fueled by increasing healthcare expenditure, rising patient expectations, and technological advancements in areas like artificial intelligence and big data analytics. The market is projected to achieve a CAGR of XX% during the forecast period (2025-2033), driven by several factors. The rising adoption of cloud-based solutions and the growing preference for personalized patient experiences are contributing to this growth. The market penetration of interactive patient engagement solutions is expected to reach XX% by 2033. However, competitive intensity and pricing pressures remain significant challenges. Technological disruptions, such as the increased adoption of wearable technology and remote patient monitoring (RPM) tools, are further shaping the market landscape. Consumer preferences are shifting towards user-friendly, personalized, and secure solutions that seamlessly integrate with existing healthcare systems. This necessitates constant innovation and adaptation by market players.
Dominant Regions & Segments in Interactive Patient Engagement Solutions Industry
The North American market currently holds the dominant position in the Interactive Patient Engagement Solutions industry, driven by factors such as higher healthcare expenditure, advanced technological infrastructure, and favorable regulatory environments.
- Key Drivers for North American Dominance:
- High adoption of Electronic Health Records (EHR) systems
- Strong government support for digital health initiatives
- Increased investment in healthcare IT infrastructure
Within segments, the Software component holds the largest market share due to its flexibility and scalability. The Cloud-based delivery model is experiencing rapid growth due to cost-effectiveness, accessibility, and enhanced security features. The Provider end-user segment is the largest contributor, followed by the Payer segment. In applications, Fitness and Health Management, and Home Healthcare Management are experiencing high growth, propelled by increasing awareness of preventative care and the rise of remote patient monitoring. Specific country-level analysis will reveal further insights into market variations, but North America remains the leading region for now.
Interactive Patient Engagement Solutions Industry Product Innovations
Recent product innovations include AI-powered chatbots for improved patient communication, personalized health dashboards providing proactive insights, and integrated telehealth platforms streamlining remote care delivery. These innovations are designed to improve patient adherence, enhance provider efficiency, and facilitate better health outcomes. The successful integration of these solutions within existing healthcare systems and demonstration of their clinical and cost-effectiveness is crucial for market success.
Report Scope & Segmentation Analysis
This report segments the Interactive Patient Engagement Solutions market based on component (hardware, software, service), delivery mode (web-based, cloud-based, on-premise), application (social management, fitness and health management, home healthcare management, financial management), and end-user (provider, payer, patient, other). Growth projections for each segment vary, with software and cloud-based solutions expected to experience the highest growth rates. Market sizes are provided for each segment in the full report for 2025 and projected to 2033. Competitive dynamics within each segment are analyzed, highlighting key players and their strategies.
Key Drivers of Interactive Patient Engagement Solutions Industry Growth
Several factors contribute to the growth of the Interactive Patient Engagement Solutions industry. The increasing adoption of EHRs and other digital health technologies creates a foundation for seamless integration. Government initiatives promoting telehealth and remote patient monitoring are fostering market expansion. The rising demand for personalized care and proactive health management is driving the adoption of advanced solutions. Additionally, a growing emphasis on population health management and value-based care are further fueling demand for these technologies.
Challenges in the Interactive Patient Engagement Solutions Industry Sector
Challenges include the high initial investment costs associated with implementing these solutions, concerns about data security and privacy, and the complexity of integrating different systems. Interoperability issues between different healthcare systems remain a significant hurdle, impacting seamless data flow and overall solution efficacy. Regulatory compliance requirements also present challenges, potentially leading to delays in implementation and increased operational costs.
Emerging Opportunities in Interactive Patient Engagement Solutions Industry
Opportunities abound in the development of innovative solutions utilizing AI, machine learning, and blockchain technology to enhance personalization, security, and efficiency. Expanding into emerging markets with limited access to healthcare services presents significant opportunities for growth. The integration of wearable sensors and remote patient monitoring devices creates new avenues for proactive health management and personalized interventions.
Leading Players in the Interactive Patient Engagement Solutions Industry Market
- Athenahealth Inc
- MEDHOST
- Mckesson Corporation
- Medecision Inc
- GetWellNetwork Inc
- Orion Health Ltd
- Cerner Corporation
- Welvu
- Lincor Solutions
- Yourcareuniverse Inc
- Allscripts Healthcare Solutions Inc
- IBM
Key Developments in Interactive Patient Engagement Solutions Industry Industry
- March 2022: DeliverHealth launched its partner program, aiming to expand its reach and improve healthcare efficiency.
- March 2022: Epic launched "Cheers," a CRM tool designed to improve patient communication, particularly in response to the challenges posed by the COVID-19 pandemic.
Future Outlook for Interactive Patient Engagement Solutions Industry Market
The Interactive Patient Engagement Solutions market is poised for continued strong growth, driven by technological advancements, increasing demand for personalized healthcare, and supportive regulatory environments. Strategic partnerships, acquisitions, and the development of innovative solutions addressing unmet needs will be key to success. The focus will remain on enhancing patient experience, improving health outcomes, and creating more efficient healthcare delivery models.
Interactive Patient Engagement Solutions Industry Segmentation
-
1. Component
- 1.1. Hardware
- 1.2. Software
- 1.3. Service
-
2. Delivery Mode
- 2.1. Web-based and Cloud-based
- 2.2. On-Premise
-
3. Application
- 3.1. Social Management
- 3.2. Fitness and Health Management
- 3.3. Home Healthcare Management
- 3.4. Financial Management
-
4. End User
- 4.1. Provider
- 4.2. Payer
- 4.3. Patient
- 4.4. Other End Users
Interactive Patient Engagement Solutions Industry Segmentation By Geography
-
1. North America
- 1.1. United States
- 1.2. Canada
- 1.3. Mexico
-
2. Europe
- 2.1. Germany
- 2.2. United Kingdom
- 2.3. France
- 2.4. Italy
- 2.5. Spain
- 2.6. Rest of Europe
-
3. Asia Pacific
- 3.1. China
- 3.2. Japan
- 3.3. India
- 3.4. Australia
- 3.5. South Korea
- 3.6. Rest of Asia Pacific
-
4. Middle East and Africa
- 4.1. GCC
- 4.2. South Africa
- 4.3. Rest of Middle East and Africa
-
5. South America
- 5.1. Brazil
- 5.2. Argentina
- 5.3. Rest of South America
Interactive Patient Engagement Solutions Industry REPORT HIGHLIGHTS
| Aspects | Details |
|---|---|
| Study Period | 2019-2033 |
| Base Year | 2024 |
| Estimated Year | 2025 |
| Forecast Period | 2025-2033 |
| Historical Period | 2019-2024 |
| Growth Rate | CAGR of 14.38% from 2019-2033 |
| Segmentation |
|
Table of Contents
- 1. Introduction
- 1.1. Research Scope
- 1.2. Market Segmentation
- 1.3. Research Methodology
- 1.4. Definitions and Assumptions
- 2. Executive Summary
- 2.1. Introduction
- 3. Market Dynamics
- 3.1. Introduction
- 3.2. Market Drivers
- 3.2.1. Rising Trend of Mobile Health Applications; Growing Popularity of Patient Engagement Solutions Among the Aging Population; Rising Investments and Technological advancements
- 3.3. Market Restrains
- 3.3.1. Protection of Patient Information; Lack of Skilled IT Professionals in the Healthcare Industry
- 3.4. Market Trends
- 3.4.1. Web-based and Cloud-based Services Segment is Expected to Witness Growth Over the Forecast Period
- 4. Market Factor Analysis
- 4.1. Porters Five Forces
- 4.2. Supply/Value Chain
- 4.3. PESTEL analysis
- 4.4. Market Entropy
- 4.5. Patent/Trademark Analysis
- 5. Global Interactive Patient Engagement Solutions Industry Analysis, Insights and Forecast, 2019-2031
- 5.1. Market Analysis, Insights and Forecast - by Component
- 5.1.1. Hardware
- 5.1.2. Software
- 5.1.3. Service
- 5.2. Market Analysis, Insights and Forecast - by Delivery Mode
- 5.2.1. Web-based and Cloud-based
- 5.2.2. On-Premise
- 5.3. Market Analysis, Insights and Forecast - by Application
- 5.3.1. Social Management
- 5.3.2. Fitness and Health Management
- 5.3.3. Home Healthcare Management
- 5.3.4. Financial Management
- 5.4. Market Analysis, Insights and Forecast - by End User
- 5.4.1. Provider
- 5.4.2. Payer
- 5.4.3. Patient
- 5.4.4. Other End Users
- 5.5. Market Analysis, Insights and Forecast - by Region
- 5.5.1. North America
- 5.5.2. Europe
- 5.5.3. Asia Pacific
- 5.5.4. Middle East and Africa
- 5.5.5. South America
- 5.1. Market Analysis, Insights and Forecast - by Component
- 6. North America Interactive Patient Engagement Solutions Industry Analysis, Insights and Forecast, 2019-2031
- 6.1. Market Analysis, Insights and Forecast - by Component
- 6.1.1. Hardware
- 6.1.2. Software
- 6.1.3. Service
- 6.2. Market Analysis, Insights and Forecast - by Delivery Mode
- 6.2.1. Web-based and Cloud-based
- 6.2.2. On-Premise
- 6.3. Market Analysis, Insights and Forecast - by Application
- 6.3.1. Social Management
- 6.3.2. Fitness and Health Management
- 6.3.3. Home Healthcare Management
- 6.3.4. Financial Management
- 6.4. Market Analysis, Insights and Forecast - by End User
- 6.4.1. Provider
- 6.4.2. Payer
- 6.4.3. Patient
- 6.4.4. Other End Users
- 6.1. Market Analysis, Insights and Forecast - by Component
- 7. Europe Interactive Patient Engagement Solutions Industry Analysis, Insights and Forecast, 2019-2031
- 7.1. Market Analysis, Insights and Forecast - by Component
- 7.1.1. Hardware
- 7.1.2. Software
- 7.1.3. Service
- 7.2. Market Analysis, Insights and Forecast - by Delivery Mode
- 7.2.1. Web-based and Cloud-based
- 7.2.2. On-Premise
- 7.3. Market Analysis, Insights and Forecast - by Application
- 7.3.1. Social Management
- 7.3.2. Fitness and Health Management
- 7.3.3. Home Healthcare Management
- 7.3.4. Financial Management
- 7.4. Market Analysis, Insights and Forecast - by End User
- 7.4.1. Provider
- 7.4.2. Payer
- 7.4.3. Patient
- 7.4.4. Other End Users
- 7.1. Market Analysis, Insights and Forecast - by Component
- 8. Asia Pacific Interactive Patient Engagement Solutions Industry Analysis, Insights and Forecast, 2019-2031
- 8.1. Market Analysis, Insights and Forecast - by Component
- 8.1.1. Hardware
- 8.1.2. Software
- 8.1.3. Service
- 8.2. Market Analysis, Insights and Forecast - by Delivery Mode
- 8.2.1. Web-based and Cloud-based
- 8.2.2. On-Premise
- 8.3. Market Analysis, Insights and Forecast - by Application
- 8.3.1. Social Management
- 8.3.2. Fitness and Health Management
- 8.3.3. Home Healthcare Management
- 8.3.4. Financial Management
- 8.4. Market Analysis, Insights and Forecast - by End User
- 8.4.1. Provider
- 8.4.2. Payer
- 8.4.3. Patient
- 8.4.4. Other End Users
- 8.1. Market Analysis, Insights and Forecast - by Component
- 9. Middle East and Africa Interactive Patient Engagement Solutions Industry Analysis, Insights and Forecast, 2019-2031
- 9.1. Market Analysis, Insights and Forecast - by Component
- 9.1.1. Hardware
- 9.1.2. Software
- 9.1.3. Service
- 9.2. Market Analysis, Insights and Forecast - by Delivery Mode
- 9.2.1. Web-based and Cloud-based
- 9.2.2. On-Premise
- 9.3. Market Analysis, Insights and Forecast - by Application
- 9.3.1. Social Management
- 9.3.2. Fitness and Health Management
- 9.3.3. Home Healthcare Management
- 9.3.4. Financial Management
- 9.4. Market Analysis, Insights and Forecast - by End User
- 9.4.1. Provider
- 9.4.2. Payer
- 9.4.3. Patient
- 9.4.4. Other End Users
- 9.1. Market Analysis, Insights and Forecast - by Component
- 10. South America Interactive Patient Engagement Solutions Industry Analysis, Insights and Forecast, 2019-2031
- 10.1. Market Analysis, Insights and Forecast - by Component
- 10.1.1. Hardware
- 10.1.2. Software
- 10.1.3. Service
- 10.2. Market Analysis, Insights and Forecast - by Delivery Mode
- 10.2.1. Web-based and Cloud-based
- 10.2.2. On-Premise
- 10.3. Market Analysis, Insights and Forecast - by Application
- 10.3.1. Social Management
- 10.3.2. Fitness and Health Management
- 10.3.3. Home Healthcare Management
- 10.3.4. Financial Management
- 10.4. Market Analysis, Insights and Forecast - by End User
- 10.4.1. Provider
- 10.4.2. Payer
- 10.4.3. Patient
- 10.4.4. Other End Users
- 10.1. Market Analysis, Insights and Forecast - by Component
- 11. North America Interactive Patient Engagement Solutions Industry Analysis, Insights and Forecast, 2019-2031
- 11.1. Market Analysis, Insights and Forecast - By Country/Sub-region
- 11.1.1 United States
- 11.1.2 Canada
- 11.1.3 Mexico
- 12. Europe Interactive Patient Engagement Solutions Industry Analysis, Insights and Forecast, 2019-2031
- 12.1. Market Analysis, Insights and Forecast - By Country/Sub-region
- 12.1.1 Germany
- 12.1.2 United Kingdom
- 12.1.3 France
- 12.1.4 Italy
- 12.1.5 Spain
- 12.1.6 Rest of Europe
- 13. Asia Pacific Interactive Patient Engagement Solutions Industry Analysis, Insights and Forecast, 2019-2031
- 13.1. Market Analysis, Insights and Forecast - By Country/Sub-region
- 13.1.1 China
- 13.1.2 Japan
- 13.1.3 India
- 13.1.4 Australia
- 13.1.5 South Korea
- 13.1.6 Rest of Asia Pacific
- 14. Middle East and Africa Interactive Patient Engagement Solutions Industry Analysis, Insights and Forecast, 2019-2031
- 14.1. Market Analysis, Insights and Forecast - By Country/Sub-region
- 14.1.1 GCC
- 14.1.2 South Africa
- 14.1.3 Rest of Middle East and Africa
- 15. South America Interactive Patient Engagement Solutions Industry Analysis, Insights and Forecast, 2019-2031
- 15.1. Market Analysis, Insights and Forecast - By Country/Sub-region
- 15.1.1 Brazil
- 15.1.2 Argentina
- 15.1.3 Rest of South America
- 16. Competitive Analysis
- 16.1. Global Market Share Analysis 2024
- 16.2. Company Profiles
- 16.2.1 Athenahealth Inc
- 16.2.1.1. Overview
- 16.2.1.2. Products
- 16.2.1.3. SWOT Analysis
- 16.2.1.4. Recent Developments
- 16.2.1.5. Financials (Based on Availability)
- 16.2.2 MEDHOST
- 16.2.2.1. Overview
- 16.2.2.2. Products
- 16.2.2.3. SWOT Analysis
- 16.2.2.4. Recent Developments
- 16.2.2.5. Financials (Based on Availability)
- 16.2.3 Mckesson Corporation
- 16.2.3.1. Overview
- 16.2.3.2. Products
- 16.2.3.3. SWOT Analysis
- 16.2.3.4. Recent Developments
- 16.2.3.5. Financials (Based on Availability)
- 16.2.4 Medecision Inc
- 16.2.4.1. Overview
- 16.2.4.2. Products
- 16.2.4.3. SWOT Analysis
- 16.2.4.4. Recent Developments
- 16.2.4.5. Financials (Based on Availability)
- 16.2.5 GetWellNetwork Inc
- 16.2.5.1. Overview
- 16.2.5.2. Products
- 16.2.5.3. SWOT Analysis
- 16.2.5.4. Recent Developments
- 16.2.5.5. Financials (Based on Availability)
- 16.2.6 Orion Health Ltd
- 16.2.6.1. Overview
- 16.2.6.2. Products
- 16.2.6.3. SWOT Analysis
- 16.2.6.4. Recent Developments
- 16.2.6.5. Financials (Based on Availability)
- 16.2.7 Cerner Corporation
- 16.2.7.1. Overview
- 16.2.7.2. Products
- 16.2.7.3. SWOT Analysis
- 16.2.7.4. Recent Developments
- 16.2.7.5. Financials (Based on Availability)
- 16.2.8 Welvu
- 16.2.8.1. Overview
- 16.2.8.2. Products
- 16.2.8.3. SWOT Analysis
- 16.2.8.4. Recent Developments
- 16.2.8.5. Financials (Based on Availability)
- 16.2.9 Lincor Solutions
- 16.2.9.1. Overview
- 16.2.9.2. Products
- 16.2.9.3. SWOT Analysis
- 16.2.9.4. Recent Developments
- 16.2.9.5. Financials (Based on Availability)
- 16.2.10 Yourcareuniverse Inc
- 16.2.10.1. Overview
- 16.2.10.2. Products
- 16.2.10.3. SWOT Analysis
- 16.2.10.4. Recent Developments
- 16.2.10.5. Financials (Based on Availability)
- 16.2.11 Allscripts Healthcare Solutions Inc
- 16.2.11.1. Overview
- 16.2.11.2. Products
- 16.2.11.3. SWOT Analysis
- 16.2.11.4. Recent Developments
- 16.2.11.5. Financials (Based on Availability)
- 16.2.12 IBM
- 16.2.12.1. Overview
- 16.2.12.2. Products
- 16.2.12.3. SWOT Analysis
- 16.2.12.4. Recent Developments
- 16.2.12.5. Financials (Based on Availability)
- 16.2.1 Athenahealth Inc
List of Figures
- Figure 1: Global Interactive Patient Engagement Solutions Industry Revenue Breakdown (Million, %) by Region 2024 & 2032
- Figure 2: Global Interactive Patient Engagement Solutions Industry Volume Breakdown (K Unit, %) by Region 2024 & 2032
- Figure 3: North America Interactive Patient Engagement Solutions Industry Revenue (Million), by Country 2024 & 2032
- Figure 4: North America Interactive Patient Engagement Solutions Industry Volume (K Unit), by Country 2024 & 2032
- Figure 5: North America Interactive Patient Engagement Solutions Industry Revenue Share (%), by Country 2024 & 2032
- Figure 6: North America Interactive Patient Engagement Solutions Industry Volume Share (%), by Country 2024 & 2032
- Figure 7: Europe Interactive Patient Engagement Solutions Industry Revenue (Million), by Country 2024 & 2032
- Figure 8: Europe Interactive Patient Engagement Solutions Industry Volume (K Unit), by Country 2024 & 2032
- Figure 9: Europe Interactive Patient Engagement Solutions Industry Revenue Share (%), by Country 2024 & 2032
- Figure 10: Europe Interactive Patient Engagement Solutions Industry Volume Share (%), by Country 2024 & 2032
- Figure 11: Asia Pacific Interactive Patient Engagement Solutions Industry Revenue (Million), by Country 2024 & 2032
- Figure 12: Asia Pacific Interactive Patient Engagement Solutions Industry Volume (K Unit), by Country 2024 & 2032
- Figure 13: Asia Pacific Interactive Patient Engagement Solutions Industry Revenue Share (%), by Country 2024 & 2032
- Figure 14: Asia Pacific Interactive Patient Engagement Solutions Industry Volume Share (%), by Country 2024 & 2032
- Figure 15: Middle East and Africa Interactive Patient Engagement Solutions Industry Revenue (Million), by Country 2024 & 2032
- Figure 16: Middle East and Africa Interactive Patient Engagement Solutions Industry Volume (K Unit), by Country 2024 & 2032
- Figure 17: Middle East and Africa Interactive Patient Engagement Solutions Industry Revenue Share (%), by Country 2024 & 2032
- Figure 18: Middle East and Africa Interactive Patient Engagement Solutions Industry Volume Share (%), by Country 2024 & 2032
- Figure 19: South America Interactive Patient Engagement Solutions Industry Revenue (Million), by Country 2024 & 2032
- Figure 20: South America Interactive Patient Engagement Solutions Industry Volume (K Unit), by Country 2024 & 2032
- Figure 21: South America Interactive Patient Engagement Solutions Industry Revenue Share (%), by Country 2024 & 2032
- Figure 22: South America Interactive Patient Engagement Solutions Industry Volume Share (%), by Country 2024 & 2032
- Figure 23: North America Interactive Patient Engagement Solutions Industry Revenue (Million), by Component 2024 & 2032
- Figure 24: North America Interactive Patient Engagement Solutions Industry Volume (K Unit), by Component 2024 & 2032
- Figure 25: North America Interactive Patient Engagement Solutions Industry Revenue Share (%), by Component 2024 & 2032
- Figure 26: North America Interactive Patient Engagement Solutions Industry Volume Share (%), by Component 2024 & 2032
- Figure 27: North America Interactive Patient Engagement Solutions Industry Revenue (Million), by Delivery Mode 2024 & 2032
- Figure 28: North America Interactive Patient Engagement Solutions Industry Volume (K Unit), by Delivery Mode 2024 & 2032
- Figure 29: North America Interactive Patient Engagement Solutions Industry Revenue Share (%), by Delivery Mode 2024 & 2032
- Figure 30: North America Interactive Patient Engagement Solutions Industry Volume Share (%), by Delivery Mode 2024 & 2032
- Figure 31: North America Interactive Patient Engagement Solutions Industry Revenue (Million), by Application 2024 & 2032
- Figure 32: North America Interactive Patient Engagement Solutions Industry Volume (K Unit), by Application 2024 & 2032
- Figure 33: North America Interactive Patient Engagement Solutions Industry Revenue Share (%), by Application 2024 & 2032
- Figure 34: North America Interactive Patient Engagement Solutions Industry Volume Share (%), by Application 2024 & 2032
- Figure 35: North America Interactive Patient Engagement Solutions Industry Revenue (Million), by End User 2024 & 2032
- Figure 36: North America Interactive Patient Engagement Solutions Industry Volume (K Unit), by End User 2024 & 2032
- Figure 37: North America Interactive Patient Engagement Solutions Industry Revenue Share (%), by End User 2024 & 2032
- Figure 38: North America Interactive Patient Engagement Solutions Industry Volume Share (%), by End User 2024 & 2032
- Figure 39: North America Interactive Patient Engagement Solutions Industry Revenue (Million), by Country 2024 & 2032
- Figure 40: North America Interactive Patient Engagement Solutions Industry Volume (K Unit), by Country 2024 & 2032
- Figure 41: North America Interactive Patient Engagement Solutions Industry Revenue Share (%), by Country 2024 & 2032
- Figure 42: North America Interactive Patient Engagement Solutions Industry Volume Share (%), by Country 2024 & 2032
- Figure 43: Europe Interactive Patient Engagement Solutions Industry Revenue (Million), by Component 2024 & 2032
- Figure 44: Europe Interactive Patient Engagement Solutions Industry Volume (K Unit), by Component 2024 & 2032
- Figure 45: Europe Interactive Patient Engagement Solutions Industry Revenue Share (%), by Component 2024 & 2032
- Figure 46: Europe Interactive Patient Engagement Solutions Industry Volume Share (%), by Component 2024 & 2032
- Figure 47: Europe Interactive Patient Engagement Solutions Industry Revenue (Million), by Delivery Mode 2024 & 2032
- Figure 48: Europe Interactive Patient Engagement Solutions Industry Volume (K Unit), by Delivery Mode 2024 & 2032
- Figure 49: Europe Interactive Patient Engagement Solutions Industry Revenue Share (%), by Delivery Mode 2024 & 2032
- Figure 50: Europe Interactive Patient Engagement Solutions Industry Volume Share (%), by Delivery Mode 2024 & 2032
- Figure 51: Europe Interactive Patient Engagement Solutions Industry Revenue (Million), by Application 2024 & 2032
- Figure 52: Europe Interactive Patient Engagement Solutions Industry Volume (K Unit), by Application 2024 & 2032
- Figure 53: Europe Interactive Patient Engagement Solutions Industry Revenue Share (%), by Application 2024 & 2032
- Figure 54: Europe Interactive Patient Engagement Solutions Industry Volume Share (%), by Application 2024 & 2032
- Figure 55: Europe Interactive Patient Engagement Solutions Industry Revenue (Million), by End User 2024 & 2032
- Figure 56: Europe Interactive Patient Engagement Solutions Industry Volume (K Unit), by End User 2024 & 2032
- Figure 57: Europe Interactive Patient Engagement Solutions Industry Revenue Share (%), by End User 2024 & 2032
- Figure 58: Europe Interactive Patient Engagement Solutions Industry Volume Share (%), by End User 2024 & 2032
- Figure 59: Europe Interactive Patient Engagement Solutions Industry Revenue (Million), by Country 2024 & 2032
- Figure 60: Europe Interactive Patient Engagement Solutions Industry Volume (K Unit), by Country 2024 & 2032
- Figure 61: Europe Interactive Patient Engagement Solutions Industry Revenue Share (%), by Country 2024 & 2032
- Figure 62: Europe Interactive Patient Engagement Solutions Industry Volume Share (%), by Country 2024 & 2032
- Figure 63: Asia Pacific Interactive Patient Engagement Solutions Industry Revenue (Million), by Component 2024 & 2032
- Figure 64: Asia Pacific Interactive Patient Engagement Solutions Industry Volume (K Unit), by Component 2024 & 2032
- Figure 65: Asia Pacific Interactive Patient Engagement Solutions Industry Revenue Share (%), by Component 2024 & 2032
- Figure 66: Asia Pacific Interactive Patient Engagement Solutions Industry Volume Share (%), by Component 2024 & 2032
- Figure 67: Asia Pacific Interactive Patient Engagement Solutions Industry Revenue (Million), by Delivery Mode 2024 & 2032
- Figure 68: Asia Pacific Interactive Patient Engagement Solutions Industry Volume (K Unit), by Delivery Mode 2024 & 2032
- Figure 69: Asia Pacific Interactive Patient Engagement Solutions Industry Revenue Share (%), by Delivery Mode 2024 & 2032
- Figure 70: Asia Pacific Interactive Patient Engagement Solutions Industry Volume Share (%), by Delivery Mode 2024 & 2032
- Figure 71: Asia Pacific Interactive Patient Engagement Solutions Industry Revenue (Million), by Application 2024 & 2032
- Figure 72: Asia Pacific Interactive Patient Engagement Solutions Industry Volume (K Unit), by Application 2024 & 2032
- Figure 73: Asia Pacific Interactive Patient Engagement Solutions Industry Revenue Share (%), by Application 2024 & 2032
- Figure 74: Asia Pacific Interactive Patient Engagement Solutions Industry Volume Share (%), by Application 2024 & 2032
- Figure 75: Asia Pacific Interactive Patient Engagement Solutions Industry Revenue (Million), by End User 2024 & 2032
- Figure 76: Asia Pacific Interactive Patient Engagement Solutions Industry Volume (K Unit), by End User 2024 & 2032
- Figure 77: Asia Pacific Interactive Patient Engagement Solutions Industry Revenue Share (%), by End User 2024 & 2032
- Figure 78: Asia Pacific Interactive Patient Engagement Solutions Industry Volume Share (%), by End User 2024 & 2032
- Figure 79: Asia Pacific Interactive Patient Engagement Solutions Industry Revenue (Million), by Country 2024 & 2032
- Figure 80: Asia Pacific Interactive Patient Engagement Solutions Industry Volume (K Unit), by Country 2024 & 2032
- Figure 81: Asia Pacific Interactive Patient Engagement Solutions Industry Revenue Share (%), by Country 2024 & 2032
- Figure 82: Asia Pacific Interactive Patient Engagement Solutions Industry Volume Share (%), by Country 2024 & 2032
- Figure 83: Middle East and Africa Interactive Patient Engagement Solutions Industry Revenue (Million), by Component 2024 & 2032
- Figure 84: Middle East and Africa Interactive Patient Engagement Solutions Industry Volume (K Unit), by Component 2024 & 2032
- Figure 85: Middle East and Africa Interactive Patient Engagement Solutions Industry Revenue Share (%), by Component 2024 & 2032
- Figure 86: Middle East and Africa Interactive Patient Engagement Solutions Industry Volume Share (%), by Component 2024 & 2032
- Figure 87: Middle East and Africa Interactive Patient Engagement Solutions Industry Revenue (Million), by Delivery Mode 2024 & 2032
- Figure 88: Middle East and Africa Interactive Patient Engagement Solutions Industry Volume (K Unit), by Delivery Mode 2024 & 2032
- Figure 89: Middle East and Africa Interactive Patient Engagement Solutions Industry Revenue Share (%), by Delivery Mode 2024 & 2032
- Figure 90: Middle East and Africa Interactive Patient Engagement Solutions Industry Volume Share (%), by Delivery Mode 2024 & 2032
- Figure 91: Middle East and Africa Interactive Patient Engagement Solutions Industry Revenue (Million), by Application 2024 & 2032
- Figure 92: Middle East and Africa Interactive Patient Engagement Solutions Industry Volume (K Unit), by Application 2024 & 2032
- Figure 93: Middle East and Africa Interactive Patient Engagement Solutions Industry Revenue Share (%), by Application 2024 & 2032
- Figure 94: Middle East and Africa Interactive Patient Engagement Solutions Industry Volume Share (%), by Application 2024 & 2032
- Figure 95: Middle East and Africa Interactive Patient Engagement Solutions Industry Revenue (Million), by End User 2024 & 2032
- Figure 96: Middle East and Africa Interactive Patient Engagement Solutions Industry Volume (K Unit), by End User 2024 & 2032
- Figure 97: Middle East and Africa Interactive Patient Engagement Solutions Industry Revenue Share (%), by End User 2024 & 2032
- Figure 98: Middle East and Africa Interactive Patient Engagement Solutions Industry Volume Share (%), by End User 2024 & 2032
- Figure 99: Middle East and Africa Interactive Patient Engagement Solutions Industry Revenue (Million), by Country 2024 & 2032
- Figure 100: Middle East and Africa Interactive Patient Engagement Solutions Industry Volume (K Unit), by Country 2024 & 2032
- Figure 101: Middle East and Africa Interactive Patient Engagement Solutions Industry Revenue Share (%), by Country 2024 & 2032
- Figure 102: Middle East and Africa Interactive Patient Engagement Solutions Industry Volume Share (%), by Country 2024 & 2032
- Figure 103: South America Interactive Patient Engagement Solutions Industry Revenue (Million), by Component 2024 & 2032
- Figure 104: South America Interactive Patient Engagement Solutions Industry Volume (K Unit), by Component 2024 & 2032
- Figure 105: South America Interactive Patient Engagement Solutions Industry Revenue Share (%), by Component 2024 & 2032
- Figure 106: South America Interactive Patient Engagement Solutions Industry Volume Share (%), by Component 2024 & 2032
- Figure 107: South America Interactive Patient Engagement Solutions Industry Revenue (Million), by Delivery Mode 2024 & 2032
- Figure 108: South America Interactive Patient Engagement Solutions Industry Volume (K Unit), by Delivery Mode 2024 & 2032
- Figure 109: South America Interactive Patient Engagement Solutions Industry Revenue Share (%), by Delivery Mode 2024 & 2032
- Figure 110: South America Interactive Patient Engagement Solutions Industry Volume Share (%), by Delivery Mode 2024 & 2032
- Figure 111: South America Interactive Patient Engagement Solutions Industry Revenue (Million), by Application 2024 & 2032
- Figure 112: South America Interactive Patient Engagement Solutions Industry Volume (K Unit), by Application 2024 & 2032
- Figure 113: South America Interactive Patient Engagement Solutions Industry Revenue Share (%), by Application 2024 & 2032
- Figure 114: South America Interactive Patient Engagement Solutions Industry Volume Share (%), by Application 2024 & 2032
- Figure 115: South America Interactive Patient Engagement Solutions Industry Revenue (Million), by End User 2024 & 2032
- Figure 116: South America Interactive Patient Engagement Solutions Industry Volume (K Unit), by End User 2024 & 2032
- Figure 117: South America Interactive Patient Engagement Solutions Industry Revenue Share (%), by End User 2024 & 2032
- Figure 118: South America Interactive Patient Engagement Solutions Industry Volume Share (%), by End User 2024 & 2032
- Figure 119: South America Interactive Patient Engagement Solutions Industry Revenue (Million), by Country 2024 & 2032
- Figure 120: South America Interactive Patient Engagement Solutions Industry Volume (K Unit), by Country 2024 & 2032
- Figure 121: South America Interactive Patient Engagement Solutions Industry Revenue Share (%), by Country 2024 & 2032
- Figure 122: South America Interactive Patient Engagement Solutions Industry Volume Share (%), by Country 2024 & 2032
List of Tables
- Table 1: Global Interactive Patient Engagement Solutions Industry Revenue Million Forecast, by Region 2019 & 2032
- Table 2: Global Interactive Patient Engagement Solutions Industry Volume K Unit Forecast, by Region 2019 & 2032
- Table 3: Global Interactive Patient Engagement Solutions Industry Revenue Million Forecast, by Component 2019 & 2032
- Table 4: Global Interactive Patient Engagement Solutions Industry Volume K Unit Forecast, by Component 2019 & 2032
- Table 5: Global Interactive Patient Engagement Solutions Industry Revenue Million Forecast, by Delivery Mode 2019 & 2032
- Table 6: Global Interactive Patient Engagement Solutions Industry Volume K Unit Forecast, by Delivery Mode 2019 & 2032
- Table 7: Global Interactive Patient Engagement Solutions Industry Revenue Million Forecast, by Application 2019 & 2032
- Table 8: Global Interactive Patient Engagement Solutions Industry Volume K Unit Forecast, by Application 2019 & 2032
- Table 9: Global Interactive Patient Engagement Solutions Industry Revenue Million Forecast, by End User 2019 & 2032
- Table 10: Global Interactive Patient Engagement Solutions Industry Volume K Unit Forecast, by End User 2019 & 2032
- Table 11: Global Interactive Patient Engagement Solutions Industry Revenue Million Forecast, by Region 2019 & 2032
- Table 12: Global Interactive Patient Engagement Solutions Industry Volume K Unit Forecast, by Region 2019 & 2032
- Table 13: Global Interactive Patient Engagement Solutions Industry Revenue Million Forecast, by Country 2019 & 2032
- Table 14: Global Interactive Patient Engagement Solutions Industry Volume K Unit Forecast, by Country 2019 & 2032
- Table 15: United States Interactive Patient Engagement Solutions Industry Revenue (Million) Forecast, by Application 2019 & 2032
- Table 16: United States Interactive Patient Engagement Solutions Industry Volume (K Unit) Forecast, by Application 2019 & 2032
- Table 17: Canada Interactive Patient Engagement Solutions Industry Revenue (Million) Forecast, by Application 2019 & 2032
- Table 18: Canada Interactive Patient Engagement Solutions Industry Volume (K Unit) Forecast, by Application 2019 & 2032
- Table 19: Mexico Interactive Patient Engagement Solutions Industry Revenue (Million) Forecast, by Application 2019 & 2032
- Table 20: Mexico Interactive Patient Engagement Solutions Industry Volume (K Unit) Forecast, by Application 2019 & 2032
- Table 21: Global Interactive Patient Engagement Solutions Industry Revenue Million Forecast, by Country 2019 & 2032
- Table 22: Global Interactive Patient Engagement Solutions Industry Volume K Unit Forecast, by Country 2019 & 2032
- Table 23: Germany Interactive Patient Engagement Solutions Industry Revenue (Million) Forecast, by Application 2019 & 2032
- Table 24: Germany Interactive Patient Engagement Solutions Industry Volume (K Unit) Forecast, by Application 2019 & 2032
- Table 25: United Kingdom Interactive Patient Engagement Solutions Industry Revenue (Million) Forecast, by Application 2019 & 2032
- Table 26: United Kingdom Interactive Patient Engagement Solutions Industry Volume (K Unit) Forecast, by Application 2019 & 2032
- Table 27: France Interactive Patient Engagement Solutions Industry Revenue (Million) Forecast, by Application 2019 & 2032
- Table 28: France Interactive Patient Engagement Solutions Industry Volume (K Unit) Forecast, by Application 2019 & 2032
- Table 29: Italy Interactive Patient Engagement Solutions Industry Revenue (Million) Forecast, by Application 2019 & 2032
- Table 30: Italy Interactive Patient Engagement Solutions Industry Volume (K Unit) Forecast, by Application 2019 & 2032
- Table 31: Spain Interactive Patient Engagement Solutions Industry Revenue (Million) Forecast, by Application 2019 & 2032
- Table 32: Spain Interactive Patient Engagement Solutions Industry Volume (K Unit) Forecast, by Application 2019 & 2032
- Table 33: Rest of Europe Interactive Patient Engagement Solutions Industry Revenue (Million) Forecast, by Application 2019 & 2032
- Table 34: Rest of Europe Interactive Patient Engagement Solutions Industry Volume (K Unit) Forecast, by Application 2019 & 2032
- Table 35: Global Interactive Patient Engagement Solutions Industry Revenue Million Forecast, by Country 2019 & 2032
- Table 36: Global Interactive Patient Engagement Solutions Industry Volume K Unit Forecast, by Country 2019 & 2032
- Table 37: China Interactive Patient Engagement Solutions Industry Revenue (Million) Forecast, by Application 2019 & 2032
- Table 38: China Interactive Patient Engagement Solutions Industry Volume (K Unit) Forecast, by Application 2019 & 2032
- Table 39: Japan Interactive Patient Engagement Solutions Industry Revenue (Million) Forecast, by Application 2019 & 2032
- Table 40: Japan Interactive Patient Engagement Solutions Industry Volume (K Unit) Forecast, by Application 2019 & 2032
- Table 41: India Interactive Patient Engagement Solutions Industry Revenue (Million) Forecast, by Application 2019 & 2032
- Table 42: India Interactive Patient Engagement Solutions Industry Volume (K Unit) Forecast, by Application 2019 & 2032
- Table 43: Australia Interactive Patient Engagement Solutions Industry Revenue (Million) Forecast, by Application 2019 & 2032
- Table 44: Australia Interactive Patient Engagement Solutions Industry Volume (K Unit) Forecast, by Application 2019 & 2032
- Table 45: South Korea Interactive Patient Engagement Solutions Industry Revenue (Million) Forecast, by Application 2019 & 2032
- Table 46: South Korea Interactive Patient Engagement Solutions Industry Volume (K Unit) Forecast, by Application 2019 & 2032
- Table 47: Rest of Asia Pacific Interactive Patient Engagement Solutions Industry Revenue (Million) Forecast, by Application 2019 & 2032
- Table 48: Rest of Asia Pacific Interactive Patient Engagement Solutions Industry Volume (K Unit) Forecast, by Application 2019 & 2032
- Table 49: Global Interactive Patient Engagement Solutions Industry Revenue Million Forecast, by Country 2019 & 2032
- Table 50: Global Interactive Patient Engagement Solutions Industry Volume K Unit Forecast, by Country 2019 & 2032
- Table 51: GCC Interactive Patient Engagement Solutions Industry Revenue (Million) Forecast, by Application 2019 & 2032
- Table 52: GCC Interactive Patient Engagement Solutions Industry Volume (K Unit) Forecast, by Application 2019 & 2032
- Table 53: South Africa Interactive Patient Engagement Solutions Industry Revenue (Million) Forecast, by Application 2019 & 2032
- Table 54: South Africa Interactive Patient Engagement Solutions Industry Volume (K Unit) Forecast, by Application 2019 & 2032
- Table 55: Rest of Middle East and Africa Interactive Patient Engagement Solutions Industry Revenue (Million) Forecast, by Application 2019 & 2032
- Table 56: Rest of Middle East and Africa Interactive Patient Engagement Solutions Industry Volume (K Unit) Forecast, by Application 2019 & 2032
- Table 57: Global Interactive Patient Engagement Solutions Industry Revenue Million Forecast, by Country 2019 & 2032
- Table 58: Global Interactive Patient Engagement Solutions Industry Volume K Unit Forecast, by Country 2019 & 2032
- Table 59: Brazil Interactive Patient Engagement Solutions Industry Revenue (Million) Forecast, by Application 2019 & 2032
- Table 60: Brazil Interactive Patient Engagement Solutions Industry Volume (K Unit) Forecast, by Application 2019 & 2032
- Table 61: Argentina Interactive Patient Engagement Solutions Industry Revenue (Million) Forecast, by Application 2019 & 2032
- Table 62: Argentina Interactive Patient Engagement Solutions Industry Volume (K Unit) Forecast, by Application 2019 & 2032
- Table 63: Rest of South America Interactive Patient Engagement Solutions Industry Revenue (Million) Forecast, by Application 2019 & 2032
- Table 64: Rest of South America Interactive Patient Engagement Solutions Industry Volume (K Unit) Forecast, by Application 2019 & 2032
- Table 65: Global Interactive Patient Engagement Solutions Industry Revenue Million Forecast, by Component 2019 & 2032
- Table 66: Global Interactive Patient Engagement Solutions Industry Volume K Unit Forecast, by Component 2019 & 2032
- Table 67: Global Interactive Patient Engagement Solutions Industry Revenue Million Forecast, by Delivery Mode 2019 & 2032
- Table 68: Global Interactive Patient Engagement Solutions Industry Volume K Unit Forecast, by Delivery Mode 2019 & 2032
- Table 69: Global Interactive Patient Engagement Solutions Industry Revenue Million Forecast, by Application 2019 & 2032
- Table 70: Global Interactive Patient Engagement Solutions Industry Volume K Unit Forecast, by Application 2019 & 2032
- Table 71: Global Interactive Patient Engagement Solutions Industry Revenue Million Forecast, by End User 2019 & 2032
- Table 72: Global Interactive Patient Engagement Solutions Industry Volume K Unit Forecast, by End User 2019 & 2032
- Table 73: Global Interactive Patient Engagement Solutions Industry Revenue Million Forecast, by Country 2019 & 2032
- Table 74: Global Interactive Patient Engagement Solutions Industry Volume K Unit Forecast, by Country 2019 & 2032
- Table 75: United States Interactive Patient Engagement Solutions Industry Revenue (Million) Forecast, by Application 2019 & 2032
- Table 76: United States Interactive Patient Engagement Solutions Industry Volume (K Unit) Forecast, by Application 2019 & 2032
- Table 77: Canada Interactive Patient Engagement Solutions Industry Revenue (Million) Forecast, by Application 2019 & 2032
- Table 78: Canada Interactive Patient Engagement Solutions Industry Volume (K Unit) Forecast, by Application 2019 & 2032
- Table 79: Mexico Interactive Patient Engagement Solutions Industry Revenue (Million) Forecast, by Application 2019 & 2032
- Table 80: Mexico Interactive Patient Engagement Solutions Industry Volume (K Unit) Forecast, by Application 2019 & 2032
- Table 81: Global Interactive Patient Engagement Solutions Industry Revenue Million Forecast, by Component 2019 & 2032
- Table 82: Global Interactive Patient Engagement Solutions Industry Volume K Unit Forecast, by Component 2019 & 2032
- Table 83: Global Interactive Patient Engagement Solutions Industry Revenue Million Forecast, by Delivery Mode 2019 & 2032
- Table 84: Global Interactive Patient Engagement Solutions Industry Volume K Unit Forecast, by Delivery Mode 2019 & 2032
- Table 85: Global Interactive Patient Engagement Solutions Industry Revenue Million Forecast, by Application 2019 & 2032
- Table 86: Global Interactive Patient Engagement Solutions Industry Volume K Unit Forecast, by Application 2019 & 2032
- Table 87: Global Interactive Patient Engagement Solutions Industry Revenue Million Forecast, by End User 2019 & 2032
- Table 88: Global Interactive Patient Engagement Solutions Industry Volume K Unit Forecast, by End User 2019 & 2032
- Table 89: Global Interactive Patient Engagement Solutions Industry Revenue Million Forecast, by Country 2019 & 2032
- Table 90: Global Interactive Patient Engagement Solutions Industry Volume K Unit Forecast, by Country 2019 & 2032
- Table 91: Germany Interactive Patient Engagement Solutions Industry Revenue (Million) Forecast, by Application 2019 & 2032
- Table 92: Germany Interactive Patient Engagement Solutions Industry Volume (K Unit) Forecast, by Application 2019 & 2032
- Table 93: United Kingdom Interactive Patient Engagement Solutions Industry Revenue (Million) Forecast, by Application 2019 & 2032
- Table 94: United Kingdom Interactive Patient Engagement Solutions Industry Volume (K Unit) Forecast, by Application 2019 & 2032
- Table 95: France Interactive Patient Engagement Solutions Industry Revenue (Million) Forecast, by Application 2019 & 2032
- Table 96: France Interactive Patient Engagement Solutions Industry Volume (K Unit) Forecast, by Application 2019 & 2032
- Table 97: Italy Interactive Patient Engagement Solutions Industry Revenue (Million) Forecast, by Application 2019 & 2032
- Table 98: Italy Interactive Patient Engagement Solutions Industry Volume (K Unit) Forecast, by Application 2019 & 2032
- Table 99: Spain Interactive Patient Engagement Solutions Industry Revenue (Million) Forecast, by Application 2019 & 2032
- Table 100: Spain Interactive Patient Engagement Solutions Industry Volume (K Unit) Forecast, by Application 2019 & 2032
- Table 101: Rest of Europe Interactive Patient Engagement Solutions Industry Revenue (Million) Forecast, by Application 2019 & 2032
- Table 102: Rest of Europe Interactive Patient Engagement Solutions Industry Volume (K Unit) Forecast, by Application 2019 & 2032
- Table 103: Global Interactive Patient Engagement Solutions Industry Revenue Million Forecast, by Component 2019 & 2032
- Table 104: Global Interactive Patient Engagement Solutions Industry Volume K Unit Forecast, by Component 2019 & 2032
- Table 105: Global Interactive Patient Engagement Solutions Industry Revenue Million Forecast, by Delivery Mode 2019 & 2032
- Table 106: Global Interactive Patient Engagement Solutions Industry Volume K Unit Forecast, by Delivery Mode 2019 & 2032
- Table 107: Global Interactive Patient Engagement Solutions Industry Revenue Million Forecast, by Application 2019 & 2032
- Table 108: Global Interactive Patient Engagement Solutions Industry Volume K Unit Forecast, by Application 2019 & 2032
- Table 109: Global Interactive Patient Engagement Solutions Industry Revenue Million Forecast, by End User 2019 & 2032
- Table 110: Global Interactive Patient Engagement Solutions Industry Volume K Unit Forecast, by End User 2019 & 2032
- Table 111: Global Interactive Patient Engagement Solutions Industry Revenue Million Forecast, by Country 2019 & 2032
- Table 112: Global Interactive Patient Engagement Solutions Industry Volume K Unit Forecast, by Country 2019 & 2032
- Table 113: China Interactive Patient Engagement Solutions Industry Revenue (Million) Forecast, by Application 2019 & 2032
- Table 114: China Interactive Patient Engagement Solutions Industry Volume (K Unit) Forecast, by Application 2019 & 2032
- Table 115: Japan Interactive Patient Engagement Solutions Industry Revenue (Million) Forecast, by Application 2019 & 2032
- Table 116: Japan Interactive Patient Engagement Solutions Industry Volume (K Unit) Forecast, by Application 2019 & 2032
- Table 117: India Interactive Patient Engagement Solutions Industry Revenue (Million) Forecast, by Application 2019 & 2032
- Table 118: India Interactive Patient Engagement Solutions Industry Volume (K Unit) Forecast, by Application 2019 & 2032
- Table 119: Australia Interactive Patient Engagement Solutions Industry Revenue (Million) Forecast, by Application 2019 & 2032
- Table 120: Australia Interactive Patient Engagement Solutions Industry Volume (K Unit) Forecast, by Application 2019 & 2032
- Table 121: South Korea Interactive Patient Engagement Solutions Industry Revenue (Million) Forecast, by Application 2019 & 2032
- Table 122: South Korea Interactive Patient Engagement Solutions Industry Volume (K Unit) Forecast, by Application 2019 & 2032
- Table 123: Rest of Asia Pacific Interactive Patient Engagement Solutions Industry Revenue (Million) Forecast, by Application 2019 & 2032
- Table 124: Rest of Asia Pacific Interactive Patient Engagement Solutions Industry Volume (K Unit) Forecast, by Application 2019 & 2032
- Table 125: Global Interactive Patient Engagement Solutions Industry Revenue Million Forecast, by Component 2019 & 2032
- Table 126: Global Interactive Patient Engagement Solutions Industry Volume K Unit Forecast, by Component 2019 & 2032
- Table 127: Global Interactive Patient Engagement Solutions Industry Revenue Million Forecast, by Delivery Mode 2019 & 2032
- Table 128: Global Interactive Patient Engagement Solutions Industry Volume K Unit Forecast, by Delivery Mode 2019 & 2032
- Table 129: Global Interactive Patient Engagement Solutions Industry Revenue Million Forecast, by Application 2019 & 2032
- Table 130: Global Interactive Patient Engagement Solutions Industry Volume K Unit Forecast, by Application 2019 & 2032
- Table 131: Global Interactive Patient Engagement Solutions Industry Revenue Million Forecast, by End User 2019 & 2032
- Table 132: Global Interactive Patient Engagement Solutions Industry Volume K Unit Forecast, by End User 2019 & 2032
- Table 133: Global Interactive Patient Engagement Solutions Industry Revenue Million Forecast, by Country 2019 & 2032
- Table 134: Global Interactive Patient Engagement Solutions Industry Volume K Unit Forecast, by Country 2019 & 2032
- Table 135: GCC Interactive Patient Engagement Solutions Industry Revenue (Million) Forecast, by Application 2019 & 2032
- Table 136: GCC Interactive Patient Engagement Solutions Industry Volume (K Unit) Forecast, by Application 2019 & 2032
- Table 137: South Africa Interactive Patient Engagement Solutions Industry Revenue (Million) Forecast, by Application 2019 & 2032
- Table 138: South Africa Interactive Patient Engagement Solutions Industry Volume (K Unit) Forecast, by Application 2019 & 2032
- Table 139: Rest of Middle East and Africa Interactive Patient Engagement Solutions Industry Revenue (Million) Forecast, by Application 2019 & 2032
- Table 140: Rest of Middle East and Africa Interactive Patient Engagement Solutions Industry Volume (K Unit) Forecast, by Application 2019 & 2032
- Table 141: Global Interactive Patient Engagement Solutions Industry Revenue Million Forecast, by Component 2019 & 2032
- Table 142: Global Interactive Patient Engagement Solutions Industry Volume K Unit Forecast, by Component 2019 & 2032
- Table 143: Global Interactive Patient Engagement Solutions Industry Revenue Million Forecast, by Delivery Mode 2019 & 2032
- Table 144: Global Interactive Patient Engagement Solutions Industry Volume K Unit Forecast, by Delivery Mode 2019 & 2032
- Table 145: Global Interactive Patient Engagement Solutions Industry Revenue Million Forecast, by Application 2019 & 2032
- Table 146: Global Interactive Patient Engagement Solutions Industry Volume K Unit Forecast, by Application 2019 & 2032
- Table 147: Global Interactive Patient Engagement Solutions Industry Revenue Million Forecast, by End User 2019 & 2032
- Table 148: Global Interactive Patient Engagement Solutions Industry Volume K Unit Forecast, by End User 2019 & 2032
- Table 149: Global Interactive Patient Engagement Solutions Industry Revenue Million Forecast, by Country 2019 & 2032
- Table 150: Global Interactive Patient Engagement Solutions Industry Volume K Unit Forecast, by Country 2019 & 2032
- Table 151: Brazil Interactive Patient Engagement Solutions Industry Revenue (Million) Forecast, by Application 2019 & 2032
- Table 152: Brazil Interactive Patient Engagement Solutions Industry Volume (K Unit) Forecast, by Application 2019 & 2032
- Table 153: Argentina Interactive Patient Engagement Solutions Industry Revenue (Million) Forecast, by Application 2019 & 2032
- Table 154: Argentina Interactive Patient Engagement Solutions Industry Volume (K Unit) Forecast, by Application 2019 & 2032
- Table 155: Rest of South America Interactive Patient Engagement Solutions Industry Revenue (Million) Forecast, by Application 2019 & 2032
- Table 156: Rest of South America Interactive Patient Engagement Solutions Industry Volume (K Unit) Forecast, by Application 2019 & 2032
Frequently Asked Questions
1. What is the projected Compound Annual Growth Rate (CAGR) of the Interactive Patient Engagement Solutions Industry?
The projected CAGR is approximately 14.38%.
2. Which companies are prominent players in the Interactive Patient Engagement Solutions Industry?
Key companies in the market include Athenahealth Inc, MEDHOST, Mckesson Corporation, Medecision Inc, GetWellNetwork Inc, Orion Health Ltd, Cerner Corporation, Welvu, Lincor Solutions, Yourcareuniverse Inc , Allscripts Healthcare Solutions Inc, IBM.
3. What are the main segments of the Interactive Patient Engagement Solutions Industry?
The market segments include Component, Delivery Mode, Application, End User.
4. Can you provide details about the market size?
The market size is estimated to be USD 24.00 Million as of 2022.
5. What are some drivers contributing to market growth?
Rising Trend of Mobile Health Applications; Growing Popularity of Patient Engagement Solutions Among the Aging Population; Rising Investments and Technological advancements.
6. What are the notable trends driving market growth?
Web-based and Cloud-based Services Segment is Expected to Witness Growth Over the Forecast Period.
7. Are there any restraints impacting market growth?
Protection of Patient Information; Lack of Skilled IT Professionals in the Healthcare Industry.
8. Can you provide examples of recent developments in the market?
In March 2022, DeliverHealth launched its partner program. DeliverHealth program supports strategic partners within the eco-system, growing sales domestically and internationally while enabling healthcare organizations to simplify the daily complexities of healthcare, improve patient outcomes and reduce overall costs.
9. What pricing options are available for accessing the report?
Pricing options include single-user, multi-user, and enterprise licenses priced at USD 4750, USD 5250, and USD 8750 respectively.
10. Is the market size provided in terms of value or volume?
The market size is provided in terms of value, measured in Million and volume, measured in K Unit.
11. Are there any specific market keywords associated with the report?
Yes, the market keyword associated with the report is "Interactive Patient Engagement Solutions Industry," which aids in identifying and referencing the specific market segment covered.
12. How do I determine which pricing option suits my needs best?
The pricing options vary based on user requirements and access needs. Individual users may opt for single-user licenses, while businesses requiring broader access may choose multi-user or enterprise licenses for cost-effective access to the report.
13. Are there any additional resources or data provided in the Interactive Patient Engagement Solutions Industry report?
While the report offers comprehensive insights, it's advisable to review the specific contents or supplementary materials provided to ascertain if additional resources or data are available.
14. How can I stay updated on further developments or reports in the Interactive Patient Engagement Solutions Industry?
To stay informed about further developments, trends, and reports in the Interactive Patient Engagement Solutions Industry, consider subscribing to industry newsletters, following relevant companies and organizations, or regularly checking reputable industry news sources and publications.
Methodology
Step 1 - Identification of Relevant Samples Size from Population Database


Step 2 - Approaches for Defining Global Market Size (Value, Volume* & Price*)

Note*: In applicable scenarios
Step 3 - Data Sources
Primary Research
- Web Analytics
- Survey Reports
- Research Institute
- Latest Research Reports
- Opinion Leaders
Secondary Research
- Annual Reports
- White Paper
- Latest Press Release
- Industry Association
- Paid Database
- Investor Presentations

Step 4 - Data Triangulation
Involves using different sources of information in order to increase the validity of a study
These sources are likely to be stakeholders in a program - participants, other researchers, program staff, other community members, and so on.
Then we put all data in single framework & apply various statistical tools to find out the dynamic on the market.
During the analysis stage, feedback from the stakeholder groups would be compared to determine areas of agreement as well as areas of divergence


