
Key Insights
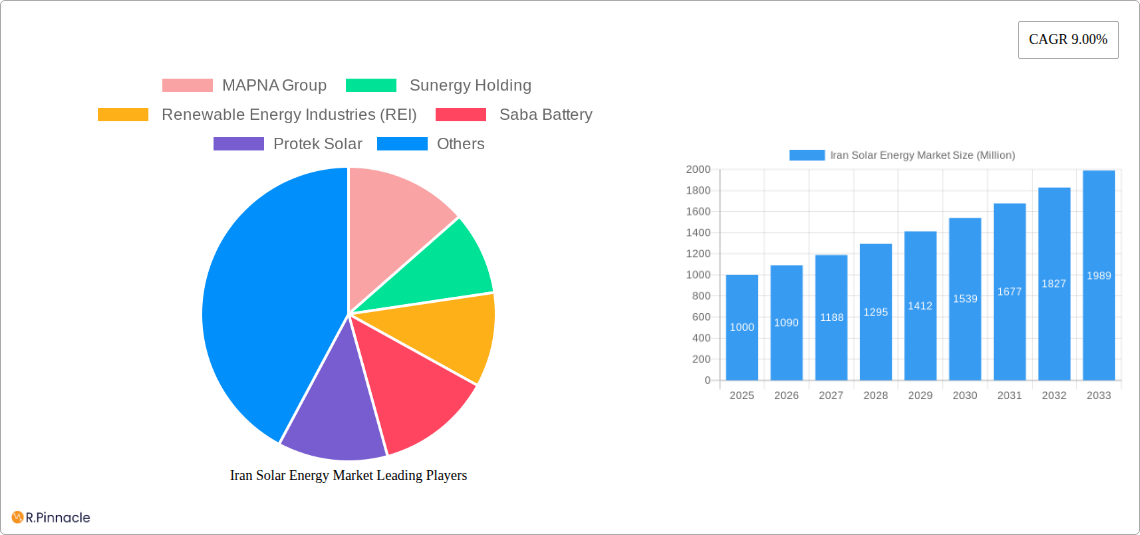
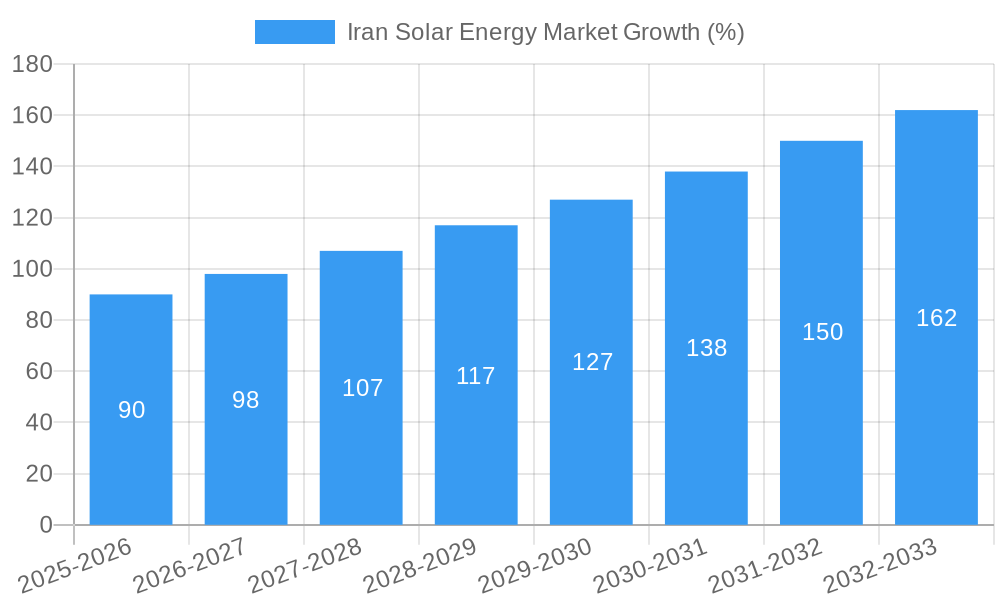
The Iranian solar energy market, exhibiting a robust Compound Annual Growth Rate (CAGR) of 9%, presents a compelling investment opportunity. The market's expansion is driven by several key factors. Firstly, Iran's vast solar irradiance potential, particularly in the sunny southern and eastern regions, provides a significant resource for renewable energy generation. Secondly, the government's increasing commitment to diversifying its energy sources and reducing reliance on fossil fuels is fueling substantial investments in solar power infrastructure. This is evidenced by government initiatives promoting solar energy adoption, providing financial incentives, and streamlining permitting processes. Furthermore, the decreasing cost of solar photovoltaic (PV) technology globally translates to lower installation costs in Iran, making solar energy increasingly competitive with traditional energy sources. The market is segmented into automotive, industrial, portable, and other applications, with significant potential across all sectors. While challenges such as grid integration and financing remain, the overall positive trajectory indicates significant growth prospects.
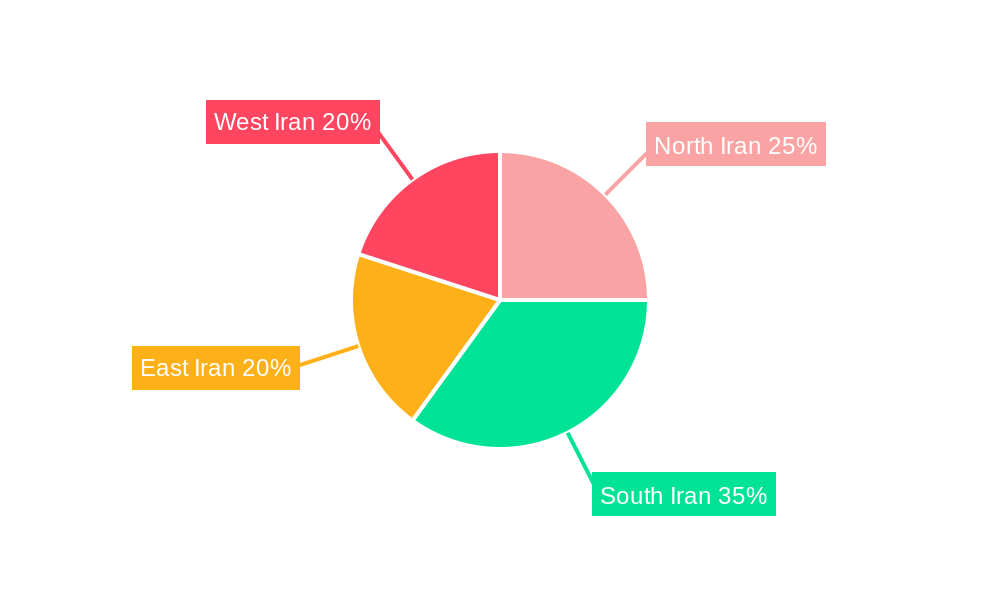
Despite the promising market outlook, several factors act as restraints. The fluctuating global prices of raw materials for solar panel manufacturing and the overall economic climate in Iran can influence project timelines and investment decisions. Furthermore, the development of a robust and reliable national grid capable of handling the increased influx of solar power requires continued investment and upgrades. Nevertheless, the long-term potential for growth outweighs these challenges, particularly given the strong government support and technological advancements expected over the forecast period (2025-2033). Key players such as MAPNA Group, Sunergy Holding, Renewable Energy Industries (REI), Saba Battery, and Protek Solar are well-positioned to capitalize on this expansion, contributing significantly to Iran's renewable energy transition. The regional distribution of solar energy projects across North, South, East, and West Iran will ensure balanced development and optimal utilization of resources.
Iran Solar Energy Market Report: 2019-2033 Forecast
This comprehensive report provides an in-depth analysis of the Iranian solar energy market, offering invaluable insights for industry professionals, investors, and policymakers. Covering the period 2019-2033, with a focus on 2025, this report unveils the market's structure, dynamics, dominant segments, and future outlook. Benefit from detailed analysis of key players, technological advancements, and emerging opportunities in this rapidly expanding sector. Discover actionable strategies to navigate the unique challenges and capitalize on the significant potential of the Iranian solar energy market.
Iran Solar Energy Market Structure & Innovation Trends
This section analyzes the competitive landscape of Iran's solar energy market, focusing on market concentration, innovation drivers, regulatory frameworks, and M&A activities. The market exhibits a moderately concentrated structure with key players like MAPNA Group, Sunergy Holding, Renewable Energy Industries (REI), Saba Battery, and Protek Solar holding significant market share. However, the market is experiencing an influx of smaller players, increasing competition. Innovation is driven by government initiatives promoting renewable energy adoption and the need for energy independence. The regulatory framework, while evolving, still presents challenges. Product substitution is limited due to the nascent nature of other renewable energy sources, though there is some competitiveness from fossil fuel-based energy. End-user demographics primarily comprise industrial and utility sectors. M&A activity has been relatively low in recent years, with estimated deal values totaling xx Million during the historical period, reflecting a consolidating market with limited large-scale acquisitions.
- Market Share: MAPNA Group holds an estimated xx% market share, followed by Sunergy Holding at xx%, and REI at xx%. Smaller players collectively hold the remaining share.
- M&A Deal Values (2019-2024): xx Million
- Regulatory Framework: Characterized by a mix of supportive policies and bureaucratic hurdles.
Iran Solar Energy Market Dynamics & Trends
The Iranian solar energy market is experiencing robust growth, driven by factors such as increasing energy demand, government support for renewable energy, and declining solar technology costs. The market's CAGR from 2019 to 2024 is estimated at xx%, and the market penetration rate is projected to reach xx% by 2033. Technological advancements, particularly in photovoltaic (PV) technology, are further fueling market expansion. Consumer preferences are shifting towards cleaner and more sustainable energy sources, creating a growing demand for solar energy solutions. Competitive dynamics are intense, with both established players and new entrants vying for market share.
Dominant Regions & Segments in Iran Solar Energy Market
The industrial sector currently dominates the Iranian solar energy market, driven by the government's push for industrial energy efficiency and its focus on developing renewable energy sources for large industrial facilities. The automotive segment shows promising future growth, but remains relatively small, largely due to limited electric vehicle adoption. The portable segment is a niche market currently experiencing slow growth. The 'Other Applications' segment includes agricultural, residential, and commercial sectors, each demonstrating unique growth trajectories.
- Key Drivers for Industrial Segment Dominance:
- Government incentives and subsidies for industrial solar adoption.
- High energy consumption in industrial processes.
- Large-scale projects supporting solar energy installations in industrial zones.
- Geographic Distribution: While data is limited, preliminary analysis suggests that provinces with high industrial concentrations and strong sunlight hours are the leading regions for solar energy adoption.
Iran Solar Energy Market Product Innovations
Recent innovations in the Iranian solar energy market include advancements in PV technology, particularly focusing on efficiency improvements and cost reductions. The introduction of more durable and efficient solar panels, coupled with improved energy storage solutions, is enhancing the attractiveness of solar energy systems. These innovations are improving market fit by addressing challenges related to reliability and affordability. A focus on locally manufactured components is also reducing reliance on imports and improving the affordability of solar energy solutions for consumers and businesses.
Report Scope & Segmentation Analysis
The report segments the Iranian solar energy market by application: Automotive, Industrial, Portable, and Other Applications. The Industrial segment is projected to maintain its dominance throughout the forecast period, showing a CAGR of xx% from 2025-2033. The Automotive segment, while smaller, is anticipated to show significant growth due to government support for electric vehicles (xx% CAGR). The Portable and Other Applications segments offer niche market opportunities but face various challenges. Competitive dynamics within each segment are influenced by factors such as technological innovation, pricing strategies, and government policies.
Key Drivers of Iran Solar Energy Market Growth
The Iranian solar energy market’s growth is propelled by several key factors:
- Government Support: Subsidies, tax breaks, and feed-in tariffs incentivize solar energy adoption.
- Technological Advancements: Improved PV cell efficiency and reduced costs are boosting competitiveness.
- Energy Security Concerns: Reducing reliance on imported fossil fuels is a major driving force.
- Environmental Concerns: Growing awareness of climate change promotes renewable energy solutions.
Challenges in the Iran Solar Energy Market Sector
Despite its significant potential, the Iranian solar energy market faces considerable challenges:
- Sanctions: International sanctions impact access to foreign technology and financing.
- Grid Infrastructure: Limited grid capacity and reliability hinder wider solar integration.
- Financing Constraints: Securing funding for large-scale projects remains a significant hurdle.
- Bureaucracy: Navigating complex regulatory processes can delay project implementation. This results in an estimated xx Million in lost investment opportunities annually.
Emerging Opportunities in Iran Solar Energy Market
Significant opportunities exist in the Iranian solar energy market:
- Off-grid Solutions: Providing solar power to remote and underserved areas.
- Agrivoltaics: Integrating solar panels into agricultural land.
- Energy Storage: Developing advanced battery storage systems to improve grid stability.
- Local Manufacturing: Growth of domestic solar panel production and supply chain development.
Leading Players in the Iran Solar Energy Market Market
- MAPNA Group
- Sunergy Holding
- Renewable Energy Industries (REI)
- Saba Battery
- Protek Solar
Key Developments in Iran Solar Energy Market Industry
- July 2022: Inauguration of Iran's first solar panel manufacturing plant in Khomein City with an initial capacity of 500 MW, expandable to 1.5 GW. This significantly boosts domestic production and reduces reliance on imports.
- January 2023: Submission of a bill to parliament seeking approval for the International Solar Alliance (ISA) membership. This indicates a commitment to international collaboration and the adoption of best practices in solar energy deployment.
Future Outlook for Iran Solar Energy Market Market
The Iranian solar energy market is poised for significant growth over the forecast period. Government initiatives, technological advancements, and increasing environmental awareness will continue to drive market expansion. Opportunities exist for both domestic and international players to capitalize on the substantial untapped potential within the country. Strategic partnerships, technological innovation, and overcoming existing challenges are key to realizing the full potential of Iran's solar energy sector. Market size is projected to reach xx Million by 2033.
Iran Solar Energy Market Segmentation
- 1. Production Analysis
- 2. Consumption Analysis
- 3. Import Market Analysis (Value & Volume)
- 4. Export Market Analysis (Value & Volume)
- 5. Price Trend Analysis
Iran Solar Energy Market Segmentation By Geography
- 1. Iran
Iran Solar Energy Market REPORT HIGHLIGHTS
| Aspects | Details |
|---|---|
| Study Period | 2019-2033 |
| Base Year | 2024 |
| Estimated Year | 2025 |
| Forecast Period | 2025-2033 |
| Historical Period | 2019-2024 |
| Growth Rate | CAGR of 9.00% from 2019-2033 |
| Segmentation |
|
Table of Contents
- 1. Introduction
- 1.1. Research Scope
- 1.2. Market Segmentation
- 1.3. Research Methodology
- 1.4. Definitions and Assumptions
- 2. Executive Summary
- 2.1. Introduction
- 3. Market Dynamics
- 3.1. Introduction
- 3.2. Market Drivers
- 3.2.1. 4.; Growing Power Demand4.; Growth of Renewables
- 3.3. Market Restrains
- 3.3.1. 4.; Unstable Political Scenario of the Country
- 3.4. Market Trends
- 3.4.1. Solar Photovoltaic (PV) to Dominate the Market
- 4. Market Factor Analysis
- 4.1. Porters Five Forces
- 4.2. Supply/Value Chain
- 4.3. PESTEL analysis
- 4.4. Market Entropy
- 4.5. Patent/Trademark Analysis
- 5. Iran Solar Energy Market Analysis, Insights and Forecast, 2019-2031
- 5.1. Market Analysis, Insights and Forecast - by Production Analysis
- 5.2. Market Analysis, Insights and Forecast - by Consumption Analysis
- 5.3. Market Analysis, Insights and Forecast - by Import Market Analysis (Value & Volume)
- 5.4. Market Analysis, Insights and Forecast - by Export Market Analysis (Value & Volume)
- 5.5. Market Analysis, Insights and Forecast - by Price Trend Analysis
- 5.6. Market Analysis, Insights and Forecast - by Region
- 5.6.1. Iran
- 5.1. Market Analysis, Insights and Forecast - by Production Analysis
- 6. North Iran Solar Energy Market Analysis, Insights and Forecast, 2019-2031
- 7. South Iran Solar Energy Market Analysis, Insights and Forecast, 2019-2031
- 8. East Iran Solar Energy Market Analysis, Insights and Forecast, 2019-2031
- 9. West Iran Solar Energy Market Analysis, Insights and Forecast, 2019-2031
- 10. Competitive Analysis
- 10.1. Market Share Analysis 2024
- 10.2. Company Profiles
- 10.2.1 MAPNA Group
- 10.2.1.1. Overview
- 10.2.1.2. Products
- 10.2.1.3. SWOT Analysis
- 10.2.1.4. Recent Developments
- 10.2.1.5. Financials (Based on Availability)
- 10.2.2 Sunergy Holding
- 10.2.2.1. Overview
- 10.2.2.2. Products
- 10.2.2.3. SWOT Analysis
- 10.2.2.4. Recent Developments
- 10.2.2.5. Financials (Based on Availability)
- 10.2.3 Renewable Energy Industries (REI)
- 10.2.3.1. Overview
- 10.2.3.2. Products
- 10.2.3.3. SWOT Analysis
- 10.2.3.4. Recent Developments
- 10.2.3.5. Financials (Based on Availability)
- 10.2.4 Saba Battery
- 10.2.4.1. Overview
- 10.2.4.2. Products
- 10.2.4.3. SWOT Analysis
- 10.2.4.4. Recent Developments
- 10.2.4.5. Financials (Based on Availability)
- 10.2.5 Protek Solar
- 10.2.5.1. Overview
- 10.2.5.2. Products
- 10.2.5.3. SWOT Analysis
- 10.2.5.4. Recent Developments
- 10.2.5.5. Financials (Based on Availability)
- 10.2.1 MAPNA Group
List of Figures
- Figure 1: Iran Solar Energy Market Revenue Breakdown (Million, %) by Product 2024 & 2032
- Figure 2: Iran Solar Energy Market Share (%) by Company 2024
List of Tables
- Table 1: Iran Solar Energy Market Revenue Million Forecast, by Region 2019 & 2032
- Table 2: Iran Solar Energy Market Volume watts per unit volume Forecast, by Region 2019 & 2032
- Table 3: Iran Solar Energy Market Revenue Million Forecast, by Production Analysis 2019 & 2032
- Table 4: Iran Solar Energy Market Volume watts per unit volume Forecast, by Production Analysis 2019 & 2032
- Table 5: Iran Solar Energy Market Revenue Million Forecast, by Consumption Analysis 2019 & 2032
- Table 6: Iran Solar Energy Market Volume watts per unit volume Forecast, by Consumption Analysis 2019 & 2032
- Table 7: Iran Solar Energy Market Revenue Million Forecast, by Import Market Analysis (Value & Volume) 2019 & 2032
- Table 8: Iran Solar Energy Market Volume watts per unit volume Forecast, by Import Market Analysis (Value & Volume) 2019 & 2032
- Table 9: Iran Solar Energy Market Revenue Million Forecast, by Export Market Analysis (Value & Volume) 2019 & 2032
- Table 10: Iran Solar Energy Market Volume watts per unit volume Forecast, by Export Market Analysis (Value & Volume) 2019 & 2032
- Table 11: Iran Solar Energy Market Revenue Million Forecast, by Price Trend Analysis 2019 & 2032
- Table 12: Iran Solar Energy Market Volume watts per unit volume Forecast, by Price Trend Analysis 2019 & 2032
- Table 13: Iran Solar Energy Market Revenue Million Forecast, by Region 2019 & 2032
- Table 14: Iran Solar Energy Market Volume watts per unit volume Forecast, by Region 2019 & 2032
- Table 15: Iran Solar Energy Market Revenue Million Forecast, by Country 2019 & 2032
- Table 16: Iran Solar Energy Market Volume watts per unit volume Forecast, by Country 2019 & 2032
- Table 17: North Iran Solar Energy Market Revenue (Million) Forecast, by Application 2019 & 2032
- Table 18: North Iran Solar Energy Market Volume (watts per unit volume) Forecast, by Application 2019 & 2032
- Table 19: South Iran Solar Energy Market Revenue (Million) Forecast, by Application 2019 & 2032
- Table 20: South Iran Solar Energy Market Volume (watts per unit volume) Forecast, by Application 2019 & 2032
- Table 21: East Iran Solar Energy Market Revenue (Million) Forecast, by Application 2019 & 2032
- Table 22: East Iran Solar Energy Market Volume (watts per unit volume) Forecast, by Application 2019 & 2032
- Table 23: West Iran Solar Energy Market Revenue (Million) Forecast, by Application 2019 & 2032
- Table 24: West Iran Solar Energy Market Volume (watts per unit volume) Forecast, by Application 2019 & 2032
- Table 25: Iran Solar Energy Market Revenue Million Forecast, by Production Analysis 2019 & 2032
- Table 26: Iran Solar Energy Market Volume watts per unit volume Forecast, by Production Analysis 2019 & 2032
- Table 27: Iran Solar Energy Market Revenue Million Forecast, by Consumption Analysis 2019 & 2032
- Table 28: Iran Solar Energy Market Volume watts per unit volume Forecast, by Consumption Analysis 2019 & 2032
- Table 29: Iran Solar Energy Market Revenue Million Forecast, by Import Market Analysis (Value & Volume) 2019 & 2032
- Table 30: Iran Solar Energy Market Volume watts per unit volume Forecast, by Import Market Analysis (Value & Volume) 2019 & 2032
- Table 31: Iran Solar Energy Market Revenue Million Forecast, by Export Market Analysis (Value & Volume) 2019 & 2032
- Table 32: Iran Solar Energy Market Volume watts per unit volume Forecast, by Export Market Analysis (Value & Volume) 2019 & 2032
- Table 33: Iran Solar Energy Market Revenue Million Forecast, by Price Trend Analysis 2019 & 2032
- Table 34: Iran Solar Energy Market Volume watts per unit volume Forecast, by Price Trend Analysis 2019 & 2032
- Table 35: Iran Solar Energy Market Revenue Million Forecast, by Country 2019 & 2032
- Table 36: Iran Solar Energy Market Volume watts per unit volume Forecast, by Country 2019 & 2032
Frequently Asked Questions
1. What is the projected Compound Annual Growth Rate (CAGR) of the Iran Solar Energy Market?
The projected CAGR is approximately 9.00%.
2. Which companies are prominent players in the Iran Solar Energy Market?
Key companies in the market include MAPNA Group , Sunergy Holding , Renewable Energy Industries (REI) , Saba Battery , Protek Solar.
3. What are the main segments of the Iran Solar Energy Market?
The market segments include Production Analysis, Consumption Analysis, Import Market Analysis (Value & Volume), Export Market Analysis (Value & Volume), Price Trend Analysis.
4. Can you provide details about the market size?
The market size is estimated to be USD XX Million as of 2022.
5. What are some drivers contributing to market growth?
4.; Growing Power Demand4.; Growth of Renewables.
6. What are the notable trends driving market growth?
Solar Photovoltaic (PV) to Dominate the Market.
7. Are there any restraints impacting market growth?
4.; Unstable Political Scenario of the Country.
8. Can you provide examples of recent developments in the market?
January 2023: Iranian authorities submitted a bill to parliament seeking approval for the International Solar Alliance. The International Solar Alliance (ISA) is an action-oriented platform that members drive and that promotes increased deployment of solar energy technologies, in addition to ensuring energy accessibility and security.
9. What pricing options are available for accessing the report?
Pricing options include single-user, multi-user, and enterprise licenses priced at USD 3800, USD 4500, and USD 5800 respectively.
10. Is the market size provided in terms of value or volume?
The market size is provided in terms of value, measured in Million and volume, measured in watts per unit volume.
11. Are there any specific market keywords associated with the report?
Yes, the market keyword associated with the report is "Iran Solar Energy Market," which aids in identifying and referencing the specific market segment covered.
12. How do I determine which pricing option suits my needs best?
The pricing options vary based on user requirements and access needs. Individual users may opt for single-user licenses, while businesses requiring broader access may choose multi-user or enterprise licenses for cost-effective access to the report.
13. Are there any additional resources or data provided in the Iran Solar Energy Market report?
While the report offers comprehensive insights, it's advisable to review the specific contents or supplementary materials provided to ascertain if additional resources or data are available.
14. How can I stay updated on further developments or reports in the Iran Solar Energy Market?
To stay informed about further developments, trends, and reports in the Iran Solar Energy Market, consider subscribing to industry newsletters, following relevant companies and organizations, or regularly checking reputable industry news sources and publications.
Methodology
Step 1 - Identification of Relevant Samples Size from Population Database


Step 2 - Approaches for Defining Global Market Size (Value, Volume* & Price*)

Note*: In applicable scenarios
Step 3 - Data Sources
Primary Research
- Web Analytics
- Survey Reports
- Research Institute
- Latest Research Reports
- Opinion Leaders
Secondary Research
- Annual Reports
- White Paper
- Latest Press Release
- Industry Association
- Paid Database
- Investor Presentations

Step 4 - Data Triangulation
Involves using different sources of information in order to increase the validity of a study
These sources are likely to be stakeholders in a program - participants, other researchers, program staff, other community members, and so on.
Then we put all data in single framework & apply various statistical tools to find out the dynamic on the market.
During the analysis stage, feedback from the stakeholder groups would be compared to determine areas of agreement as well as areas of divergence


