
Key Insights
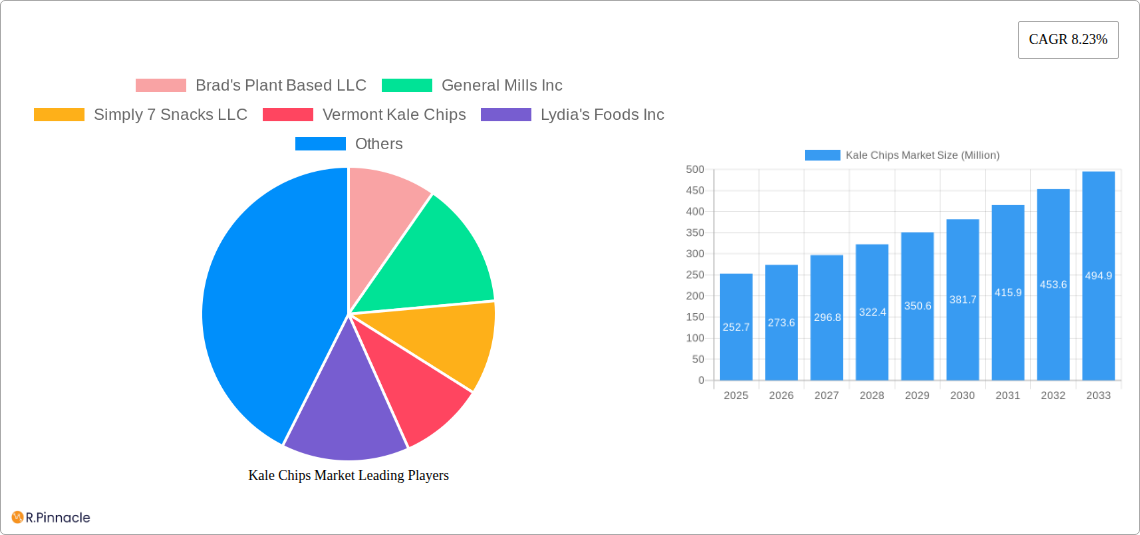
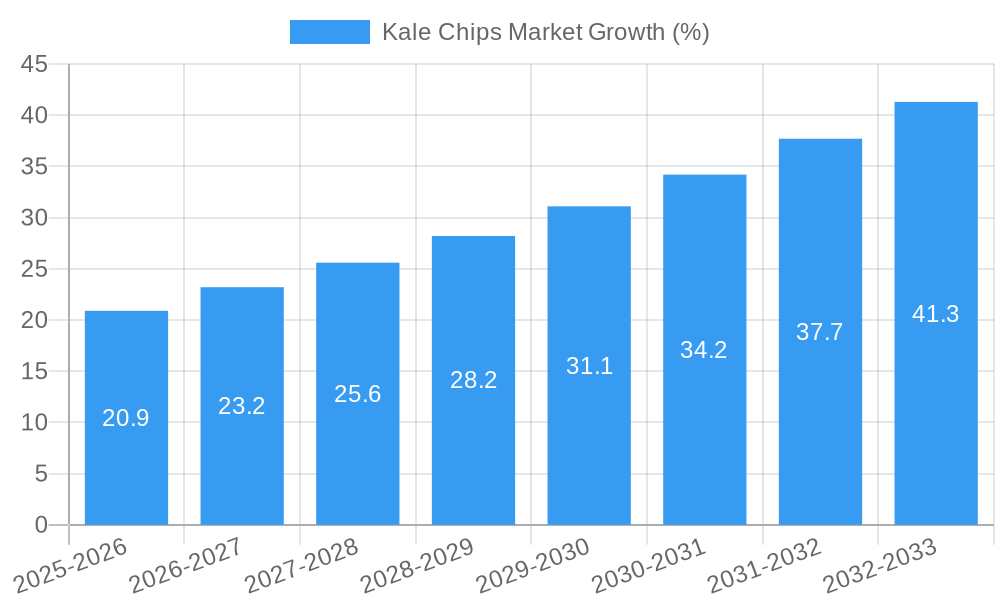
The global kale chips market, valued at $252.7 million in 2025, is projected to experience robust growth, driven by increasing consumer demand for healthy and convenient snacks. The market's Compound Annual Growth Rate (CAGR) of 8.23% from 2025 to 2033 indicates significant expansion potential. This growth is fueled by several key factors: the rising popularity of vegan and vegetarian diets, a growing awareness of the health benefits associated with kale (rich in vitamins and antioxidants), and the increasing preference for convenient, on-the-go snack options. The market segmentation reveals a strong preference for dehydrated leaf crisps/chips over extruded varieties, reflecting consumer preference for a more natural and less processed product. Hypermarkets/supermarkets currently dominate distribution channels, but online stores are witnessing rapid growth, driven by the increasing adoption of e-commerce and the convenience it offers. Competitive landscape analysis suggests the market is characterized by a mix of established players like General Mills and emerging brands focusing on niche segments and innovative product offerings. Geographical expansion, particularly in Asia-Pacific and South America, presents lucrative opportunities for market players. However, potential restraints include fluctuations in raw material prices and the possibility of consumer preference shifts towards other healthy snack alternatives.
The continued growth of the kale chips market hinges on successful product innovation, strategic partnerships, and effective marketing campaigns that effectively communicate the health benefits and convenience of kale chips. Expanding into new markets through targeted distribution channels and creating new product variations catering to diverse consumer preferences will be crucial for sustained market expansion. Addressing potential challenges like fluctuating raw material costs and increased competition will require agile business strategies and a focus on operational efficiency. The market's future trajectory will depend heavily on consumer demand for healthy snacks and the ability of industry players to deliver high-quality, innovative products meeting evolving consumer preferences.
Kale Chips Market Report: A Comprehensive Analysis (2019-2033)
This in-depth report provides a comprehensive analysis of the Kale Chips Market, offering invaluable insights for industry professionals, investors, and stakeholders. The report covers market structure, dynamics, leading players, and future growth projections, leveraging data from 2019 to 2024 (historical period), with estimations for 2025 (estimated year and base year) and forecasts extending to 2033 (forecast period). The market is segmented by product type (Dehydrated leaf Crisps/Chips, Extruded Chips) and distribution channel (Hypermarkets/Supermarkets, Convenience Stores, Specialist Stores, Online Stores). The total market size is predicted to reach xx Million by 2033.
Kale Chips Market Structure & Innovation Trends
This section analyzes the kale chips market's competitive landscape, examining market concentration, innovation drivers, regulatory factors, substitute products, and end-user demographics. We delve into the impact of mergers and acquisitions (M&A) activities, providing insights into deal values and market share shifts. The market exhibits a moderately fragmented structure, with several key players vying for market share.
- Market Concentration: xx% market share held by the top 5 players in 2024.
- Innovation Drivers: Growing consumer demand for healthy snacks, increasing awareness of kale's nutritional benefits, and ongoing product innovation.
- Regulatory Framework: Regulations concerning food labeling and ingredient sourcing influence market dynamics.
- Product Substitutes: Other healthy snack options like vegetable chips and fruit snacks pose competitive threats.
- End-User Demographics: The target market primarily comprises health-conscious consumers, particularly millennials and Gen Z.
- M&A Activities: Significant M&A activity has been observed in recent years, with deal values totaling xx Million between 2019 and 2024. Examples include General Mills Inc.'s investment in Rhythm Superfoods.
Kale Chips Market Dynamics & Trends
This section explores the key factors driving market growth, technological advancements, evolving consumer preferences, and competitive dynamics within the kale chips market. We will analyze the Compound Annual Growth Rate (CAGR) and market penetration rates across different segments. The market is projected to experience a CAGR of xx% during the forecast period (2025-2033), fueled by several key factors, including growing consumer demand for healthy and convenient snack options and an increasing focus on plant-based diets.
Dominant Regions & Segments in Kale Chips Market
This section identifies the leading regions and segments within the kale chips market, providing a detailed analysis of their dominance.
By Product Type:
- Dehydrated Leaf Crisps/Chips: This segment holds the largest market share due to its established presence and consumer familiarity. Key drivers include ease of production and cost-effectiveness.
- Extruded Chips: This segment is experiencing faster growth, driven by increasing consumer preference for unique textures and flavors.
By Distribution Channel:
- Hypermarkets/Supermarkets: This channel dominates due to its extensive reach and established distribution networks.
- Convenience Stores: This channel demonstrates strong growth potential, driven by consumer demand for on-the-go snack options.
- Specialist Stores & Online Stores: These channels are witnessing increasing market share, reflecting the growing popularity of online shopping and the rise of specialty stores focused on healthy foods.
Kale Chips Market Product Innovations
The kale chips market is witnessing continuous product innovation, driven by the need for diversification and catering to the evolving consumer preferences. New flavors, textures, and formats are regularly introduced to cater to this growing market. Technological advancements in processing and packaging enhance product quality and shelf life.
Report Scope & Segmentation Analysis
This report provides a comprehensive analysis of the Kale Chips market, segmented by product type (Dehydrated leaf Crisps/Chips and Extruded Chips) and distribution channel (Hypermarkets/Supermarkets, Convenience Stores, Specialist Stores, and Online Stores). Each segment's growth projections, market sizes, and competitive dynamics are analyzed in detail. The market is expected to witness significant growth across all segments during the forecast period.
Key Drivers of Kale Chips Market Growth
The kale chips market's growth is driven by several key factors, including the increasing consumer demand for healthy and convenient snacks, rising health consciousness, and the expanding popularity of plant-based diets. Technological advancements in processing and packaging contribute to enhanced product quality and extended shelf life, further fueling market expansion. Favorable regulatory frameworks also support market growth.
Challenges in the Kale Chips Market Sector
The kale chips market faces challenges such as intense competition from other healthy snack alternatives, fluctuations in raw material prices, and stringent regulatory requirements. Supply chain disruptions can also impact market stability. These factors can limit market growth and profitability.
Emerging Opportunities in Kale Chips Market
Emerging opportunities exist in the development of innovative product formulations, such as organic and gluten-free kale chips. Expansion into new markets, particularly in developing countries, presents significant potential. The growing demand for personalized nutrition and functional foods also presents opportunities for innovation in this sector.
Leading Players in the Kale Chips Market Market
- Brad's Plant Based LLC
- General Mills Inc
- Simply 7 Snacks LLC
- Vermont Kale Chips
- Lydia's Foods Inc
- Healthy Crunch
- The Green Snack Co
- The Angel Kale Company
- The Kale Factory
- GlaxoSmithKline PLC
Key Developments in Kale Chips Market Industry
- September 2020: Ecoideas launched Solar Raw's Kaley's Kale Chips in four new flavors.
- November 2019: San Miguel Produce, Inc. launched a new line of fresh Kale Chip Kits.
- January 2017: General Mills Inc. invested in Rhythm Superfoods.
Future Outlook for Kale Chips Market Market
The kale chips market is poised for robust growth in the coming years, driven by continued innovation, expanding consumer demand, and favorable market conditions. Strategic partnerships, new product launches, and expansion into emerging markets will be key to maximizing future market potential.
Kale Chips Market Segmentation
-
1. Product Type
- 1.1. Dehydrated leaf Crisps/Chips
- 1.2. Extruded Chips
-
2. Distribution Channel
- 2.1. Hypermarkets/Supermarkets
- 2.2. Convenience Stores
- 2.3. Specialist Stores
- 2.4. Online Stores
Kale Chips Market Segmentation By Geography
-
1. North America
- 1.1. United States
- 1.2. Canada
- 1.3. Mexico
- 1.4. Rest of North America
-
2. Europe
- 2.1. United Kingdom
- 2.2. Germany
- 2.3. Spain
- 2.4. France
- 2.5. Italy
- 2.6. Russia
- 2.7. Rest of Europe
-
3. Asia Pacific
- 3.1. China
- 3.2. Japan
- 3.3. India
- 3.4. Australia
- 3.5. Rest of Asia Pacific
-
4. South America
- 4.1. Brazil
- 4.2. Argentina
- 4.3. Rest of South America
-
5. Middle East and Africa
- 5.1. United Arab Emirates
- 5.2. South Africa
- 5.3. Rest of Middle East and Africa

Kale Chips Market REPORT HIGHLIGHTS
| Aspects | Details |
|---|---|
| Study Period | 2019-2033 |
| Base Year | 2024 |
| Estimated Year | 2025 |
| Forecast Period | 2025-2033 |
| Historical Period | 2019-2024 |
| Growth Rate | CAGR of 8.23% from 2019-2033 |
| Segmentation |
|
Table of Contents
- 1. Introduction
- 1.1. Research Scope
- 1.2. Market Segmentation
- 1.3. Research Methodology
- 1.4. Definitions and Assumptions
- 2. Executive Summary
- 2.1. Introduction
- 3. Market Dynamics
- 3.1. Introduction
- 3.2. Market Drivers
- 3.2.1. Increasing Demand for Clean Label Ingredients; Growing Health Consciousness of Consumers
- 3.3. Market Restrains
- 3.3.1. Higher Manufacturing Cost
- 3.4. Market Trends
- 3.4.1. Increasing demand of Vegetable and Healthy Chips
- 4. Market Factor Analysis
- 4.1. Porters Five Forces
- 4.2. Supply/Value Chain
- 4.3. PESTEL analysis
- 4.4. Market Entropy
- 4.5. Patent/Trademark Analysis
- 5. Global Kale Chips Market Analysis, Insights and Forecast, 2019-2031
- 5.1. Market Analysis, Insights and Forecast - by Product Type
- 5.1.1. Dehydrated leaf Crisps/Chips
- 5.1.2. Extruded Chips
- 5.2. Market Analysis, Insights and Forecast - by Distribution Channel
- 5.2.1. Hypermarkets/Supermarkets
- 5.2.2. Convenience Stores
- 5.2.3. Specialist Stores
- 5.2.4. Online Stores
- 5.3. Market Analysis, Insights and Forecast - by Region
- 5.3.1. North America
- 5.3.2. Europe
- 5.3.3. Asia Pacific
- 5.3.4. South America
- 5.3.5. Middle East and Africa
- 5.1. Market Analysis, Insights and Forecast - by Product Type
- 6. North America Kale Chips Market Analysis, Insights and Forecast, 2019-2031
- 6.1. Market Analysis, Insights and Forecast - by Product Type
- 6.1.1. Dehydrated leaf Crisps/Chips
- 6.1.2. Extruded Chips
- 6.2. Market Analysis, Insights and Forecast - by Distribution Channel
- 6.2.1. Hypermarkets/Supermarkets
- 6.2.2. Convenience Stores
- 6.2.3. Specialist Stores
- 6.2.4. Online Stores
- 6.1. Market Analysis, Insights and Forecast - by Product Type
- 7. Europe Kale Chips Market Analysis, Insights and Forecast, 2019-2031
- 7.1. Market Analysis, Insights and Forecast - by Product Type
- 7.1.1. Dehydrated leaf Crisps/Chips
- 7.1.2. Extruded Chips
- 7.2. Market Analysis, Insights and Forecast - by Distribution Channel
- 7.2.1. Hypermarkets/Supermarkets
- 7.2.2. Convenience Stores
- 7.2.3. Specialist Stores
- 7.2.4. Online Stores
- 7.1. Market Analysis, Insights and Forecast - by Product Type
- 8. Asia Pacific Kale Chips Market Analysis, Insights and Forecast, 2019-2031
- 8.1. Market Analysis, Insights and Forecast - by Product Type
- 8.1.1. Dehydrated leaf Crisps/Chips
- 8.1.2. Extruded Chips
- 8.2. Market Analysis, Insights and Forecast - by Distribution Channel
- 8.2.1. Hypermarkets/Supermarkets
- 8.2.2. Convenience Stores
- 8.2.3. Specialist Stores
- 8.2.4. Online Stores
- 8.1. Market Analysis, Insights and Forecast - by Product Type
- 9. South America Kale Chips Market Analysis, Insights and Forecast, 2019-2031
- 9.1. Market Analysis, Insights and Forecast - by Product Type
- 9.1.1. Dehydrated leaf Crisps/Chips
- 9.1.2. Extruded Chips
- 9.2. Market Analysis, Insights and Forecast - by Distribution Channel
- 9.2.1. Hypermarkets/Supermarkets
- 9.2.2. Convenience Stores
- 9.2.3. Specialist Stores
- 9.2.4. Online Stores
- 9.1. Market Analysis, Insights and Forecast - by Product Type
- 10. Middle East and Africa Kale Chips Market Analysis, Insights and Forecast, 2019-2031
- 10.1. Market Analysis, Insights and Forecast - by Product Type
- 10.1.1. Dehydrated leaf Crisps/Chips
- 10.1.2. Extruded Chips
- 10.2. Market Analysis, Insights and Forecast - by Distribution Channel
- 10.2.1. Hypermarkets/Supermarkets
- 10.2.2. Convenience Stores
- 10.2.3. Specialist Stores
- 10.2.4. Online Stores
- 10.1. Market Analysis, Insights and Forecast - by Product Type
- 11. North America Kale Chips Market Analysis, Insights and Forecast, 2019-2031
- 11.1. Market Analysis, Insights and Forecast - By Country/Sub-region
- 11.1.1 United States
- 11.1.2 Canada
- 11.1.3 Mexico
- 11.1.4 Rest of North America
- 12. Europe Kale Chips Market Analysis, Insights and Forecast, 2019-2031
- 12.1. Market Analysis, Insights and Forecast - By Country/Sub-region
- 12.1.1 United Kingdom
- 12.1.2 Germany
- 12.1.3 Spain
- 12.1.4 France
- 12.1.5 Italy
- 12.1.6 Russia
- 12.1.7 Rest of Europe
- 13. Asia Pacific Kale Chips Market Analysis, Insights and Forecast, 2019-2031
- 13.1. Market Analysis, Insights and Forecast - By Country/Sub-region
- 13.1.1 China
- 13.1.2 Japan
- 13.1.3 India
- 13.1.4 Australia
- 13.1.5 Rest of Asia Pacific
- 14. South America Kale Chips Market Analysis, Insights and Forecast, 2019-2031
- 14.1. Market Analysis, Insights and Forecast - By Country/Sub-region
- 14.1.1 Brazil
- 14.1.2 Argentina
- 14.1.3 Rest of South America
- 15. Middle East and Africa Kale Chips Market Analysis, Insights and Forecast, 2019-2031
- 15.1. Market Analysis, Insights and Forecast - By Country/Sub-region
- 15.1.1 United Arab Emirates
- 15.1.2 South Africa
- 15.1.3 Rest of Middle East and Africa
- 16. Competitive Analysis
- 16.1. Global Market Share Analysis 2024
- 16.2. Company Profiles
- 16.2.1 Brad's Plant Based LLC
- 16.2.1.1. Overview
- 16.2.1.2. Products
- 16.2.1.3. SWOT Analysis
- 16.2.1.4. Recent Developments
- 16.2.1.5. Financials (Based on Availability)
- 16.2.2 General Mills Inc
- 16.2.2.1. Overview
- 16.2.2.2. Products
- 16.2.2.3. SWOT Analysis
- 16.2.2.4. Recent Developments
- 16.2.2.5. Financials (Based on Availability)
- 16.2.3 Simply 7 Snacks LLC
- 16.2.3.1. Overview
- 16.2.3.2. Products
- 16.2.3.3. SWOT Analysis
- 16.2.3.4. Recent Developments
- 16.2.3.5. Financials (Based on Availability)
- 16.2.4 Vermont Kale Chips
- 16.2.4.1. Overview
- 16.2.4.2. Products
- 16.2.4.3. SWOT Analysis
- 16.2.4.4. Recent Developments
- 16.2.4.5. Financials (Based on Availability)
- 16.2.5 Lydia's Foods Inc
- 16.2.5.1. Overview
- 16.2.5.2. Products
- 16.2.5.3. SWOT Analysis
- 16.2.5.4. Recent Developments
- 16.2.5.5. Financials (Based on Availability)
- 16.2.6 Healthy Crunch
- 16.2.6.1. Overview
- 16.2.6.2. Products
- 16.2.6.3. SWOT Analysis
- 16.2.6.4. Recent Developments
- 16.2.6.5. Financials (Based on Availability)
- 16.2.7 The Green Snack Co *List Not Exhaustive
- 16.2.7.1. Overview
- 16.2.7.2. Products
- 16.2.7.3. SWOT Analysis
- 16.2.7.4. Recent Developments
- 16.2.7.5. Financials (Based on Availability)
- 16.2.8 The Angel Kale Company
- 16.2.8.1. Overview
- 16.2.8.2. Products
- 16.2.8.3. SWOT Analysis
- 16.2.8.4. Recent Developments
- 16.2.8.5. Financials (Based on Availability)
- 16.2.9 The Kale Factory
- 16.2.9.1. Overview
- 16.2.9.2. Products
- 16.2.9.3. SWOT Analysis
- 16.2.9.4. Recent Developments
- 16.2.9.5. Financials (Based on Availability)
- 16.2.10 GlaxoSmithKline PLC
- 16.2.10.1. Overview
- 16.2.10.2. Products
- 16.2.10.3. SWOT Analysis
- 16.2.10.4. Recent Developments
- 16.2.10.5. Financials (Based on Availability)
- 16.2.1 Brad's Plant Based LLC
List of Figures
- Figure 1: Global Kale Chips Market Revenue Breakdown (Million, %) by Region 2024 & 2032
- Figure 2: Global Kale Chips Market Volume Breakdown (K Tons, %) by Region 2024 & 2032
- Figure 3: North America Kale Chips Market Revenue (Million), by Country 2024 & 2032
- Figure 4: North America Kale Chips Market Volume (K Tons), by Country 2024 & 2032
- Figure 5: North America Kale Chips Market Revenue Share (%), by Country 2024 & 2032
- Figure 6: North America Kale Chips Market Volume Share (%), by Country 2024 & 2032
- Figure 7: Europe Kale Chips Market Revenue (Million), by Country 2024 & 2032
- Figure 8: Europe Kale Chips Market Volume (K Tons), by Country 2024 & 2032
- Figure 9: Europe Kale Chips Market Revenue Share (%), by Country 2024 & 2032
- Figure 10: Europe Kale Chips Market Volume Share (%), by Country 2024 & 2032
- Figure 11: Asia Pacific Kale Chips Market Revenue (Million), by Country 2024 & 2032
- Figure 12: Asia Pacific Kale Chips Market Volume (K Tons), by Country 2024 & 2032
- Figure 13: Asia Pacific Kale Chips Market Revenue Share (%), by Country 2024 & 2032
- Figure 14: Asia Pacific Kale Chips Market Volume Share (%), by Country 2024 & 2032
- Figure 15: South America Kale Chips Market Revenue (Million), by Country 2024 & 2032
- Figure 16: South America Kale Chips Market Volume (K Tons), by Country 2024 & 2032
- Figure 17: South America Kale Chips Market Revenue Share (%), by Country 2024 & 2032
- Figure 18: South America Kale Chips Market Volume Share (%), by Country 2024 & 2032
- Figure 19: Middle East and Africa Kale Chips Market Revenue (Million), by Country 2024 & 2032
- Figure 20: Middle East and Africa Kale Chips Market Volume (K Tons), by Country 2024 & 2032
- Figure 21: Middle East and Africa Kale Chips Market Revenue Share (%), by Country 2024 & 2032
- Figure 22: Middle East and Africa Kale Chips Market Volume Share (%), by Country 2024 & 2032
- Figure 23: North America Kale Chips Market Revenue (Million), by Product Type 2024 & 2032
- Figure 24: North America Kale Chips Market Volume (K Tons), by Product Type 2024 & 2032
- Figure 25: North America Kale Chips Market Revenue Share (%), by Product Type 2024 & 2032
- Figure 26: North America Kale Chips Market Volume Share (%), by Product Type 2024 & 2032
- Figure 27: North America Kale Chips Market Revenue (Million), by Distribution Channel 2024 & 2032
- Figure 28: North America Kale Chips Market Volume (K Tons), by Distribution Channel 2024 & 2032
- Figure 29: North America Kale Chips Market Revenue Share (%), by Distribution Channel 2024 & 2032
- Figure 30: North America Kale Chips Market Volume Share (%), by Distribution Channel 2024 & 2032
- Figure 31: North America Kale Chips Market Revenue (Million), by Country 2024 & 2032
- Figure 32: North America Kale Chips Market Volume (K Tons), by Country 2024 & 2032
- Figure 33: North America Kale Chips Market Revenue Share (%), by Country 2024 & 2032
- Figure 34: North America Kale Chips Market Volume Share (%), by Country 2024 & 2032
- Figure 35: Europe Kale Chips Market Revenue (Million), by Product Type 2024 & 2032
- Figure 36: Europe Kale Chips Market Volume (K Tons), by Product Type 2024 & 2032
- Figure 37: Europe Kale Chips Market Revenue Share (%), by Product Type 2024 & 2032
- Figure 38: Europe Kale Chips Market Volume Share (%), by Product Type 2024 & 2032
- Figure 39: Europe Kale Chips Market Revenue (Million), by Distribution Channel 2024 & 2032
- Figure 40: Europe Kale Chips Market Volume (K Tons), by Distribution Channel 2024 & 2032
- Figure 41: Europe Kale Chips Market Revenue Share (%), by Distribution Channel 2024 & 2032
- Figure 42: Europe Kale Chips Market Volume Share (%), by Distribution Channel 2024 & 2032
- Figure 43: Europe Kale Chips Market Revenue (Million), by Country 2024 & 2032
- Figure 44: Europe Kale Chips Market Volume (K Tons), by Country 2024 & 2032
- Figure 45: Europe Kale Chips Market Revenue Share (%), by Country 2024 & 2032
- Figure 46: Europe Kale Chips Market Volume Share (%), by Country 2024 & 2032
- Figure 47: Asia Pacific Kale Chips Market Revenue (Million), by Product Type 2024 & 2032
- Figure 48: Asia Pacific Kale Chips Market Volume (K Tons), by Product Type 2024 & 2032
- Figure 49: Asia Pacific Kale Chips Market Revenue Share (%), by Product Type 2024 & 2032
- Figure 50: Asia Pacific Kale Chips Market Volume Share (%), by Product Type 2024 & 2032
- Figure 51: Asia Pacific Kale Chips Market Revenue (Million), by Distribution Channel 2024 & 2032
- Figure 52: Asia Pacific Kale Chips Market Volume (K Tons), by Distribution Channel 2024 & 2032
- Figure 53: Asia Pacific Kale Chips Market Revenue Share (%), by Distribution Channel 2024 & 2032
- Figure 54: Asia Pacific Kale Chips Market Volume Share (%), by Distribution Channel 2024 & 2032
- Figure 55: Asia Pacific Kale Chips Market Revenue (Million), by Country 2024 & 2032
- Figure 56: Asia Pacific Kale Chips Market Volume (K Tons), by Country 2024 & 2032
- Figure 57: Asia Pacific Kale Chips Market Revenue Share (%), by Country 2024 & 2032
- Figure 58: Asia Pacific Kale Chips Market Volume Share (%), by Country 2024 & 2032
- Figure 59: South America Kale Chips Market Revenue (Million), by Product Type 2024 & 2032
- Figure 60: South America Kale Chips Market Volume (K Tons), by Product Type 2024 & 2032
- Figure 61: South America Kale Chips Market Revenue Share (%), by Product Type 2024 & 2032
- Figure 62: South America Kale Chips Market Volume Share (%), by Product Type 2024 & 2032
- Figure 63: South America Kale Chips Market Revenue (Million), by Distribution Channel 2024 & 2032
- Figure 64: South America Kale Chips Market Volume (K Tons), by Distribution Channel 2024 & 2032
- Figure 65: South America Kale Chips Market Revenue Share (%), by Distribution Channel 2024 & 2032
- Figure 66: South America Kale Chips Market Volume Share (%), by Distribution Channel 2024 & 2032
- Figure 67: South America Kale Chips Market Revenue (Million), by Country 2024 & 2032
- Figure 68: South America Kale Chips Market Volume (K Tons), by Country 2024 & 2032
- Figure 69: South America Kale Chips Market Revenue Share (%), by Country 2024 & 2032
- Figure 70: South America Kale Chips Market Volume Share (%), by Country 2024 & 2032
- Figure 71: Middle East and Africa Kale Chips Market Revenue (Million), by Product Type 2024 & 2032
- Figure 72: Middle East and Africa Kale Chips Market Volume (K Tons), by Product Type 2024 & 2032
- Figure 73: Middle East and Africa Kale Chips Market Revenue Share (%), by Product Type 2024 & 2032
- Figure 74: Middle East and Africa Kale Chips Market Volume Share (%), by Product Type 2024 & 2032
- Figure 75: Middle East and Africa Kale Chips Market Revenue (Million), by Distribution Channel 2024 & 2032
- Figure 76: Middle East and Africa Kale Chips Market Volume (K Tons), by Distribution Channel 2024 & 2032
- Figure 77: Middle East and Africa Kale Chips Market Revenue Share (%), by Distribution Channel 2024 & 2032
- Figure 78: Middle East and Africa Kale Chips Market Volume Share (%), by Distribution Channel 2024 & 2032
- Figure 79: Middle East and Africa Kale Chips Market Revenue (Million), by Country 2024 & 2032
- Figure 80: Middle East and Africa Kale Chips Market Volume (K Tons), by Country 2024 & 2032
- Figure 81: Middle East and Africa Kale Chips Market Revenue Share (%), by Country 2024 & 2032
- Figure 82: Middle East and Africa Kale Chips Market Volume Share (%), by Country 2024 & 2032
List of Tables
- Table 1: Global Kale Chips Market Revenue Million Forecast, by Region 2019 & 2032
- Table 2: Global Kale Chips Market Volume K Tons Forecast, by Region 2019 & 2032
- Table 3: Global Kale Chips Market Revenue Million Forecast, by Product Type 2019 & 2032
- Table 4: Global Kale Chips Market Volume K Tons Forecast, by Product Type 2019 & 2032
- Table 5: Global Kale Chips Market Revenue Million Forecast, by Distribution Channel 2019 & 2032
- Table 6: Global Kale Chips Market Volume K Tons Forecast, by Distribution Channel 2019 & 2032
- Table 7: Global Kale Chips Market Revenue Million Forecast, by Region 2019 & 2032
- Table 8: Global Kale Chips Market Volume K Tons Forecast, by Region 2019 & 2032
- Table 9: Global Kale Chips Market Revenue Million Forecast, by Country 2019 & 2032
- Table 10: Global Kale Chips Market Volume K Tons Forecast, by Country 2019 & 2032
- Table 11: United States Kale Chips Market Revenue (Million) Forecast, by Application 2019 & 2032
- Table 12: United States Kale Chips Market Volume (K Tons) Forecast, by Application 2019 & 2032
- Table 13: Canada Kale Chips Market Revenue (Million) Forecast, by Application 2019 & 2032
- Table 14: Canada Kale Chips Market Volume (K Tons) Forecast, by Application 2019 & 2032
- Table 15: Mexico Kale Chips Market Revenue (Million) Forecast, by Application 2019 & 2032
- Table 16: Mexico Kale Chips Market Volume (K Tons) Forecast, by Application 2019 & 2032
- Table 17: Rest of North America Kale Chips Market Revenue (Million) Forecast, by Application 2019 & 2032
- Table 18: Rest of North America Kale Chips Market Volume (K Tons) Forecast, by Application 2019 & 2032
- Table 19: Global Kale Chips Market Revenue Million Forecast, by Country 2019 & 2032
- Table 20: Global Kale Chips Market Volume K Tons Forecast, by Country 2019 & 2032
- Table 21: United Kingdom Kale Chips Market Revenue (Million) Forecast, by Application 2019 & 2032
- Table 22: United Kingdom Kale Chips Market Volume (K Tons) Forecast, by Application 2019 & 2032
- Table 23: Germany Kale Chips Market Revenue (Million) Forecast, by Application 2019 & 2032
- Table 24: Germany Kale Chips Market Volume (K Tons) Forecast, by Application 2019 & 2032
- Table 25: Spain Kale Chips Market Revenue (Million) Forecast, by Application 2019 & 2032
- Table 26: Spain Kale Chips Market Volume (K Tons) Forecast, by Application 2019 & 2032
- Table 27: France Kale Chips Market Revenue (Million) Forecast, by Application 2019 & 2032
- Table 28: France Kale Chips Market Volume (K Tons) Forecast, by Application 2019 & 2032
- Table 29: Italy Kale Chips Market Revenue (Million) Forecast, by Application 2019 & 2032
- Table 30: Italy Kale Chips Market Volume (K Tons) Forecast, by Application 2019 & 2032
- Table 31: Russia Kale Chips Market Revenue (Million) Forecast, by Application 2019 & 2032
- Table 32: Russia Kale Chips Market Volume (K Tons) Forecast, by Application 2019 & 2032
- Table 33: Rest of Europe Kale Chips Market Revenue (Million) Forecast, by Application 2019 & 2032
- Table 34: Rest of Europe Kale Chips Market Volume (K Tons) Forecast, by Application 2019 & 2032
- Table 35: Global Kale Chips Market Revenue Million Forecast, by Country 2019 & 2032
- Table 36: Global Kale Chips Market Volume K Tons Forecast, by Country 2019 & 2032
- Table 37: China Kale Chips Market Revenue (Million) Forecast, by Application 2019 & 2032
- Table 38: China Kale Chips Market Volume (K Tons) Forecast, by Application 2019 & 2032
- Table 39: Japan Kale Chips Market Revenue (Million) Forecast, by Application 2019 & 2032
- Table 40: Japan Kale Chips Market Volume (K Tons) Forecast, by Application 2019 & 2032
- Table 41: India Kale Chips Market Revenue (Million) Forecast, by Application 2019 & 2032
- Table 42: India Kale Chips Market Volume (K Tons) Forecast, by Application 2019 & 2032
- Table 43: Australia Kale Chips Market Revenue (Million) Forecast, by Application 2019 & 2032
- Table 44: Australia Kale Chips Market Volume (K Tons) Forecast, by Application 2019 & 2032
- Table 45: Rest of Asia Pacific Kale Chips Market Revenue (Million) Forecast, by Application 2019 & 2032
- Table 46: Rest of Asia Pacific Kale Chips Market Volume (K Tons) Forecast, by Application 2019 & 2032
- Table 47: Global Kale Chips Market Revenue Million Forecast, by Country 2019 & 2032
- Table 48: Global Kale Chips Market Volume K Tons Forecast, by Country 2019 & 2032
- Table 49: Brazil Kale Chips Market Revenue (Million) Forecast, by Application 2019 & 2032
- Table 50: Brazil Kale Chips Market Volume (K Tons) Forecast, by Application 2019 & 2032
- Table 51: Argentina Kale Chips Market Revenue (Million) Forecast, by Application 2019 & 2032
- Table 52: Argentina Kale Chips Market Volume (K Tons) Forecast, by Application 2019 & 2032
- Table 53: Rest of South America Kale Chips Market Revenue (Million) Forecast, by Application 2019 & 2032
- Table 54: Rest of South America Kale Chips Market Volume (K Tons) Forecast, by Application 2019 & 2032
- Table 55: Global Kale Chips Market Revenue Million Forecast, by Country 2019 & 2032
- Table 56: Global Kale Chips Market Volume K Tons Forecast, by Country 2019 & 2032
- Table 57: United Arab Emirates Kale Chips Market Revenue (Million) Forecast, by Application 2019 & 2032
- Table 58: United Arab Emirates Kale Chips Market Volume (K Tons) Forecast, by Application 2019 & 2032
- Table 59: South Africa Kale Chips Market Revenue (Million) Forecast, by Application 2019 & 2032
- Table 60: South Africa Kale Chips Market Volume (K Tons) Forecast, by Application 2019 & 2032
- Table 61: Rest of Middle East and Africa Kale Chips Market Revenue (Million) Forecast, by Application 2019 & 2032
- Table 62: Rest of Middle East and Africa Kale Chips Market Volume (K Tons) Forecast, by Application 2019 & 2032
- Table 63: Global Kale Chips Market Revenue Million Forecast, by Product Type 2019 & 2032
- Table 64: Global Kale Chips Market Volume K Tons Forecast, by Product Type 2019 & 2032
- Table 65: Global Kale Chips Market Revenue Million Forecast, by Distribution Channel 2019 & 2032
- Table 66: Global Kale Chips Market Volume K Tons Forecast, by Distribution Channel 2019 & 2032
- Table 67: Global Kale Chips Market Revenue Million Forecast, by Country 2019 & 2032
- Table 68: Global Kale Chips Market Volume K Tons Forecast, by Country 2019 & 2032
- Table 69: United States Kale Chips Market Revenue (Million) Forecast, by Application 2019 & 2032
- Table 70: United States Kale Chips Market Volume (K Tons) Forecast, by Application 2019 & 2032
- Table 71: Canada Kale Chips Market Revenue (Million) Forecast, by Application 2019 & 2032
- Table 72: Canada Kale Chips Market Volume (K Tons) Forecast, by Application 2019 & 2032
- Table 73: Mexico Kale Chips Market Revenue (Million) Forecast, by Application 2019 & 2032
- Table 74: Mexico Kale Chips Market Volume (K Tons) Forecast, by Application 2019 & 2032
- Table 75: Rest of North America Kale Chips Market Revenue (Million) Forecast, by Application 2019 & 2032
- Table 76: Rest of North America Kale Chips Market Volume (K Tons) Forecast, by Application 2019 & 2032
- Table 77: Global Kale Chips Market Revenue Million Forecast, by Product Type 2019 & 2032
- Table 78: Global Kale Chips Market Volume K Tons Forecast, by Product Type 2019 & 2032
- Table 79: Global Kale Chips Market Revenue Million Forecast, by Distribution Channel 2019 & 2032
- Table 80: Global Kale Chips Market Volume K Tons Forecast, by Distribution Channel 2019 & 2032
- Table 81: Global Kale Chips Market Revenue Million Forecast, by Country 2019 & 2032
- Table 82: Global Kale Chips Market Volume K Tons Forecast, by Country 2019 & 2032
- Table 83: United Kingdom Kale Chips Market Revenue (Million) Forecast, by Application 2019 & 2032
- Table 84: United Kingdom Kale Chips Market Volume (K Tons) Forecast, by Application 2019 & 2032
- Table 85: Germany Kale Chips Market Revenue (Million) Forecast, by Application 2019 & 2032
- Table 86: Germany Kale Chips Market Volume (K Tons) Forecast, by Application 2019 & 2032
- Table 87: Spain Kale Chips Market Revenue (Million) Forecast, by Application 2019 & 2032
- Table 88: Spain Kale Chips Market Volume (K Tons) Forecast, by Application 2019 & 2032
- Table 89: France Kale Chips Market Revenue (Million) Forecast, by Application 2019 & 2032
- Table 90: France Kale Chips Market Volume (K Tons) Forecast, by Application 2019 & 2032
- Table 91: Italy Kale Chips Market Revenue (Million) Forecast, by Application 2019 & 2032
- Table 92: Italy Kale Chips Market Volume (K Tons) Forecast, by Application 2019 & 2032
- Table 93: Russia Kale Chips Market Revenue (Million) Forecast, by Application 2019 & 2032
- Table 94: Russia Kale Chips Market Volume (K Tons) Forecast, by Application 2019 & 2032
- Table 95: Rest of Europe Kale Chips Market Revenue (Million) Forecast, by Application 2019 & 2032
- Table 96: Rest of Europe Kale Chips Market Volume (K Tons) Forecast, by Application 2019 & 2032
- Table 97: Global Kale Chips Market Revenue Million Forecast, by Product Type 2019 & 2032
- Table 98: Global Kale Chips Market Volume K Tons Forecast, by Product Type 2019 & 2032
- Table 99: Global Kale Chips Market Revenue Million Forecast, by Distribution Channel 2019 & 2032
- Table 100: Global Kale Chips Market Volume K Tons Forecast, by Distribution Channel 2019 & 2032
- Table 101: Global Kale Chips Market Revenue Million Forecast, by Country 2019 & 2032
- Table 102: Global Kale Chips Market Volume K Tons Forecast, by Country 2019 & 2032
- Table 103: China Kale Chips Market Revenue (Million) Forecast, by Application 2019 & 2032
- Table 104: China Kale Chips Market Volume (K Tons) Forecast, by Application 2019 & 2032
- Table 105: Japan Kale Chips Market Revenue (Million) Forecast, by Application 2019 & 2032
- Table 106: Japan Kale Chips Market Volume (K Tons) Forecast, by Application 2019 & 2032
- Table 107: India Kale Chips Market Revenue (Million) Forecast, by Application 2019 & 2032
- Table 108: India Kale Chips Market Volume (K Tons) Forecast, by Application 2019 & 2032
- Table 109: Australia Kale Chips Market Revenue (Million) Forecast, by Application 2019 & 2032
- Table 110: Australia Kale Chips Market Volume (K Tons) Forecast, by Application 2019 & 2032
- Table 111: Rest of Asia Pacific Kale Chips Market Revenue (Million) Forecast, by Application 2019 & 2032
- Table 112: Rest of Asia Pacific Kale Chips Market Volume (K Tons) Forecast, by Application 2019 & 2032
- Table 113: Global Kale Chips Market Revenue Million Forecast, by Product Type 2019 & 2032
- Table 114: Global Kale Chips Market Volume K Tons Forecast, by Product Type 2019 & 2032
- Table 115: Global Kale Chips Market Revenue Million Forecast, by Distribution Channel 2019 & 2032
- Table 116: Global Kale Chips Market Volume K Tons Forecast, by Distribution Channel 2019 & 2032
- Table 117: Global Kale Chips Market Revenue Million Forecast, by Country 2019 & 2032
- Table 118: Global Kale Chips Market Volume K Tons Forecast, by Country 2019 & 2032
- Table 119: Brazil Kale Chips Market Revenue (Million) Forecast, by Application 2019 & 2032
- Table 120: Brazil Kale Chips Market Volume (K Tons) Forecast, by Application 2019 & 2032
- Table 121: Argentina Kale Chips Market Revenue (Million) Forecast, by Application 2019 & 2032
- Table 122: Argentina Kale Chips Market Volume (K Tons) Forecast, by Application 2019 & 2032
- Table 123: Rest of South America Kale Chips Market Revenue (Million) Forecast, by Application 2019 & 2032
- Table 124: Rest of South America Kale Chips Market Volume (K Tons) Forecast, by Application 2019 & 2032
- Table 125: Global Kale Chips Market Revenue Million Forecast, by Product Type 2019 & 2032
- Table 126: Global Kale Chips Market Volume K Tons Forecast, by Product Type 2019 & 2032
- Table 127: Global Kale Chips Market Revenue Million Forecast, by Distribution Channel 2019 & 2032
- Table 128: Global Kale Chips Market Volume K Tons Forecast, by Distribution Channel 2019 & 2032
- Table 129: Global Kale Chips Market Revenue Million Forecast, by Country 2019 & 2032
- Table 130: Global Kale Chips Market Volume K Tons Forecast, by Country 2019 & 2032
- Table 131: United Arab Emirates Kale Chips Market Revenue (Million) Forecast, by Application 2019 & 2032
- Table 132: United Arab Emirates Kale Chips Market Volume (K Tons) Forecast, by Application 2019 & 2032
- Table 133: South Africa Kale Chips Market Revenue (Million) Forecast, by Application 2019 & 2032
- Table 134: South Africa Kale Chips Market Volume (K Tons) Forecast, by Application 2019 & 2032
- Table 135: Rest of Middle East and Africa Kale Chips Market Revenue (Million) Forecast, by Application 2019 & 2032
- Table 136: Rest of Middle East and Africa Kale Chips Market Volume (K Tons) Forecast, by Application 2019 & 2032
Frequently Asked Questions
1. What is the projected Compound Annual Growth Rate (CAGR) of the Kale Chips Market?
The projected CAGR is approximately 8.23%.
2. Which companies are prominent players in the Kale Chips Market?
Key companies in the market include Brad's Plant Based LLC, General Mills Inc, Simply 7 Snacks LLC, Vermont Kale Chips, Lydia's Foods Inc, Healthy Crunch, The Green Snack Co *List Not Exhaustive, The Angel Kale Company, The Kale Factory, GlaxoSmithKline PLC.
3. What are the main segments of the Kale Chips Market?
The market segments include Product Type, Distribution Channel.
4. Can you provide details about the market size?
The market size is estimated to be USD 252.7 Million as of 2022.
5. What are some drivers contributing to market growth?
Increasing Demand for Clean Label Ingredients; Growing Health Consciousness of Consumers.
6. What are the notable trends driving market growth?
Increasing demand of Vegetable and Healthy Chips.
7. Are there any restraints impacting market growth?
Higher Manufacturing Cost.
8. Can you provide examples of recent developments in the market?
In September 2020, Ecoideas announced the launch of Solar Raw's Kaley's Kale Chips in four new flavors to meet the growing demand for nutritionally dense and naturally delicious plant based snacks that appeal to mainstream snacker.
9. What pricing options are available for accessing the report?
Pricing options include single-user, multi-user, and enterprise licenses priced at USD 4750, USD 5250, and USD 8750 respectively.
10. Is the market size provided in terms of value or volume?
The market size is provided in terms of value, measured in Million and volume, measured in K Tons.
11. Are there any specific market keywords associated with the report?
Yes, the market keyword associated with the report is "Kale Chips Market," which aids in identifying and referencing the specific market segment covered.
12. How do I determine which pricing option suits my needs best?
The pricing options vary based on user requirements and access needs. Individual users may opt for single-user licenses, while businesses requiring broader access may choose multi-user or enterprise licenses for cost-effective access to the report.
13. Are there any additional resources or data provided in the Kale Chips Market report?
While the report offers comprehensive insights, it's advisable to review the specific contents or supplementary materials provided to ascertain if additional resources or data are available.
14. How can I stay updated on further developments or reports in the Kale Chips Market?
To stay informed about further developments, trends, and reports in the Kale Chips Market, consider subscribing to industry newsletters, following relevant companies and organizations, or regularly checking reputable industry news sources and publications.
Methodology
Step 1 - Identification of Relevant Samples Size from Population Database


Step 2 - Approaches for Defining Global Market Size (Value, Volume* & Price*)

Note*: In applicable scenarios
Step 3 - Data Sources
Primary Research
- Web Analytics
- Survey Reports
- Research Institute
- Latest Research Reports
- Opinion Leaders
Secondary Research
- Annual Reports
- White Paper
- Latest Press Release
- Industry Association
- Paid Database
- Investor Presentations

Step 4 - Data Triangulation
Involves using different sources of information in order to increase the validity of a study
These sources are likely to be stakeholders in a program - participants, other researchers, program staff, other community members, and so on.
Then we put all data in single framework & apply various statistical tools to find out the dynamic on the market.
During the analysis stage, feedback from the stakeholder groups would be compared to determine areas of agreement as well as areas of divergence


