
Key Insights
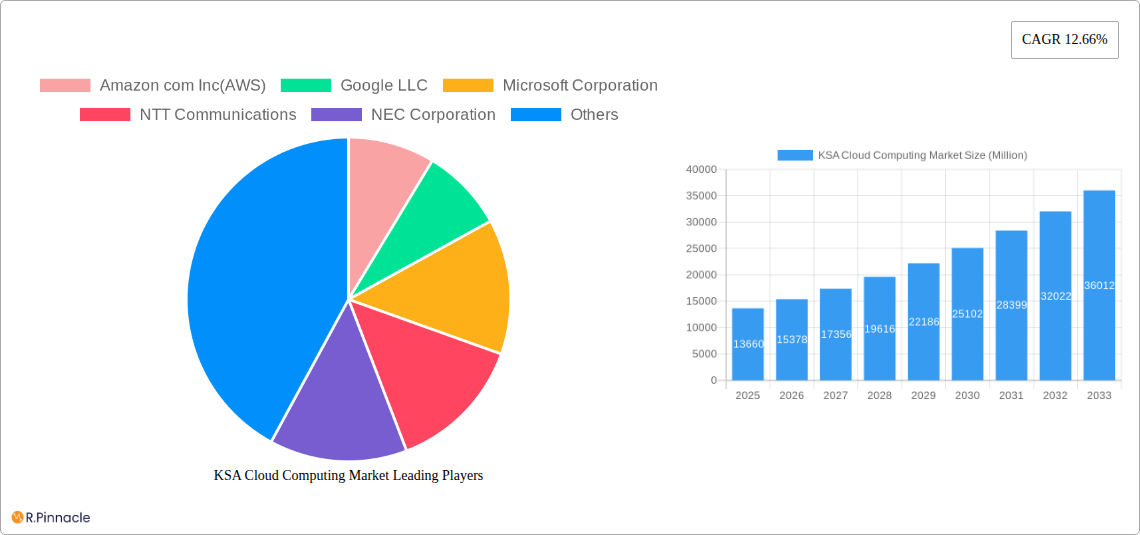
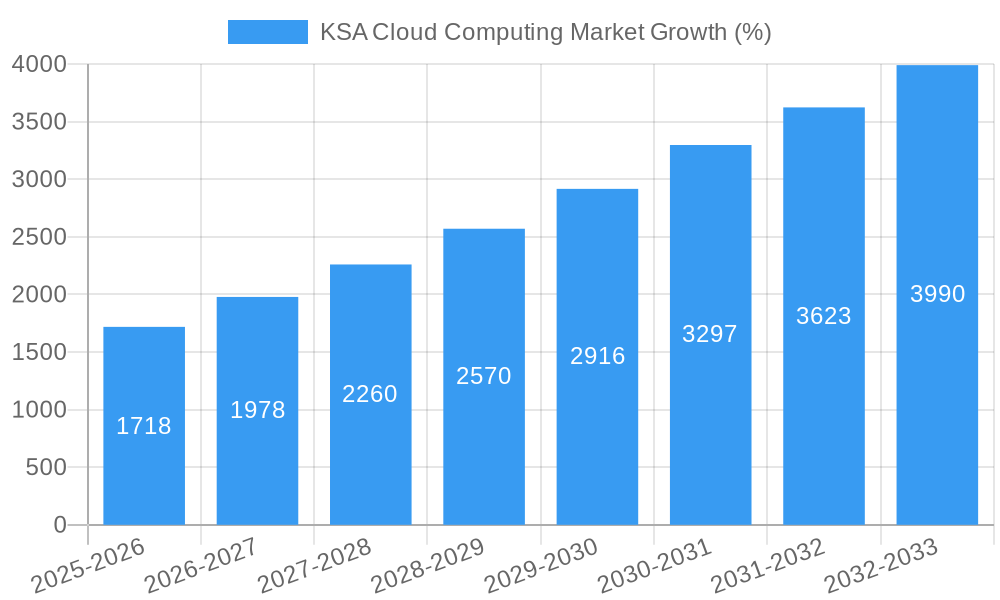
The Kingdom of Saudi Arabia (KSA) cloud computing market is experiencing robust growth, driven by the nation's ambitious Vision 2030 initiative, which aims to diversify the economy and foster technological advancement. The market, valued at $13.66 billion in 2025, is projected to exhibit a Compound Annual Growth Rate (CAGR) of 12.66% from 2025 to 2033. This expansion is fueled by several key factors. Increased government investment in digital infrastructure, coupled with the rising adoption of cloud-based solutions across various sectors – including government, finance, healthcare, and education – are major catalysts. Furthermore, the increasing demand for data storage, processing, and analytics, along with the growing need for scalability and cost optimization, is further propelling market growth. The prevalence of big data analytics and the emergence of advanced technologies like artificial intelligence (AI) and the Internet of Things (IoT) are also contributing significantly to the KSA cloud computing market's expansion.
However, challenges remain. Data security concerns and regulatory hurdles are significant restraints. Ensuring robust cybersecurity measures and establishing clear data privacy regulations are crucial for sustaining the market's momentum. The competitive landscape is highly concentrated, with major players like Amazon Web Services (AWS), Microsoft Azure, Google Cloud Platform (GCP), and Alibaba Cloud vying for market share. These companies are actively investing in local data centers and partnerships to cater to the specific needs of the KSA market. Despite these challenges, the long-term outlook for the KSA cloud computing market remains positive, driven by ongoing digital transformation initiatives and increasing technological adoption across all sectors. The market segmentation likely includes Infrastructure as a Service (IaaS), Platform as a Service (PaaS), and Software as a Service (SaaS), with IaaS potentially holding the largest share due to initial infrastructure development needs.
KSA Cloud Computing Market: A Comprehensive Report (2019-2033)
This in-depth report provides a comprehensive analysis of the Kingdom of Saudi Arabia (KSA) cloud computing market, offering invaluable insights for industry professionals, investors, and strategic planners. Covering the period from 2019 to 2033, with a focus on 2025, this report unveils the market's structure, dynamics, key players, and future outlook. Benefit from actionable data and forecasts to navigate the rapidly evolving KSA cloud landscape.
KSA Cloud Computing Market Structure & Innovation Trends
This section analyzes the KSA cloud computing market's competitive landscape, focusing on market concentration, innovation drivers, regulatory frameworks, and M&A activities. The study period is 2019-2024, with 2025 as the base year and a forecast period of 2025-2033.
The KSA cloud market exhibits a moderately concentrated structure with several global giants and local players vying for market share. Major players such as Amazon com Inc(AWS), Google LLC, Microsoft Corporation, and NTT Communications hold significant market share, but local and regional players are also gaining traction. The market share of these companies is predicted to be xx% in 2025. The estimated total market size in 2025 is xx Million, projected to reach xx Million by 2033.
- Innovation Drivers: Government initiatives promoting digital transformation, increasing adoption of AI and machine learning, and the need for enhanced data security are key innovation drivers.
- Regulatory Frameworks: The Saudi government’s focus on data sovereignty and cybersecurity regulations significantly impacts market dynamics.
- Product Substitutes: On-premise solutions represent a key substitute, although cloud adoption is accelerating rapidly.
- End-User Demographics: The market comprises diverse end-users, including government bodies, financial institutions, telecommunications companies, healthcare providers, and enterprises across various sectors.
- M&A Activities: The KSA cloud computing sector has witnessed a moderate level of M&A activity in recent years, with deal values averaging approximately xx Million per transaction (2019-2024). Further consolidation is anticipated as larger players seek to expand their footprint. Examples include xx.
KSA Cloud Computing Market Dynamics & Trends
This section explores the key dynamics and trends shaping the KSA cloud computing market. The compound annual growth rate (CAGR) for the period 2025-2033 is estimated at xx%.
Market growth is propelled by the Kingdom's Vision 2030 initiative, which prioritizes technological advancement and digital transformation. Government investments in digital infrastructure and supportive regulatory policies have accelerated cloud adoption across various sectors. Increasing demand for scalable and cost-effective IT solutions, coupled with the rising adoption of cloud-native applications and services, fuels market expansion. Technological disruptions, such as advancements in artificial intelligence (AI), machine learning (ML), and edge computing, continue to shape the market landscape, creating opportunities for innovation and market penetration. Consumer preferences are shifting towards flexible, on-demand cloud services, further driving market expansion. Competitive dynamics are characterized by increasing competition among global cloud providers and local players, leading to price wars and service innovations. Market penetration rates are on an upward trajectory, currently estimated at xx% in 2025, with projected growth to xx% by 2033.
Dominant Regions & Segments in KSA Cloud Computing Market
The Riyadh region currently holds the dominant position in the KSA cloud computing market. The region's strong economic activity, extensive ICT infrastructure, and concentration of businesses contribute to its market dominance.
- Key Drivers for Riyadh's Dominance:
- Concentrated business activity and significant government investment in digital infrastructure.
- Presence of major data centers and cloud service provider facilities.
- Strong talent pool of skilled IT professionals.
Other major cities like Jeddah and Dammam also contribute to the overall market growth. However, Riyadh's dominance is expected to persist, although the growth gap with other regions is expected to shrink slightly over the forecast period. The dominance of specific segments is heavily influenced by Vision 2030 initiatives. For example, the healthcare and finance sectors are displaying accelerated cloud adoption.
KSA Cloud Computing Market Product Innovations
Recent product innovations include enhanced AI and machine learning capabilities embedded within cloud platforms, improved data sovereignty and security features tailored to local regulations, and the emergence of cloud-based solutions specifically designed to support Saudi Arabia's unique digital transformation goals. These innovations cater to the increasing demand for customized, secure, and cost-effective cloud solutions in the KSA market. The focus is on solutions that align with the country's digital transformation vision.
Report Scope & Segmentation Analysis
This report segments the KSA cloud computing market based on several factors, including service model (IaaS, PaaS, SaaS), deployment model (public, private, hybrid, multi-cloud), organization size (large enterprises, SMEs), and industry vertical (government, BFSI, healthcare, retail, etc.). Each segment shows varying growth rates, market sizes, and competitive intensities. The public cloud segment currently dominates, with projected growth exceeding that of private and hybrid cloud deployments. Similarly, large enterprises are leading in cloud adoption, but the SME sector is exhibiting rapid growth.
Key Drivers of KSA Cloud Computing Market Growth
The KSA cloud computing market is driven by several key factors, including the government's strong commitment to digital transformation under Vision 2030, increased government investments in digital infrastructure development, the growing need for enhanced data security and compliance with data sovereignty regulations, and the rising adoption of advanced technologies such as AI, ML, and big data analytics across various industries. The expanding digital economy and the emergence of innovative cloud-based solutions are also contributing to market growth.
Challenges in the KSA Cloud Computing Market Sector
Challenges include the need to address skills gaps in the IT workforce, concerns about data security and privacy, the relatively high cost of cloud services compared to traditional IT infrastructure, and ensuring effective compliance with the evolving regulatory landscape. These factors can significantly impact market expansion. The estimated impact of these challenges on overall market growth is approximately xx% reduction.
Emerging Opportunities in KSA Cloud Computing Market
Significant opportunities lie in the growth of edge computing, the expansion of cloud-based services in sectors like healthcare and education, the rise of cloud-native applications and serverless computing, and the increasing adoption of AI and ML solutions to address specific challenges within various industries. Government initiatives promoting digital entrepreneurship are further opening opportunities.
Leading Players in the KSA Cloud Computing Market Market
- Amazon com Inc(AWS)
- Google LLC
- Microsoft Corporation
- NTT Communications
- NEC Corporation
- Rackspace Technology Inc
- Oracle Corporation
- IBM Corporation
- Alibaba Cloud (Aliyun)
- Salesforce Inc
- SAP SE
- List Not Exhaustive
Key Developments in KSA Cloud Computing Market Industry
- August 2024: Google Cloud enhances data sovereignty, security, and AI features in its Dammam region, supporting digital transformation for organizations, particularly multinational corporations.
- March 2024: Amazon Web Services (AWS) announces plans to establish an AWS Region in KSA by 2026, investing over USD 5.3 Billion, boosting local application development and data residency.
- April 2024: Informatica launches its AI-driven Intelligent Data Management Cloud (IDMC) in Saudi Arabia, establishing a Point of Delivery (PoD) in Riyadh, strengthening its Middle East presence.
- March 2024: YASH Technologies and Huawei Cloud partner to deliver cloud computing, AI, and data analytics solutions in the MENA region, significantly impacting the KSA market.
Future Outlook for KSA Cloud Computing Market Market
The KSA cloud computing market is poised for robust growth, driven by continued government support, increasing digitalization across sectors, and the emergence of innovative cloud-based solutions. Strategic opportunities exist for cloud providers to focus on providing tailored solutions that meet the unique needs of the KSA market, prioritizing data sovereignty, security, and alignment with Vision 2030 objectives. This strong growth is expected to continue throughout the forecast period.
KSA Cloud Computing Market Segmentation
-
1. Type
-
1.1. Public Cloud
- 1.1.1. IaaS
- 1.1.2. PaaS
- 1.1.3. SaaS
- 1.2. Private Cloud
- 1.3. Hybrid Cloud
-
1.1. Public Cloud
-
2. Organization Size
- 2.1. SMEs
- 2.2. Large Enterprises
-
3. End-user Industries
- 3.1. Manufacturing
- 3.2. Education
- 3.3. Retail
- 3.4. Transportation and Logistics
- 3.5. Healthcare
- 3.6. BFSI
- 3.7. Telecom and IT
- 3.8. Government and Public Sector
- 3.9. Other En
KSA Cloud Computing Market Segmentation By Geography
-
1. North America
- 1.1. United States
- 1.2. Canada
- 1.3. Mexico
-
2. South America
- 2.1. Brazil
- 2.2. Argentina
- 2.3. Rest of South America
-
3. Europe
- 3.1. United Kingdom
- 3.2. Germany
- 3.3. France
- 3.4. Italy
- 3.5. Spain
- 3.6. Russia
- 3.7. Benelux
- 3.8. Nordics
- 3.9. Rest of Europe
-
4. Middle East & Africa
- 4.1. Turkey
- 4.2. Israel
- 4.3. GCC
- 4.4. North Africa
- 4.5. South Africa
- 4.6. Rest of Middle East & Africa
-
5. Asia Pacific
- 5.1. China
- 5.2. India
- 5.3. Japan
- 5.4. South Korea
- 5.5. ASEAN
- 5.6. Oceania
- 5.7. Rest of Asia Pacific
KSA Cloud Computing Market REPORT HIGHLIGHTS
| Aspects | Details |
|---|---|
| Study Period | 2019-2033 |
| Base Year | 2024 |
| Estimated Year | 2025 |
| Forecast Period | 2025-2033 |
| Historical Period | 2019-2024 |
| Growth Rate | CAGR of 12.66% from 2019-2033 |
| Segmentation |
|
Table of Contents
- 1. Introduction
- 1.1. Research Scope
- 1.2. Market Segmentation
- 1.3. Research Methodology
- 1.4. Definitions and Assumptions
- 2. Executive Summary
- 2.1. Introduction
- 3. Market Dynamics
- 3.1. Introduction
- 3.2. Market Drivers
- 3.2.1. Robust Shift Towards Digital Transformation Across the Country; Data Privacy Concerns Are Driving Increased Adoption Of Public Cloud Services
- 3.3. Market Restrains
- 3.3.1. Robust Shift Towards Digital Transformation Across the Country; Data Privacy Concerns Are Driving Increased Adoption Of Public Cloud Services
- 3.4. Market Trends
- 3.4.1. Robust Shift Towards Digital Transformation Across the Country
- 4. Market Factor Analysis
- 4.1. Porters Five Forces
- 4.2. Supply/Value Chain
- 4.3. PESTEL analysis
- 4.4. Market Entropy
- 4.5. Patent/Trademark Analysis
- 5. Global KSA Cloud Computing Market Analysis, Insights and Forecast, 2019-2031
- 5.1. Market Analysis, Insights and Forecast - by Type
- 5.1.1. Public Cloud
- 5.1.1.1. IaaS
- 5.1.1.2. PaaS
- 5.1.1.3. SaaS
- 5.1.2. Private Cloud
- 5.1.3. Hybrid Cloud
- 5.1.1. Public Cloud
- 5.2. Market Analysis, Insights and Forecast - by Organization Size
- 5.2.1. SMEs
- 5.2.2. Large Enterprises
- 5.3. Market Analysis, Insights and Forecast - by End-user Industries
- 5.3.1. Manufacturing
- 5.3.2. Education
- 5.3.3. Retail
- 5.3.4. Transportation and Logistics
- 5.3.5. Healthcare
- 5.3.6. BFSI
- 5.3.7. Telecom and IT
- 5.3.8. Government and Public Sector
- 5.3.9. Other En
- 5.4. Market Analysis, Insights and Forecast - by Region
- 5.4.1. North America
- 5.4.2. South America
- 5.4.3. Europe
- 5.4.4. Middle East & Africa
- 5.4.5. Asia Pacific
- 5.1. Market Analysis, Insights and Forecast - by Type
- 6. North America KSA Cloud Computing Market Analysis, Insights and Forecast, 2019-2031
- 6.1. Market Analysis, Insights and Forecast - by Type
- 6.1.1. Public Cloud
- 6.1.1.1. IaaS
- 6.1.1.2. PaaS
- 6.1.1.3. SaaS
- 6.1.2. Private Cloud
- 6.1.3. Hybrid Cloud
- 6.1.1. Public Cloud
- 6.2. Market Analysis, Insights and Forecast - by Organization Size
- 6.2.1. SMEs
- 6.2.2. Large Enterprises
- 6.3. Market Analysis, Insights and Forecast - by End-user Industries
- 6.3.1. Manufacturing
- 6.3.2. Education
- 6.3.3. Retail
- 6.3.4. Transportation and Logistics
- 6.3.5. Healthcare
- 6.3.6. BFSI
- 6.3.7. Telecom and IT
- 6.3.8. Government and Public Sector
- 6.3.9. Other En
- 6.1. Market Analysis, Insights and Forecast - by Type
- 7. South America KSA Cloud Computing Market Analysis, Insights and Forecast, 2019-2031
- 7.1. Market Analysis, Insights and Forecast - by Type
- 7.1.1. Public Cloud
- 7.1.1.1. IaaS
- 7.1.1.2. PaaS
- 7.1.1.3. SaaS
- 7.1.2. Private Cloud
- 7.1.3. Hybrid Cloud
- 7.1.1. Public Cloud
- 7.2. Market Analysis, Insights and Forecast - by Organization Size
- 7.2.1. SMEs
- 7.2.2. Large Enterprises
- 7.3. Market Analysis, Insights and Forecast - by End-user Industries
- 7.3.1. Manufacturing
- 7.3.2. Education
- 7.3.3. Retail
- 7.3.4. Transportation and Logistics
- 7.3.5. Healthcare
- 7.3.6. BFSI
- 7.3.7. Telecom and IT
- 7.3.8. Government and Public Sector
- 7.3.9. Other En
- 7.1. Market Analysis, Insights and Forecast - by Type
- 8. Europe KSA Cloud Computing Market Analysis, Insights and Forecast, 2019-2031
- 8.1. Market Analysis, Insights and Forecast - by Type
- 8.1.1. Public Cloud
- 8.1.1.1. IaaS
- 8.1.1.2. PaaS
- 8.1.1.3. SaaS
- 8.1.2. Private Cloud
- 8.1.3. Hybrid Cloud
- 8.1.1. Public Cloud
- 8.2. Market Analysis, Insights and Forecast - by Organization Size
- 8.2.1. SMEs
- 8.2.2. Large Enterprises
- 8.3. Market Analysis, Insights and Forecast - by End-user Industries
- 8.3.1. Manufacturing
- 8.3.2. Education
- 8.3.3. Retail
- 8.3.4. Transportation and Logistics
- 8.3.5. Healthcare
- 8.3.6. BFSI
- 8.3.7. Telecom and IT
- 8.3.8. Government and Public Sector
- 8.3.9. Other En
- 8.1. Market Analysis, Insights and Forecast - by Type
- 9. Middle East & Africa KSA Cloud Computing Market Analysis, Insights and Forecast, 2019-2031
- 9.1. Market Analysis, Insights and Forecast - by Type
- 9.1.1. Public Cloud
- 9.1.1.1. IaaS
- 9.1.1.2. PaaS
- 9.1.1.3. SaaS
- 9.1.2. Private Cloud
- 9.1.3. Hybrid Cloud
- 9.1.1. Public Cloud
- 9.2. Market Analysis, Insights and Forecast - by Organization Size
- 9.2.1. SMEs
- 9.2.2. Large Enterprises
- 9.3. Market Analysis, Insights and Forecast - by End-user Industries
- 9.3.1. Manufacturing
- 9.3.2. Education
- 9.3.3. Retail
- 9.3.4. Transportation and Logistics
- 9.3.5. Healthcare
- 9.3.6. BFSI
- 9.3.7. Telecom and IT
- 9.3.8. Government and Public Sector
- 9.3.9. Other En
- 9.1. Market Analysis, Insights and Forecast - by Type
- 10. Asia Pacific KSA Cloud Computing Market Analysis, Insights and Forecast, 2019-2031
- 10.1. Market Analysis, Insights and Forecast - by Type
- 10.1.1. Public Cloud
- 10.1.1.1. IaaS
- 10.1.1.2. PaaS
- 10.1.1.3. SaaS
- 10.1.2. Private Cloud
- 10.1.3. Hybrid Cloud
- 10.1.1. Public Cloud
- 10.2. Market Analysis, Insights and Forecast - by Organization Size
- 10.2.1. SMEs
- 10.2.2. Large Enterprises
- 10.3. Market Analysis, Insights and Forecast - by End-user Industries
- 10.3.1. Manufacturing
- 10.3.2. Education
- 10.3.3. Retail
- 10.3.4. Transportation and Logistics
- 10.3.5. Healthcare
- 10.3.6. BFSI
- 10.3.7. Telecom and IT
- 10.3.8. Government and Public Sector
- 10.3.9. Other En
- 10.1. Market Analysis, Insights and Forecast - by Type
- 11. Competitive Analysis
- 11.1. Global Market Share Analysis 2024
- 11.2. Company Profiles
- 11.2.1 Amazon com Inc(AWS)
- 11.2.1.1. Overview
- 11.2.1.2. Products
- 11.2.1.3. SWOT Analysis
- 11.2.1.4. Recent Developments
- 11.2.1.5. Financials (Based on Availability)
- 11.2.2 Google LLC
- 11.2.2.1. Overview
- 11.2.2.2. Products
- 11.2.2.3. SWOT Analysis
- 11.2.2.4. Recent Developments
- 11.2.2.5. Financials (Based on Availability)
- 11.2.3 Microsoft Corporation
- 11.2.3.1. Overview
- 11.2.3.2. Products
- 11.2.3.3. SWOT Analysis
- 11.2.3.4. Recent Developments
- 11.2.3.5. Financials (Based on Availability)
- 11.2.4 NTT Communications
- 11.2.4.1. Overview
- 11.2.4.2. Products
- 11.2.4.3. SWOT Analysis
- 11.2.4.4. Recent Developments
- 11.2.4.5. Financials (Based on Availability)
- 11.2.5 NEC Corporation
- 11.2.5.1. Overview
- 11.2.5.2. Products
- 11.2.5.3. SWOT Analysis
- 11.2.5.4. Recent Developments
- 11.2.5.5. Financials (Based on Availability)
- 11.2.6 Rackspace Technology Inc
- 11.2.6.1. Overview
- 11.2.6.2. Products
- 11.2.6.3. SWOT Analysis
- 11.2.6.4. Recent Developments
- 11.2.6.5. Financials (Based on Availability)
- 11.2.7 Oracle Corporation
- 11.2.7.1. Overview
- 11.2.7.2. Products
- 11.2.7.3. SWOT Analysis
- 11.2.7.4. Recent Developments
- 11.2.7.5. Financials (Based on Availability)
- 11.2.8 IBM Corporation
- 11.2.8.1. Overview
- 11.2.8.2. Products
- 11.2.8.3. SWOT Analysis
- 11.2.8.4. Recent Developments
- 11.2.8.5. Financials (Based on Availability)
- 11.2.9 Alibaba Cloud (Aliyun)
- 11.2.9.1. Overview
- 11.2.9.2. Products
- 11.2.9.3. SWOT Analysis
- 11.2.9.4. Recent Developments
- 11.2.9.5. Financials (Based on Availability)
- 11.2.10 Salesforce Inc
- 11.2.10.1. Overview
- 11.2.10.2. Products
- 11.2.10.3. SWOT Analysis
- 11.2.10.4. Recent Developments
- 11.2.10.5. Financials (Based on Availability)
- 11.2.11 SAP SE*List Not Exhaustive
- 11.2.11.1. Overview
- 11.2.11.2. Products
- 11.2.11.3. SWOT Analysis
- 11.2.11.4. Recent Developments
- 11.2.11.5. Financials (Based on Availability)
- 11.2.1 Amazon com Inc(AWS)
List of Figures
- Figure 1: Global KSA Cloud Computing Market Revenue Breakdown (Million, %) by Region 2024 & 2032
- Figure 2: Global KSA Cloud Computing Market Volume Breakdown (Billion, %) by Region 2024 & 2032
- Figure 3: North America KSA Cloud Computing Market Revenue (Million), by Type 2024 & 2032
- Figure 4: North America KSA Cloud Computing Market Volume (Billion), by Type 2024 & 2032
- Figure 5: North America KSA Cloud Computing Market Revenue Share (%), by Type 2024 & 2032
- Figure 6: North America KSA Cloud Computing Market Volume Share (%), by Type 2024 & 2032
- Figure 7: North America KSA Cloud Computing Market Revenue (Million), by Organization Size 2024 & 2032
- Figure 8: North America KSA Cloud Computing Market Volume (Billion), by Organization Size 2024 & 2032
- Figure 9: North America KSA Cloud Computing Market Revenue Share (%), by Organization Size 2024 & 2032
- Figure 10: North America KSA Cloud Computing Market Volume Share (%), by Organization Size 2024 & 2032
- Figure 11: North America KSA Cloud Computing Market Revenue (Million), by End-user Industries 2024 & 2032
- Figure 12: North America KSA Cloud Computing Market Volume (Billion), by End-user Industries 2024 & 2032
- Figure 13: North America KSA Cloud Computing Market Revenue Share (%), by End-user Industries 2024 & 2032
- Figure 14: North America KSA Cloud Computing Market Volume Share (%), by End-user Industries 2024 & 2032
- Figure 15: North America KSA Cloud Computing Market Revenue (Million), by Country 2024 & 2032
- Figure 16: North America KSA Cloud Computing Market Volume (Billion), by Country 2024 & 2032
- Figure 17: North America KSA Cloud Computing Market Revenue Share (%), by Country 2024 & 2032
- Figure 18: North America KSA Cloud Computing Market Volume Share (%), by Country 2024 & 2032
- Figure 19: South America KSA Cloud Computing Market Revenue (Million), by Type 2024 & 2032
- Figure 20: South America KSA Cloud Computing Market Volume (Billion), by Type 2024 & 2032
- Figure 21: South America KSA Cloud Computing Market Revenue Share (%), by Type 2024 & 2032
- Figure 22: South America KSA Cloud Computing Market Volume Share (%), by Type 2024 & 2032
- Figure 23: South America KSA Cloud Computing Market Revenue (Million), by Organization Size 2024 & 2032
- Figure 24: South America KSA Cloud Computing Market Volume (Billion), by Organization Size 2024 & 2032
- Figure 25: South America KSA Cloud Computing Market Revenue Share (%), by Organization Size 2024 & 2032
- Figure 26: South America KSA Cloud Computing Market Volume Share (%), by Organization Size 2024 & 2032
- Figure 27: South America KSA Cloud Computing Market Revenue (Million), by End-user Industries 2024 & 2032
- Figure 28: South America KSA Cloud Computing Market Volume (Billion), by End-user Industries 2024 & 2032
- Figure 29: South America KSA Cloud Computing Market Revenue Share (%), by End-user Industries 2024 & 2032
- Figure 30: South America KSA Cloud Computing Market Volume Share (%), by End-user Industries 2024 & 2032
- Figure 31: South America KSA Cloud Computing Market Revenue (Million), by Country 2024 & 2032
- Figure 32: South America KSA Cloud Computing Market Volume (Billion), by Country 2024 & 2032
- Figure 33: South America KSA Cloud Computing Market Revenue Share (%), by Country 2024 & 2032
- Figure 34: South America KSA Cloud Computing Market Volume Share (%), by Country 2024 & 2032
- Figure 35: Europe KSA Cloud Computing Market Revenue (Million), by Type 2024 & 2032
- Figure 36: Europe KSA Cloud Computing Market Volume (Billion), by Type 2024 & 2032
- Figure 37: Europe KSA Cloud Computing Market Revenue Share (%), by Type 2024 & 2032
- Figure 38: Europe KSA Cloud Computing Market Volume Share (%), by Type 2024 & 2032
- Figure 39: Europe KSA Cloud Computing Market Revenue (Million), by Organization Size 2024 & 2032
- Figure 40: Europe KSA Cloud Computing Market Volume (Billion), by Organization Size 2024 & 2032
- Figure 41: Europe KSA Cloud Computing Market Revenue Share (%), by Organization Size 2024 & 2032
- Figure 42: Europe KSA Cloud Computing Market Volume Share (%), by Organization Size 2024 & 2032
- Figure 43: Europe KSA Cloud Computing Market Revenue (Million), by End-user Industries 2024 & 2032
- Figure 44: Europe KSA Cloud Computing Market Volume (Billion), by End-user Industries 2024 & 2032
- Figure 45: Europe KSA Cloud Computing Market Revenue Share (%), by End-user Industries 2024 & 2032
- Figure 46: Europe KSA Cloud Computing Market Volume Share (%), by End-user Industries 2024 & 2032
- Figure 47: Europe KSA Cloud Computing Market Revenue (Million), by Country 2024 & 2032
- Figure 48: Europe KSA Cloud Computing Market Volume (Billion), by Country 2024 & 2032
- Figure 49: Europe KSA Cloud Computing Market Revenue Share (%), by Country 2024 & 2032
- Figure 50: Europe KSA Cloud Computing Market Volume Share (%), by Country 2024 & 2032
- Figure 51: Middle East & Africa KSA Cloud Computing Market Revenue (Million), by Type 2024 & 2032
- Figure 52: Middle East & Africa KSA Cloud Computing Market Volume (Billion), by Type 2024 & 2032
- Figure 53: Middle East & Africa KSA Cloud Computing Market Revenue Share (%), by Type 2024 & 2032
- Figure 54: Middle East & Africa KSA Cloud Computing Market Volume Share (%), by Type 2024 & 2032
- Figure 55: Middle East & Africa KSA Cloud Computing Market Revenue (Million), by Organization Size 2024 & 2032
- Figure 56: Middle East & Africa KSA Cloud Computing Market Volume (Billion), by Organization Size 2024 & 2032
- Figure 57: Middle East & Africa KSA Cloud Computing Market Revenue Share (%), by Organization Size 2024 & 2032
- Figure 58: Middle East & Africa KSA Cloud Computing Market Volume Share (%), by Organization Size 2024 & 2032
- Figure 59: Middle East & Africa KSA Cloud Computing Market Revenue (Million), by End-user Industries 2024 & 2032
- Figure 60: Middle East & Africa KSA Cloud Computing Market Volume (Billion), by End-user Industries 2024 & 2032
- Figure 61: Middle East & Africa KSA Cloud Computing Market Revenue Share (%), by End-user Industries 2024 & 2032
- Figure 62: Middle East & Africa KSA Cloud Computing Market Volume Share (%), by End-user Industries 2024 & 2032
- Figure 63: Middle East & Africa KSA Cloud Computing Market Revenue (Million), by Country 2024 & 2032
- Figure 64: Middle East & Africa KSA Cloud Computing Market Volume (Billion), by Country 2024 & 2032
- Figure 65: Middle East & Africa KSA Cloud Computing Market Revenue Share (%), by Country 2024 & 2032
- Figure 66: Middle East & Africa KSA Cloud Computing Market Volume Share (%), by Country 2024 & 2032
- Figure 67: Asia Pacific KSA Cloud Computing Market Revenue (Million), by Type 2024 & 2032
- Figure 68: Asia Pacific KSA Cloud Computing Market Volume (Billion), by Type 2024 & 2032
- Figure 69: Asia Pacific KSA Cloud Computing Market Revenue Share (%), by Type 2024 & 2032
- Figure 70: Asia Pacific KSA Cloud Computing Market Volume Share (%), by Type 2024 & 2032
- Figure 71: Asia Pacific KSA Cloud Computing Market Revenue (Million), by Organization Size 2024 & 2032
- Figure 72: Asia Pacific KSA Cloud Computing Market Volume (Billion), by Organization Size 2024 & 2032
- Figure 73: Asia Pacific KSA Cloud Computing Market Revenue Share (%), by Organization Size 2024 & 2032
- Figure 74: Asia Pacific KSA Cloud Computing Market Volume Share (%), by Organization Size 2024 & 2032
- Figure 75: Asia Pacific KSA Cloud Computing Market Revenue (Million), by End-user Industries 2024 & 2032
- Figure 76: Asia Pacific KSA Cloud Computing Market Volume (Billion), by End-user Industries 2024 & 2032
- Figure 77: Asia Pacific KSA Cloud Computing Market Revenue Share (%), by End-user Industries 2024 & 2032
- Figure 78: Asia Pacific KSA Cloud Computing Market Volume Share (%), by End-user Industries 2024 & 2032
- Figure 79: Asia Pacific KSA Cloud Computing Market Revenue (Million), by Country 2024 & 2032
- Figure 80: Asia Pacific KSA Cloud Computing Market Volume (Billion), by Country 2024 & 2032
- Figure 81: Asia Pacific KSA Cloud Computing Market Revenue Share (%), by Country 2024 & 2032
- Figure 82: Asia Pacific KSA Cloud Computing Market Volume Share (%), by Country 2024 & 2032
List of Tables
- Table 1: Global KSA Cloud Computing Market Revenue Million Forecast, by Region 2019 & 2032
- Table 2: Global KSA Cloud Computing Market Volume Billion Forecast, by Region 2019 & 2032
- Table 3: Global KSA Cloud Computing Market Revenue Million Forecast, by Type 2019 & 2032
- Table 4: Global KSA Cloud Computing Market Volume Billion Forecast, by Type 2019 & 2032
- Table 5: Global KSA Cloud Computing Market Revenue Million Forecast, by Organization Size 2019 & 2032
- Table 6: Global KSA Cloud Computing Market Volume Billion Forecast, by Organization Size 2019 & 2032
- Table 7: Global KSA Cloud Computing Market Revenue Million Forecast, by End-user Industries 2019 & 2032
- Table 8: Global KSA Cloud Computing Market Volume Billion Forecast, by End-user Industries 2019 & 2032
- Table 9: Global KSA Cloud Computing Market Revenue Million Forecast, by Region 2019 & 2032
- Table 10: Global KSA Cloud Computing Market Volume Billion Forecast, by Region 2019 & 2032
- Table 11: Global KSA Cloud Computing Market Revenue Million Forecast, by Type 2019 & 2032
- Table 12: Global KSA Cloud Computing Market Volume Billion Forecast, by Type 2019 & 2032
- Table 13: Global KSA Cloud Computing Market Revenue Million Forecast, by Organization Size 2019 & 2032
- Table 14: Global KSA Cloud Computing Market Volume Billion Forecast, by Organization Size 2019 & 2032
- Table 15: Global KSA Cloud Computing Market Revenue Million Forecast, by End-user Industries 2019 & 2032
- Table 16: Global KSA Cloud Computing Market Volume Billion Forecast, by End-user Industries 2019 & 2032
- Table 17: Global KSA Cloud Computing Market Revenue Million Forecast, by Country 2019 & 2032
- Table 18: Global KSA Cloud Computing Market Volume Billion Forecast, by Country 2019 & 2032
- Table 19: United States KSA Cloud Computing Market Revenue (Million) Forecast, by Application 2019 & 2032
- Table 20: United States KSA Cloud Computing Market Volume (Billion) Forecast, by Application 2019 & 2032
- Table 21: Canada KSA Cloud Computing Market Revenue (Million) Forecast, by Application 2019 & 2032
- Table 22: Canada KSA Cloud Computing Market Volume (Billion) Forecast, by Application 2019 & 2032
- Table 23: Mexico KSA Cloud Computing Market Revenue (Million) Forecast, by Application 2019 & 2032
- Table 24: Mexico KSA Cloud Computing Market Volume (Billion) Forecast, by Application 2019 & 2032
- Table 25: Global KSA Cloud Computing Market Revenue Million Forecast, by Type 2019 & 2032
- Table 26: Global KSA Cloud Computing Market Volume Billion Forecast, by Type 2019 & 2032
- Table 27: Global KSA Cloud Computing Market Revenue Million Forecast, by Organization Size 2019 & 2032
- Table 28: Global KSA Cloud Computing Market Volume Billion Forecast, by Organization Size 2019 & 2032
- Table 29: Global KSA Cloud Computing Market Revenue Million Forecast, by End-user Industries 2019 & 2032
- Table 30: Global KSA Cloud Computing Market Volume Billion Forecast, by End-user Industries 2019 & 2032
- Table 31: Global KSA Cloud Computing Market Revenue Million Forecast, by Country 2019 & 2032
- Table 32: Global KSA Cloud Computing Market Volume Billion Forecast, by Country 2019 & 2032
- Table 33: Brazil KSA Cloud Computing Market Revenue (Million) Forecast, by Application 2019 & 2032
- Table 34: Brazil KSA Cloud Computing Market Volume (Billion) Forecast, by Application 2019 & 2032
- Table 35: Argentina KSA Cloud Computing Market Revenue (Million) Forecast, by Application 2019 & 2032
- Table 36: Argentina KSA Cloud Computing Market Volume (Billion) Forecast, by Application 2019 & 2032
- Table 37: Rest of South America KSA Cloud Computing Market Revenue (Million) Forecast, by Application 2019 & 2032
- Table 38: Rest of South America KSA Cloud Computing Market Volume (Billion) Forecast, by Application 2019 & 2032
- Table 39: Global KSA Cloud Computing Market Revenue Million Forecast, by Type 2019 & 2032
- Table 40: Global KSA Cloud Computing Market Volume Billion Forecast, by Type 2019 & 2032
- Table 41: Global KSA Cloud Computing Market Revenue Million Forecast, by Organization Size 2019 & 2032
- Table 42: Global KSA Cloud Computing Market Volume Billion Forecast, by Organization Size 2019 & 2032
- Table 43: Global KSA Cloud Computing Market Revenue Million Forecast, by End-user Industries 2019 & 2032
- Table 44: Global KSA Cloud Computing Market Volume Billion Forecast, by End-user Industries 2019 & 2032
- Table 45: Global KSA Cloud Computing Market Revenue Million Forecast, by Country 2019 & 2032
- Table 46: Global KSA Cloud Computing Market Volume Billion Forecast, by Country 2019 & 2032
- Table 47: United Kingdom KSA Cloud Computing Market Revenue (Million) Forecast, by Application 2019 & 2032
- Table 48: United Kingdom KSA Cloud Computing Market Volume (Billion) Forecast, by Application 2019 & 2032
- Table 49: Germany KSA Cloud Computing Market Revenue (Million) Forecast, by Application 2019 & 2032
- Table 50: Germany KSA Cloud Computing Market Volume (Billion) Forecast, by Application 2019 & 2032
- Table 51: France KSA Cloud Computing Market Revenue (Million) Forecast, by Application 2019 & 2032
- Table 52: France KSA Cloud Computing Market Volume (Billion) Forecast, by Application 2019 & 2032
- Table 53: Italy KSA Cloud Computing Market Revenue (Million) Forecast, by Application 2019 & 2032
- Table 54: Italy KSA Cloud Computing Market Volume (Billion) Forecast, by Application 2019 & 2032
- Table 55: Spain KSA Cloud Computing Market Revenue (Million) Forecast, by Application 2019 & 2032
- Table 56: Spain KSA Cloud Computing Market Volume (Billion) Forecast, by Application 2019 & 2032
- Table 57: Russia KSA Cloud Computing Market Revenue (Million) Forecast, by Application 2019 & 2032
- Table 58: Russia KSA Cloud Computing Market Volume (Billion) Forecast, by Application 2019 & 2032
- Table 59: Benelux KSA Cloud Computing Market Revenue (Million) Forecast, by Application 2019 & 2032
- Table 60: Benelux KSA Cloud Computing Market Volume (Billion) Forecast, by Application 2019 & 2032
- Table 61: Nordics KSA Cloud Computing Market Revenue (Million) Forecast, by Application 2019 & 2032
- Table 62: Nordics KSA Cloud Computing Market Volume (Billion) Forecast, by Application 2019 & 2032
- Table 63: Rest of Europe KSA Cloud Computing Market Revenue (Million) Forecast, by Application 2019 & 2032
- Table 64: Rest of Europe KSA Cloud Computing Market Volume (Billion) Forecast, by Application 2019 & 2032
- Table 65: Global KSA Cloud Computing Market Revenue Million Forecast, by Type 2019 & 2032
- Table 66: Global KSA Cloud Computing Market Volume Billion Forecast, by Type 2019 & 2032
- Table 67: Global KSA Cloud Computing Market Revenue Million Forecast, by Organization Size 2019 & 2032
- Table 68: Global KSA Cloud Computing Market Volume Billion Forecast, by Organization Size 2019 & 2032
- Table 69: Global KSA Cloud Computing Market Revenue Million Forecast, by End-user Industries 2019 & 2032
- Table 70: Global KSA Cloud Computing Market Volume Billion Forecast, by End-user Industries 2019 & 2032
- Table 71: Global KSA Cloud Computing Market Revenue Million Forecast, by Country 2019 & 2032
- Table 72: Global KSA Cloud Computing Market Volume Billion Forecast, by Country 2019 & 2032
- Table 73: Turkey KSA Cloud Computing Market Revenue (Million) Forecast, by Application 2019 & 2032
- Table 74: Turkey KSA Cloud Computing Market Volume (Billion) Forecast, by Application 2019 & 2032
- Table 75: Israel KSA Cloud Computing Market Revenue (Million) Forecast, by Application 2019 & 2032
- Table 76: Israel KSA Cloud Computing Market Volume (Billion) Forecast, by Application 2019 & 2032
- Table 77: GCC KSA Cloud Computing Market Revenue (Million) Forecast, by Application 2019 & 2032
- Table 78: GCC KSA Cloud Computing Market Volume (Billion) Forecast, by Application 2019 & 2032
- Table 79: North Africa KSA Cloud Computing Market Revenue (Million) Forecast, by Application 2019 & 2032
- Table 80: North Africa KSA Cloud Computing Market Volume (Billion) Forecast, by Application 2019 & 2032
- Table 81: South Africa KSA Cloud Computing Market Revenue (Million) Forecast, by Application 2019 & 2032
- Table 82: South Africa KSA Cloud Computing Market Volume (Billion) Forecast, by Application 2019 & 2032
- Table 83: Rest of Middle East & Africa KSA Cloud Computing Market Revenue (Million) Forecast, by Application 2019 & 2032
- Table 84: Rest of Middle East & Africa KSA Cloud Computing Market Volume (Billion) Forecast, by Application 2019 & 2032
- Table 85: Global KSA Cloud Computing Market Revenue Million Forecast, by Type 2019 & 2032
- Table 86: Global KSA Cloud Computing Market Volume Billion Forecast, by Type 2019 & 2032
- Table 87: Global KSA Cloud Computing Market Revenue Million Forecast, by Organization Size 2019 & 2032
- Table 88: Global KSA Cloud Computing Market Volume Billion Forecast, by Organization Size 2019 & 2032
- Table 89: Global KSA Cloud Computing Market Revenue Million Forecast, by End-user Industries 2019 & 2032
- Table 90: Global KSA Cloud Computing Market Volume Billion Forecast, by End-user Industries 2019 & 2032
- Table 91: Global KSA Cloud Computing Market Revenue Million Forecast, by Country 2019 & 2032
- Table 92: Global KSA Cloud Computing Market Volume Billion Forecast, by Country 2019 & 2032
- Table 93: China KSA Cloud Computing Market Revenue (Million) Forecast, by Application 2019 & 2032
- Table 94: China KSA Cloud Computing Market Volume (Billion) Forecast, by Application 2019 & 2032
- Table 95: India KSA Cloud Computing Market Revenue (Million) Forecast, by Application 2019 & 2032
- Table 96: India KSA Cloud Computing Market Volume (Billion) Forecast, by Application 2019 & 2032
- Table 97: Japan KSA Cloud Computing Market Revenue (Million) Forecast, by Application 2019 & 2032
- Table 98: Japan KSA Cloud Computing Market Volume (Billion) Forecast, by Application 2019 & 2032
- Table 99: South Korea KSA Cloud Computing Market Revenue (Million) Forecast, by Application 2019 & 2032
- Table 100: South Korea KSA Cloud Computing Market Volume (Billion) Forecast, by Application 2019 & 2032
- Table 101: ASEAN KSA Cloud Computing Market Revenue (Million) Forecast, by Application 2019 & 2032
- Table 102: ASEAN KSA Cloud Computing Market Volume (Billion) Forecast, by Application 2019 & 2032
- Table 103: Oceania KSA Cloud Computing Market Revenue (Million) Forecast, by Application 2019 & 2032
- Table 104: Oceania KSA Cloud Computing Market Volume (Billion) Forecast, by Application 2019 & 2032
- Table 105: Rest of Asia Pacific KSA Cloud Computing Market Revenue (Million) Forecast, by Application 2019 & 2032
- Table 106: Rest of Asia Pacific KSA Cloud Computing Market Volume (Billion) Forecast, by Application 2019 & 2032
Frequently Asked Questions
1. What is the projected Compound Annual Growth Rate (CAGR) of the KSA Cloud Computing Market?
The projected CAGR is approximately 12.66%.
2. Which companies are prominent players in the KSA Cloud Computing Market?
Key companies in the market include Amazon com Inc(AWS), Google LLC, Microsoft Corporation, NTT Communications, NEC Corporation, Rackspace Technology Inc, Oracle Corporation, IBM Corporation, Alibaba Cloud (Aliyun), Salesforce Inc, SAP SE*List Not Exhaustive.
3. What are the main segments of the KSA Cloud Computing Market?
The market segments include Type, Organization Size, End-user Industries.
4. Can you provide details about the market size?
The market size is estimated to be USD 13.66 Million as of 2022.
5. What are some drivers contributing to market growth?
Robust Shift Towards Digital Transformation Across the Country; Data Privacy Concerns Are Driving Increased Adoption Of Public Cloud Services.
6. What are the notable trends driving market growth?
Robust Shift Towards Digital Transformation Across the Country.
7. Are there any restraints impacting market growth?
Robust Shift Towards Digital Transformation Across the Country; Data Privacy Concerns Are Driving Increased Adoption Of Public Cloud Services.
8. Can you provide examples of recent developments in the market?
August 2024: Following the introduction of the Google Cloud region in Saudi Arabia (KSA) in November 2023, enhanced data sovereignty, security, and AI features for the Dammam region were unveiled. These advancements are tailored to bolster the digital transformation of organizations in Saudi Arabia, especially those with regulatory obligations, such as multinational corporations.March 2024: Amazon Web Services (AWS), a subsidiary of Amazon.com, announced plans to establish an AWS infrastructure Region in the Kingdom of Saudi Arabia by 2026. This new AWS Region will empower developers, startups, entrepreneurs, enterprises, and organizations in sectors like healthcare, education, gaming, and nonprofits to run applications and serve end users from local data centers. This ensures that customers wishing to keep their content within the Kingdom can do so. Demonstrating its long-term commitment, AWS has pledged an investment exceeding USD 5.3 billion (approximately 19.88 billion Saudi riyal) in the Kingdom.April 2024: Informatica, an enterprise cloud data management company, introduced its AI-driven Intelligent Data Management Cloud (IDMC) in Saudi Arabia, marking a first for the nation. This initiative encompasses establishing a new Point of Delivery (PoD) in Riyadh, emphasizing a dedication to local, scalable, cloud-centric data management solutions. This move reinforces Informatica's foothold in the Middle East and follows its inaugural regional PoD launch in Abu Dhabi, UAE, in 2023.March 2024: YASH Technologies, a global technology consultancy, and Huawei Cloud, a cloud service provider, forged a strategic alliance at LEAP 2024, the premier technology event in the Middle East and North Africa (MENA) region. The duo formalized their collaboration through a Memorandum of Understanding (MOU), underscoring their joint commitment to delivering transformative solutions in pivotal domains such as cloud computing, AI, machine learning, and data analytics to their shared clientele.
9. What pricing options are available for accessing the report?
Pricing options include single-user, multi-user, and enterprise licenses priced at USD 3800, USD 4500, and USD 5800 respectively.
10. Is the market size provided in terms of value or volume?
The market size is provided in terms of value, measured in Million and volume, measured in Billion.
11. Are there any specific market keywords associated with the report?
Yes, the market keyword associated with the report is "KSA Cloud Computing Market," which aids in identifying and referencing the specific market segment covered.
12. How do I determine which pricing option suits my needs best?
The pricing options vary based on user requirements and access needs. Individual users may opt for single-user licenses, while businesses requiring broader access may choose multi-user or enterprise licenses for cost-effective access to the report.
13. Are there any additional resources or data provided in the KSA Cloud Computing Market report?
While the report offers comprehensive insights, it's advisable to review the specific contents or supplementary materials provided to ascertain if additional resources or data are available.
14. How can I stay updated on further developments or reports in the KSA Cloud Computing Market?
To stay informed about further developments, trends, and reports in the KSA Cloud Computing Market, consider subscribing to industry newsletters, following relevant companies and organizations, or regularly checking reputable industry news sources and publications.
Methodology
Step 1 - Identification of Relevant Samples Size from Population Database


Step 2 - Approaches for Defining Global Market Size (Value, Volume* & Price*)

Note*: In applicable scenarios
Step 3 - Data Sources
Primary Research
- Web Analytics
- Survey Reports
- Research Institute
- Latest Research Reports
- Opinion Leaders
Secondary Research
- Annual Reports
- White Paper
- Latest Press Release
- Industry Association
- Paid Database
- Investor Presentations

Step 4 - Data Triangulation
Involves using different sources of information in order to increase the validity of a study
These sources are likely to be stakeholders in a program - participants, other researchers, program staff, other community members, and so on.
Then we put all data in single framework & apply various statistical tools to find out the dynamic on the market.
During the analysis stage, feedback from the stakeholder groups would be compared to determine areas of agreement as well as areas of divergence


