
Key Insights
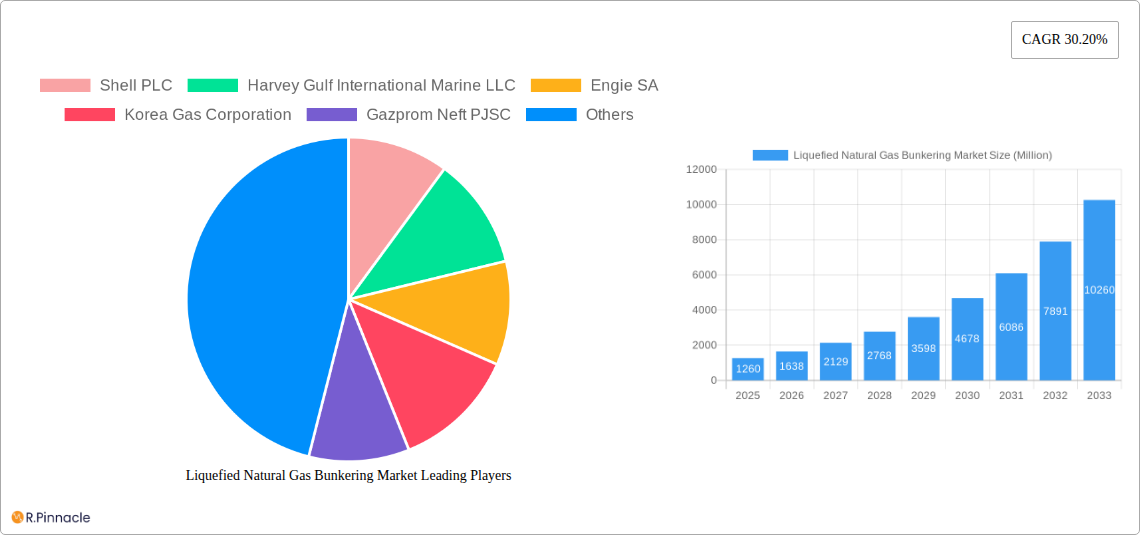
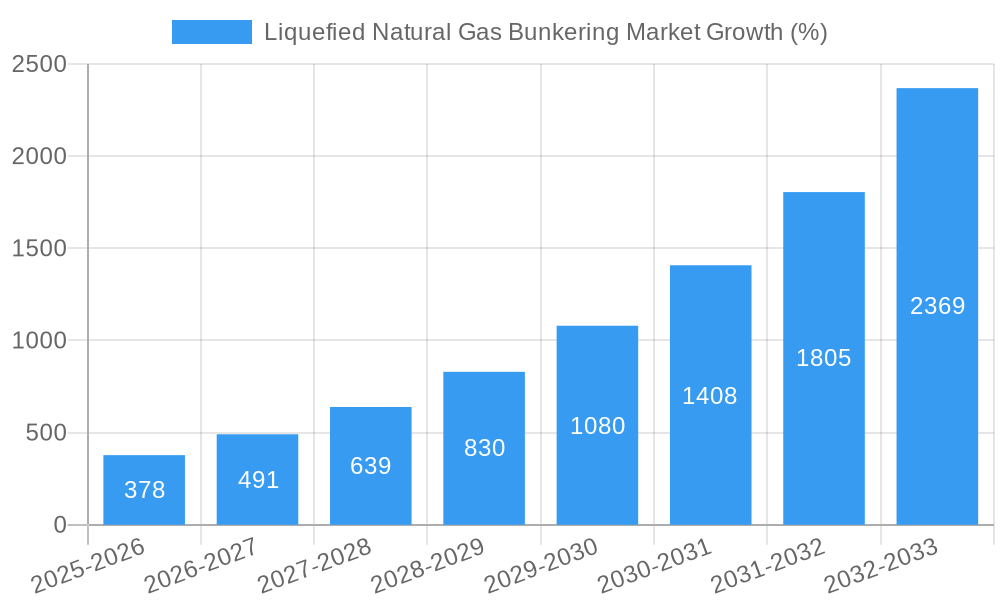
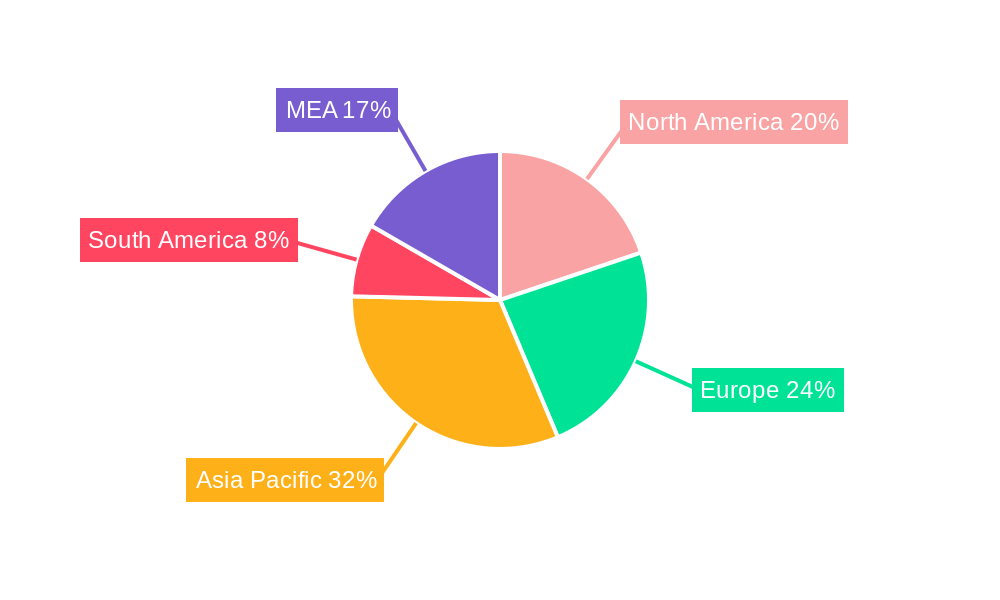
The Liquefied Natural Gas (LNG) bunkering market is experiencing robust growth, projected to reach a market size of $1.26 billion in 2025 and exhibiting a Compound Annual Growth Rate (CAGR) of 30.20% from 2025 to 2033. This expansion is primarily driven by the increasing adoption of LNG as a cleaner marine fuel, stringent international regulations aimed at reducing greenhouse gas emissions from shipping, and the expanding global LNG supply chain. The growing awareness of environmental concerns and the subsequent pressure to decarbonize the maritime sector are key catalysts. Furthermore, significant investments in LNG bunkering infrastructure, including the construction of new LNG bunkering vessels and onshore facilities, are fueling market growth. Key players, such as Shell PLC, Harvey Gulf International Marine LLC, and Engie SA, are actively participating in this expansion, strategically positioning themselves to capitalize on the increasing demand for LNG bunkering services. The diverse end-user segments, including tanker fleets, container fleets, and bulk carriers, contribute to the market's broad appeal and growth potential. Geographical expansion, particularly in regions with significant maritime activity like Asia-Pacific and Europe, further contributes to the overall market dynamism.
The market segmentation reveals diverse opportunities across various end-user industries. Tanker fleets, due to their long voyages and high fuel consumption, represent a significant segment. Container fleets, driven by increasing global trade, are also adopting LNG bunkering to meet environmental regulations. Bulk and general cargo fleets are showing increasing interest, while ferries and offshore support vessels (OSV) represent niche markets with growing potential. Regional variations are significant; North America and Europe, being early adopters, possess established LNG bunkering infrastructure, while Asia-Pacific is witnessing rapid growth due to increasing industrial activity and stricter environmental policies. However, the market faces challenges, including the relatively high initial investment costs associated with LNG bunkering infrastructure and the need for wider availability of LNG fueling stations globally. Nevertheless, the long-term outlook for the LNG bunkering market remains positive, fueled by continuous technological advancements and strengthened regulatory frameworks.
Liquefied Natural Gas (LNG) Bunkering Market Report: 2019-2033
This comprehensive report provides an in-depth analysis of the Liquefied Natural Gas (LNG) bunkering market, offering invaluable insights for industry professionals, investors, and stakeholders. Covering the period from 2019 to 2033, with a focus on 2025, this report unveils the market's structure, dynamics, key players, and future outlook. Benefit from detailed segmentation analysis, including Tanker Fleet, Container Fleet, Bulk and General Cargo Fleet, Ferries and OSV, and Other End Users, alongside regional breakdowns and growth projections.
Liquefied Natural Gas Bunkering Market Structure & Innovation Trends
This section analyzes the competitive landscape of the LNG bunkering market, examining market concentration, innovation drivers, regulatory frameworks, and key M&A activities. The report reveals the market share held by major players such as Shell PLC, Harvey Gulf International Marine LLC, Engie SA, Korea Gas Corporation, Gazprom Neft PJSC, ENN Energy Holdings Ltd, Gasum Oy, Naturgy Energy Group SA, and TotalEnergies SE. The analysis includes an assessment of the market's fragmentation, identifying the presence of both large multinational corporations and smaller, specialized players.
- Market Concentration: The market exhibits a moderately concentrated structure, with a few dominant players holding significant market share (xx%). However, the presence of numerous smaller companies signifies a competitive landscape.
- Innovation Drivers: Stringent environmental regulations and the growing demand for cleaner marine fuels are primary drivers of innovation. Technological advancements in LNG bunkering infrastructure and vessel designs are also significant factors.
- Regulatory Frameworks: International Maritime Organization (IMO) regulations concerning sulfur emissions are shaping market growth, incentivizing the adoption of LNG as a cleaner alternative. Regional variations in regulations further impact market dynamics.
- Product Substitutes: While LNG is currently a leading alternative, other low-sulfur fuels and alternative technologies pose some level of competitive threat. The report analyses the relative strengths and weaknesses of these substitutes.
- End-User Demographics: The report segments end-users by vessel type, providing a detailed analysis of the adoption rate and projected growth within each segment.
- M&A Activities: The report analyzes recent mergers and acquisitions within the LNG bunkering market, providing insights into deal values (xx Million) and their implications for market consolidation. This analysis includes the strategic rationale behind these transactions and their impact on market share distribution.
Liquefied Natural Gas Bunkering Market Dynamics & Trends
This section delves into the key market drivers, technological advancements, and competitive dynamics shaping the LNG bunkering market's trajectory. It examines market growth drivers such as increasing environmental regulations, expanding LNG infrastructure, and growing demand for cleaner shipping solutions. The report also highlights technological disruptions, including advancements in bunkering technologies and vessel designs, and explores how consumer preferences, particularly among shipping companies seeking to reduce their environmental footprint, are influencing market growth. The compound annual growth rate (CAGR) and market penetration rate are provided for the forecast period. The competitive dynamics are analyzed, focusing on the strategies employed by leading players and the emerging trends in the market.
Dominant Regions & Segments in Liquefied Natural Gas Bunkering Market
This section identifies the leading regions and segments within the LNG bunkering market. The report analyzes factors driving the dominance of specific regions and segments, including economic policies, infrastructure development, and environmental regulations. The focus is on examining the contribution of each end-user segment (Tanker Fleet, Container Fleet, Bulk and General Cargo Fleet, Ferries and OSV, and Other End Users) and how their growth trajectory differs across geographical areas.
Key Drivers for Leading Segments:
- Tanker Fleet: High fuel consumption and long voyages make tankers a major segment for LNG bunkering adoption.
- Container Fleet: Increased focus on reducing carbon emissions from major container lines drives demand within this segment.
- Bulk and General Cargo Fleet: Growing environmental concerns and associated regulations are leading to increased adoption.
- Ferries and OSV: Short voyages and proximity to bunkering infrastructure makes LNG a viable alternative for these segments.
- Other End Users: This includes smaller vessels and niche segments where LNG adoption is steadily growing.
Dominance Analysis: The report provides a detailed analysis of the leading regions (e.g., xx) and the reasons behind their dominance, comparing them to other regions with substantial but less dominant market shares (e.g., xx).
Liquefied Natural Gas Bunkering Market Product Innovations
This section summarizes recent product developments and technological advancements in the LNG bunkering market. It highlights innovative bunkering technologies, their applications, and the resulting competitive advantages. The analysis focuses on emerging trends in LNG bunkering infrastructure and vessel design, emphasizing their market fit and potential impact on the overall market landscape.
Report Scope & Segmentation Analysis
This report segments the LNG bunkering market by end-user:
- Tanker Fleet: This segment represents a significant portion of the market due to high fuel consumption. Growth is projected at xx% CAGR.
- Container Fleet: Driven by environmental regulations and carrier commitments, this segment shows strong growth potential (xx% CAGR).
- Bulk and General Cargo Fleet: This segment shows a moderate growth rate (xx% CAGR), as adoption is influenced by vessel size and trade routes.
- Ferries and OSV: This segment is anticipated to experience a xx% CAGR, driven by relatively shorter distances and operational advantages of LNG.
- Other End Users: This segment includes smaller vessels and niche markets with a projected xx% CAGR.
Key Drivers of Liquefied Natural Gas Bunkering Market Growth
The growth of the LNG bunkering market is fueled by several key factors:
- Stringent Environmental Regulations: IMO's sulfur cap and other environmental regulations are driving the shift towards cleaner fuels.
- Technological Advancements: Improvements in LNG bunkering infrastructure and vessel technology are making LNG a more viable option.
- Falling LNG Prices: Declining LNG prices are enhancing its cost competitiveness compared to traditional marine fuels.
Challenges in the Liquefied Natural Gas Bunkering Market Sector
The LNG bunkering market faces several challenges:
- High Initial Investment Costs: Setting up LNG bunkering infrastructure requires substantial upfront investment.
- Limited Bunkering Infrastructure: The lack of widespread LNG bunkering infrastructure restricts widespread adoption.
- Safety Concerns: Handling and bunkering LNG pose safety risks that require careful management and training.
Emerging Opportunities in Liquefied Natural Gas Bunkering Market
The LNG bunkering market presents several emerging opportunities:
- Expansion into New Markets: Growing adoption in developing economies holds significant potential.
- Technological Innovation: Further advancements in bunkering technologies can improve efficiency and safety.
- Strategic Partnerships: Collaboration between shipping companies, LNG suppliers, and port authorities is crucial for market expansion.
Leading Players in the Liquefied Natural Gas Bunkering Market Market
- Shell PLC
- Harvey Gulf International Marine LLC
- Engie SA
- Korea Gas Corporation
- Gazprom Neft PJSC
- ENN Energy Holdings Ltd
- Gasum Oy
- Naturgy Energy Group SA
- TotalEnergies SE
Key Developments in Liquefied Natural Gas Bunkering Market Industry
- January 2022: CMA CGM signed a ten-year contract with Shanghai International Port Group to use LNG as bunker fuel in the Yangshan port area.
- August 2021: Gazprom Neft completed construction of Russia's first LNG bunkering vessel.
Future Outlook for Liquefied Natural Gas Bunkering Market Market
The LNG bunkering market is poised for significant growth over the forecast period. Continued tightening of environmental regulations, coupled with technological advancements and decreasing LNG prices, will drive market expansion. Strategic partnerships and investments in infrastructure development will further accelerate market growth, creating substantial opportunities for market players. The market is expected to experience considerable expansion, driven by the global maritime industry's commitment to reducing its environmental impact.
Liquefied Natural Gas Bunkering Market Segmentation
-
1. End User
- 1.1. Tanker Fleet
- 1.2. Container Fleet
- 1.3. Bulk and General Cargo Fleet
- 1.4. Ferries and OSV
- 1.5. Other End Users
Liquefied Natural Gas Bunkering Market Segmentation By Geography
- 1. North America
- 2. Europe
- 3. Asia Pacific
- 4. Middle East and Africa
- 5. South America
Liquefied Natural Gas Bunkering Market REPORT HIGHLIGHTS
| Aspects | Details |
|---|---|
| Study Period | 2019-2033 |
| Base Year | 2024 |
| Estimated Year | 2025 |
| Forecast Period | 2025-2033 |
| Historical Period | 2019-2024 |
| Growth Rate | CAGR of 30.20% from 2019-2033 |
| Segmentation |
|
Table of Contents
- 1. Introduction
- 1.1. Research Scope
- 1.2. Market Segmentation
- 1.3. Research Methodology
- 1.4. Definitions and Assumptions
- 2. Executive Summary
- 2.1. Introduction
- 3. Market Dynamics
- 3.1. Introduction
- 3.2. Market Drivers
- 3.2.1. 4.; Modernization and Upgrades of Existing Military Aircraft Fleets4.; Increasing Defense Budgets
- 3.3. Market Restrains
- 3.3.1. 4.; Shift Toward Unmanned Aircraft
- 3.4. Market Trends
- 3.4.1. Tanker Fleet to Witness Significant Growth
- 4. Market Factor Analysis
- 4.1. Porters Five Forces
- 4.2. Supply/Value Chain
- 4.3. PESTEL analysis
- 4.4. Market Entropy
- 4.5. Patent/Trademark Analysis
- 5. Global Liquefied Natural Gas Bunkering Market Analysis, Insights and Forecast, 2019-2031
- 5.1. Market Analysis, Insights and Forecast - by End User
- 5.1.1. Tanker Fleet
- 5.1.2. Container Fleet
- 5.1.3. Bulk and General Cargo Fleet
- 5.1.4. Ferries and OSV
- 5.1.5. Other End Users
- 5.2. Market Analysis, Insights and Forecast - by Region
- 5.2.1. North America
- 5.2.2. Europe
- 5.2.3. Asia Pacific
- 5.2.4. Middle East and Africa
- 5.2.5. South America
- 5.1. Market Analysis, Insights and Forecast - by End User
- 6. North America Liquefied Natural Gas Bunkering Market Analysis, Insights and Forecast, 2019-2031
- 6.1. Market Analysis, Insights and Forecast - by End User
- 6.1.1. Tanker Fleet
- 6.1.2. Container Fleet
- 6.1.3. Bulk and General Cargo Fleet
- 6.1.4. Ferries and OSV
- 6.1.5. Other End Users
- 6.1. Market Analysis, Insights and Forecast - by End User
- 7. Europe Liquefied Natural Gas Bunkering Market Analysis, Insights and Forecast, 2019-2031
- 7.1. Market Analysis, Insights and Forecast - by End User
- 7.1.1. Tanker Fleet
- 7.1.2. Container Fleet
- 7.1.3. Bulk and General Cargo Fleet
- 7.1.4. Ferries and OSV
- 7.1.5. Other End Users
- 7.1. Market Analysis, Insights and Forecast - by End User
- 8. Asia Pacific Liquefied Natural Gas Bunkering Market Analysis, Insights and Forecast, 2019-2031
- 8.1. Market Analysis, Insights and Forecast - by End User
- 8.1.1. Tanker Fleet
- 8.1.2. Container Fleet
- 8.1.3. Bulk and General Cargo Fleet
- 8.1.4. Ferries and OSV
- 8.1.5. Other End Users
- 8.1. Market Analysis, Insights and Forecast - by End User
- 9. Middle East and Africa Liquefied Natural Gas Bunkering Market Analysis, Insights and Forecast, 2019-2031
- 9.1. Market Analysis, Insights and Forecast - by End User
- 9.1.1. Tanker Fleet
- 9.1.2. Container Fleet
- 9.1.3. Bulk and General Cargo Fleet
- 9.1.4. Ferries and OSV
- 9.1.5. Other End Users
- 9.1. Market Analysis, Insights and Forecast - by End User
- 10. South America Liquefied Natural Gas Bunkering Market Analysis, Insights and Forecast, 2019-2031
- 10.1. Market Analysis, Insights and Forecast - by End User
- 10.1.1. Tanker Fleet
- 10.1.2. Container Fleet
- 10.1.3. Bulk and General Cargo Fleet
- 10.1.4. Ferries and OSV
- 10.1.5. Other End Users
- 10.1. Market Analysis, Insights and Forecast - by End User
- 11. North America Liquefied Natural Gas Bunkering Market Analysis, Insights and Forecast, 2019-2031
- 11.1. Market Analysis, Insights and Forecast - By Country/Sub-region
- 11.1.1 United States
- 11.1.2 Canada
- 11.1.3 Mexico
- 12. Europe Liquefied Natural Gas Bunkering Market Analysis, Insights and Forecast, 2019-2031
- 12.1. Market Analysis, Insights and Forecast - By Country/Sub-region
- 12.1.1 Germany
- 12.1.2 United Kingdom
- 12.1.3 France
- 12.1.4 Spain
- 12.1.5 Italy
- 12.1.6 Spain
- 12.1.7 Belgium
- 12.1.8 Netherland
- 12.1.9 Nordics
- 12.1.10 Rest of Europe
- 13. Asia Pacific Liquefied Natural Gas Bunkering Market Analysis, Insights and Forecast, 2019-2031
- 13.1. Market Analysis, Insights and Forecast - By Country/Sub-region
- 13.1.1 China
- 13.1.2 Japan
- 13.1.3 India
- 13.1.4 South Korea
- 13.1.5 Southeast Asia
- 13.1.6 Australia
- 13.1.7 Indonesia
- 13.1.8 Phillipes
- 13.1.9 Singapore
- 13.1.10 Thailandc
- 13.1.11 Rest of Asia Pacific
- 14. South America Liquefied Natural Gas Bunkering Market Analysis, Insights and Forecast, 2019-2031
- 14.1. Market Analysis, Insights and Forecast - By Country/Sub-region
- 14.1.1 Brazil
- 14.1.2 Argentina
- 14.1.3 Peru
- 14.1.4 Chile
- 14.1.5 Colombia
- 14.1.6 Ecuador
- 14.1.7 Venezuela
- 14.1.8 Rest of South America
- 15. MEA Liquefied Natural Gas Bunkering Market Analysis, Insights and Forecast, 2019-2031
- 15.1. Market Analysis, Insights and Forecast - By Country/Sub-region
- 15.1.1 United Arab Emirates
- 15.1.2 Saudi Arabia
- 15.1.3 South Africa
- 15.1.4 Rest of Middle East and Africa
- 16. Competitive Analysis
- 16.1. Global Market Share Analysis 2024
- 16.2. Company Profiles
- 16.2.1 Shell PLC
- 16.2.1.1. Overview
- 16.2.1.2. Products
- 16.2.1.3. SWOT Analysis
- 16.2.1.4. Recent Developments
- 16.2.1.5. Financials (Based on Availability)
- 16.2.2 Harvey Gulf International Marine LLC
- 16.2.2.1. Overview
- 16.2.2.2. Products
- 16.2.2.3. SWOT Analysis
- 16.2.2.4. Recent Developments
- 16.2.2.5. Financials (Based on Availability)
- 16.2.3 Engie SA
- 16.2.3.1. Overview
- 16.2.3.2. Products
- 16.2.3.3. SWOT Analysis
- 16.2.3.4. Recent Developments
- 16.2.3.5. Financials (Based on Availability)
- 16.2.4 Korea Gas Corporation
- 16.2.4.1. Overview
- 16.2.4.2. Products
- 16.2.4.3. SWOT Analysis
- 16.2.4.4. Recent Developments
- 16.2.4.5. Financials (Based on Availability)
- 16.2.5 Gazprom Neft PJSC
- 16.2.5.1. Overview
- 16.2.5.2. Products
- 16.2.5.3. SWOT Analysis
- 16.2.5.4. Recent Developments
- 16.2.5.5. Financials (Based on Availability)
- 16.2.6 ENN Energy Holdings Ltd
- 16.2.6.1. Overview
- 16.2.6.2. Products
- 16.2.6.3. SWOT Analysis
- 16.2.6.4. Recent Developments
- 16.2.6.5. Financials (Based on Availability)
- 16.2.7 Gasum Oy
- 16.2.7.1. Overview
- 16.2.7.2. Products
- 16.2.7.3. SWOT Analysis
- 16.2.7.4. Recent Developments
- 16.2.7.5. Financials (Based on Availability)
- 16.2.8 Naturgy Energy Group SA
- 16.2.8.1. Overview
- 16.2.8.2. Products
- 16.2.8.3. SWOT Analysis
- 16.2.8.4. Recent Developments
- 16.2.8.5. Financials (Based on Availability)
- 16.2.9 TotalEnergies SE
- 16.2.9.1. Overview
- 16.2.9.2. Products
- 16.2.9.3. SWOT Analysis
- 16.2.9.4. Recent Developments
- 16.2.9.5. Financials (Based on Availability)
- 16.2.1 Shell PLC
List of Figures
- Figure 1: Global Liquefied Natural Gas Bunkering Market Revenue Breakdown (Million, %) by Region 2024 & 2032
- Figure 2: Global Liquefied Natural Gas Bunkering Market Volume Breakdown (K Unit, %) by Region 2024 & 2032
- Figure 3: North America Liquefied Natural Gas Bunkering Market Revenue (Million), by Country 2024 & 2032
- Figure 4: North America Liquefied Natural Gas Bunkering Market Volume (K Unit), by Country 2024 & 2032
- Figure 5: North America Liquefied Natural Gas Bunkering Market Revenue Share (%), by Country 2024 & 2032
- Figure 6: North America Liquefied Natural Gas Bunkering Market Volume Share (%), by Country 2024 & 2032
- Figure 7: Europe Liquefied Natural Gas Bunkering Market Revenue (Million), by Country 2024 & 2032
- Figure 8: Europe Liquefied Natural Gas Bunkering Market Volume (K Unit), by Country 2024 & 2032
- Figure 9: Europe Liquefied Natural Gas Bunkering Market Revenue Share (%), by Country 2024 & 2032
- Figure 10: Europe Liquefied Natural Gas Bunkering Market Volume Share (%), by Country 2024 & 2032
- Figure 11: Asia Pacific Liquefied Natural Gas Bunkering Market Revenue (Million), by Country 2024 & 2032
- Figure 12: Asia Pacific Liquefied Natural Gas Bunkering Market Volume (K Unit), by Country 2024 & 2032
- Figure 13: Asia Pacific Liquefied Natural Gas Bunkering Market Revenue Share (%), by Country 2024 & 2032
- Figure 14: Asia Pacific Liquefied Natural Gas Bunkering Market Volume Share (%), by Country 2024 & 2032
- Figure 15: South America Liquefied Natural Gas Bunkering Market Revenue (Million), by Country 2024 & 2032
- Figure 16: South America Liquefied Natural Gas Bunkering Market Volume (K Unit), by Country 2024 & 2032
- Figure 17: South America Liquefied Natural Gas Bunkering Market Revenue Share (%), by Country 2024 & 2032
- Figure 18: South America Liquefied Natural Gas Bunkering Market Volume Share (%), by Country 2024 & 2032
- Figure 19: MEA Liquefied Natural Gas Bunkering Market Revenue (Million), by Country 2024 & 2032
- Figure 20: MEA Liquefied Natural Gas Bunkering Market Volume (K Unit), by Country 2024 & 2032
- Figure 21: MEA Liquefied Natural Gas Bunkering Market Revenue Share (%), by Country 2024 & 2032
- Figure 22: MEA Liquefied Natural Gas Bunkering Market Volume Share (%), by Country 2024 & 2032
- Figure 23: North America Liquefied Natural Gas Bunkering Market Revenue (Million), by End User 2024 & 2032
- Figure 24: North America Liquefied Natural Gas Bunkering Market Volume (K Unit), by End User 2024 & 2032
- Figure 25: North America Liquefied Natural Gas Bunkering Market Revenue Share (%), by End User 2024 & 2032
- Figure 26: North America Liquefied Natural Gas Bunkering Market Volume Share (%), by End User 2024 & 2032
- Figure 27: North America Liquefied Natural Gas Bunkering Market Revenue (Million), by Country 2024 & 2032
- Figure 28: North America Liquefied Natural Gas Bunkering Market Volume (K Unit), by Country 2024 & 2032
- Figure 29: North America Liquefied Natural Gas Bunkering Market Revenue Share (%), by Country 2024 & 2032
- Figure 30: North America Liquefied Natural Gas Bunkering Market Volume Share (%), by Country 2024 & 2032
- Figure 31: Europe Liquefied Natural Gas Bunkering Market Revenue (Million), by End User 2024 & 2032
- Figure 32: Europe Liquefied Natural Gas Bunkering Market Volume (K Unit), by End User 2024 & 2032
- Figure 33: Europe Liquefied Natural Gas Bunkering Market Revenue Share (%), by End User 2024 & 2032
- Figure 34: Europe Liquefied Natural Gas Bunkering Market Volume Share (%), by End User 2024 & 2032
- Figure 35: Europe Liquefied Natural Gas Bunkering Market Revenue (Million), by Country 2024 & 2032
- Figure 36: Europe Liquefied Natural Gas Bunkering Market Volume (K Unit), by Country 2024 & 2032
- Figure 37: Europe Liquefied Natural Gas Bunkering Market Revenue Share (%), by Country 2024 & 2032
- Figure 38: Europe Liquefied Natural Gas Bunkering Market Volume Share (%), by Country 2024 & 2032
- Figure 39: Asia Pacific Liquefied Natural Gas Bunkering Market Revenue (Million), by End User 2024 & 2032
- Figure 40: Asia Pacific Liquefied Natural Gas Bunkering Market Volume (K Unit), by End User 2024 & 2032
- Figure 41: Asia Pacific Liquefied Natural Gas Bunkering Market Revenue Share (%), by End User 2024 & 2032
- Figure 42: Asia Pacific Liquefied Natural Gas Bunkering Market Volume Share (%), by End User 2024 & 2032
- Figure 43: Asia Pacific Liquefied Natural Gas Bunkering Market Revenue (Million), by Country 2024 & 2032
- Figure 44: Asia Pacific Liquefied Natural Gas Bunkering Market Volume (K Unit), by Country 2024 & 2032
- Figure 45: Asia Pacific Liquefied Natural Gas Bunkering Market Revenue Share (%), by Country 2024 & 2032
- Figure 46: Asia Pacific Liquefied Natural Gas Bunkering Market Volume Share (%), by Country 2024 & 2032
- Figure 47: Middle East and Africa Liquefied Natural Gas Bunkering Market Revenue (Million), by End User 2024 & 2032
- Figure 48: Middle East and Africa Liquefied Natural Gas Bunkering Market Volume (K Unit), by End User 2024 & 2032
- Figure 49: Middle East and Africa Liquefied Natural Gas Bunkering Market Revenue Share (%), by End User 2024 & 2032
- Figure 50: Middle East and Africa Liquefied Natural Gas Bunkering Market Volume Share (%), by End User 2024 & 2032
- Figure 51: Middle East and Africa Liquefied Natural Gas Bunkering Market Revenue (Million), by Country 2024 & 2032
- Figure 52: Middle East and Africa Liquefied Natural Gas Bunkering Market Volume (K Unit), by Country 2024 & 2032
- Figure 53: Middle East and Africa Liquefied Natural Gas Bunkering Market Revenue Share (%), by Country 2024 & 2032
- Figure 54: Middle East and Africa Liquefied Natural Gas Bunkering Market Volume Share (%), by Country 2024 & 2032
- Figure 55: South America Liquefied Natural Gas Bunkering Market Revenue (Million), by End User 2024 & 2032
- Figure 56: South America Liquefied Natural Gas Bunkering Market Volume (K Unit), by End User 2024 & 2032
- Figure 57: South America Liquefied Natural Gas Bunkering Market Revenue Share (%), by End User 2024 & 2032
- Figure 58: South America Liquefied Natural Gas Bunkering Market Volume Share (%), by End User 2024 & 2032
- Figure 59: South America Liquefied Natural Gas Bunkering Market Revenue (Million), by Country 2024 & 2032
- Figure 60: South America Liquefied Natural Gas Bunkering Market Volume (K Unit), by Country 2024 & 2032
- Figure 61: South America Liquefied Natural Gas Bunkering Market Revenue Share (%), by Country 2024 & 2032
- Figure 62: South America Liquefied Natural Gas Bunkering Market Volume Share (%), by Country 2024 & 2032
List of Tables
- Table 1: Global Liquefied Natural Gas Bunkering Market Revenue Million Forecast, by Region 2019 & 2032
- Table 2: Global Liquefied Natural Gas Bunkering Market Volume K Unit Forecast, by Region 2019 & 2032
- Table 3: Global Liquefied Natural Gas Bunkering Market Revenue Million Forecast, by End User 2019 & 2032
- Table 4: Global Liquefied Natural Gas Bunkering Market Volume K Unit Forecast, by End User 2019 & 2032
- Table 5: Global Liquefied Natural Gas Bunkering Market Revenue Million Forecast, by Region 2019 & 2032
- Table 6: Global Liquefied Natural Gas Bunkering Market Volume K Unit Forecast, by Region 2019 & 2032
- Table 7: Global Liquefied Natural Gas Bunkering Market Revenue Million Forecast, by Country 2019 & 2032
- Table 8: Global Liquefied Natural Gas Bunkering Market Volume K Unit Forecast, by Country 2019 & 2032
- Table 9: United States Liquefied Natural Gas Bunkering Market Revenue (Million) Forecast, by Application 2019 & 2032
- Table 10: United States Liquefied Natural Gas Bunkering Market Volume (K Unit) Forecast, by Application 2019 & 2032
- Table 11: Canada Liquefied Natural Gas Bunkering Market Revenue (Million) Forecast, by Application 2019 & 2032
- Table 12: Canada Liquefied Natural Gas Bunkering Market Volume (K Unit) Forecast, by Application 2019 & 2032
- Table 13: Mexico Liquefied Natural Gas Bunkering Market Revenue (Million) Forecast, by Application 2019 & 2032
- Table 14: Mexico Liquefied Natural Gas Bunkering Market Volume (K Unit) Forecast, by Application 2019 & 2032
- Table 15: Global Liquefied Natural Gas Bunkering Market Revenue Million Forecast, by Country 2019 & 2032
- Table 16: Global Liquefied Natural Gas Bunkering Market Volume K Unit Forecast, by Country 2019 & 2032
- Table 17: Germany Liquefied Natural Gas Bunkering Market Revenue (Million) Forecast, by Application 2019 & 2032
- Table 18: Germany Liquefied Natural Gas Bunkering Market Volume (K Unit) Forecast, by Application 2019 & 2032
- Table 19: United Kingdom Liquefied Natural Gas Bunkering Market Revenue (Million) Forecast, by Application 2019 & 2032
- Table 20: United Kingdom Liquefied Natural Gas Bunkering Market Volume (K Unit) Forecast, by Application 2019 & 2032
- Table 21: France Liquefied Natural Gas Bunkering Market Revenue (Million) Forecast, by Application 2019 & 2032
- Table 22: France Liquefied Natural Gas Bunkering Market Volume (K Unit) Forecast, by Application 2019 & 2032
- Table 23: Spain Liquefied Natural Gas Bunkering Market Revenue (Million) Forecast, by Application 2019 & 2032
- Table 24: Spain Liquefied Natural Gas Bunkering Market Volume (K Unit) Forecast, by Application 2019 & 2032
- Table 25: Italy Liquefied Natural Gas Bunkering Market Revenue (Million) Forecast, by Application 2019 & 2032
- Table 26: Italy Liquefied Natural Gas Bunkering Market Volume (K Unit) Forecast, by Application 2019 & 2032
- Table 27: Spain Liquefied Natural Gas Bunkering Market Revenue (Million) Forecast, by Application 2019 & 2032
- Table 28: Spain Liquefied Natural Gas Bunkering Market Volume (K Unit) Forecast, by Application 2019 & 2032
- Table 29: Belgium Liquefied Natural Gas Bunkering Market Revenue (Million) Forecast, by Application 2019 & 2032
- Table 30: Belgium Liquefied Natural Gas Bunkering Market Volume (K Unit) Forecast, by Application 2019 & 2032
- Table 31: Netherland Liquefied Natural Gas Bunkering Market Revenue (Million) Forecast, by Application 2019 & 2032
- Table 32: Netherland Liquefied Natural Gas Bunkering Market Volume (K Unit) Forecast, by Application 2019 & 2032
- Table 33: Nordics Liquefied Natural Gas Bunkering Market Revenue (Million) Forecast, by Application 2019 & 2032
- Table 34: Nordics Liquefied Natural Gas Bunkering Market Volume (K Unit) Forecast, by Application 2019 & 2032
- Table 35: Rest of Europe Liquefied Natural Gas Bunkering Market Revenue (Million) Forecast, by Application 2019 & 2032
- Table 36: Rest of Europe Liquefied Natural Gas Bunkering Market Volume (K Unit) Forecast, by Application 2019 & 2032
- Table 37: Global Liquefied Natural Gas Bunkering Market Revenue Million Forecast, by Country 2019 & 2032
- Table 38: Global Liquefied Natural Gas Bunkering Market Volume K Unit Forecast, by Country 2019 & 2032
- Table 39: China Liquefied Natural Gas Bunkering Market Revenue (Million) Forecast, by Application 2019 & 2032
- Table 40: China Liquefied Natural Gas Bunkering Market Volume (K Unit) Forecast, by Application 2019 & 2032
- Table 41: Japan Liquefied Natural Gas Bunkering Market Revenue (Million) Forecast, by Application 2019 & 2032
- Table 42: Japan Liquefied Natural Gas Bunkering Market Volume (K Unit) Forecast, by Application 2019 & 2032
- Table 43: India Liquefied Natural Gas Bunkering Market Revenue (Million) Forecast, by Application 2019 & 2032
- Table 44: India Liquefied Natural Gas Bunkering Market Volume (K Unit) Forecast, by Application 2019 & 2032
- Table 45: South Korea Liquefied Natural Gas Bunkering Market Revenue (Million) Forecast, by Application 2019 & 2032
- Table 46: South Korea Liquefied Natural Gas Bunkering Market Volume (K Unit) Forecast, by Application 2019 & 2032
- Table 47: Southeast Asia Liquefied Natural Gas Bunkering Market Revenue (Million) Forecast, by Application 2019 & 2032
- Table 48: Southeast Asia Liquefied Natural Gas Bunkering Market Volume (K Unit) Forecast, by Application 2019 & 2032
- Table 49: Australia Liquefied Natural Gas Bunkering Market Revenue (Million) Forecast, by Application 2019 & 2032
- Table 50: Australia Liquefied Natural Gas Bunkering Market Volume (K Unit) Forecast, by Application 2019 & 2032
- Table 51: Indonesia Liquefied Natural Gas Bunkering Market Revenue (Million) Forecast, by Application 2019 & 2032
- Table 52: Indonesia Liquefied Natural Gas Bunkering Market Volume (K Unit) Forecast, by Application 2019 & 2032
- Table 53: Phillipes Liquefied Natural Gas Bunkering Market Revenue (Million) Forecast, by Application 2019 & 2032
- Table 54: Phillipes Liquefied Natural Gas Bunkering Market Volume (K Unit) Forecast, by Application 2019 & 2032
- Table 55: Singapore Liquefied Natural Gas Bunkering Market Revenue (Million) Forecast, by Application 2019 & 2032
- Table 56: Singapore Liquefied Natural Gas Bunkering Market Volume (K Unit) Forecast, by Application 2019 & 2032
- Table 57: Thailandc Liquefied Natural Gas Bunkering Market Revenue (Million) Forecast, by Application 2019 & 2032
- Table 58: Thailandc Liquefied Natural Gas Bunkering Market Volume (K Unit) Forecast, by Application 2019 & 2032
- Table 59: Rest of Asia Pacific Liquefied Natural Gas Bunkering Market Revenue (Million) Forecast, by Application 2019 & 2032
- Table 60: Rest of Asia Pacific Liquefied Natural Gas Bunkering Market Volume (K Unit) Forecast, by Application 2019 & 2032
- Table 61: Global Liquefied Natural Gas Bunkering Market Revenue Million Forecast, by Country 2019 & 2032
- Table 62: Global Liquefied Natural Gas Bunkering Market Volume K Unit Forecast, by Country 2019 & 2032
- Table 63: Brazil Liquefied Natural Gas Bunkering Market Revenue (Million) Forecast, by Application 2019 & 2032
- Table 64: Brazil Liquefied Natural Gas Bunkering Market Volume (K Unit) Forecast, by Application 2019 & 2032
- Table 65: Argentina Liquefied Natural Gas Bunkering Market Revenue (Million) Forecast, by Application 2019 & 2032
- Table 66: Argentina Liquefied Natural Gas Bunkering Market Volume (K Unit) Forecast, by Application 2019 & 2032
- Table 67: Peru Liquefied Natural Gas Bunkering Market Revenue (Million) Forecast, by Application 2019 & 2032
- Table 68: Peru Liquefied Natural Gas Bunkering Market Volume (K Unit) Forecast, by Application 2019 & 2032
- Table 69: Chile Liquefied Natural Gas Bunkering Market Revenue (Million) Forecast, by Application 2019 & 2032
- Table 70: Chile Liquefied Natural Gas Bunkering Market Volume (K Unit) Forecast, by Application 2019 & 2032
- Table 71: Colombia Liquefied Natural Gas Bunkering Market Revenue (Million) Forecast, by Application 2019 & 2032
- Table 72: Colombia Liquefied Natural Gas Bunkering Market Volume (K Unit) Forecast, by Application 2019 & 2032
- Table 73: Ecuador Liquefied Natural Gas Bunkering Market Revenue (Million) Forecast, by Application 2019 & 2032
- Table 74: Ecuador Liquefied Natural Gas Bunkering Market Volume (K Unit) Forecast, by Application 2019 & 2032
- Table 75: Venezuela Liquefied Natural Gas Bunkering Market Revenue (Million) Forecast, by Application 2019 & 2032
- Table 76: Venezuela Liquefied Natural Gas Bunkering Market Volume (K Unit) Forecast, by Application 2019 & 2032
- Table 77: Rest of South America Liquefied Natural Gas Bunkering Market Revenue (Million) Forecast, by Application 2019 & 2032
- Table 78: Rest of South America Liquefied Natural Gas Bunkering Market Volume (K Unit) Forecast, by Application 2019 & 2032
- Table 79: Global Liquefied Natural Gas Bunkering Market Revenue Million Forecast, by Country 2019 & 2032
- Table 80: Global Liquefied Natural Gas Bunkering Market Volume K Unit Forecast, by Country 2019 & 2032
- Table 81: United Arab Emirates Liquefied Natural Gas Bunkering Market Revenue (Million) Forecast, by Application 2019 & 2032
- Table 82: United Arab Emirates Liquefied Natural Gas Bunkering Market Volume (K Unit) Forecast, by Application 2019 & 2032
- Table 83: Saudi Arabia Liquefied Natural Gas Bunkering Market Revenue (Million) Forecast, by Application 2019 & 2032
- Table 84: Saudi Arabia Liquefied Natural Gas Bunkering Market Volume (K Unit) Forecast, by Application 2019 & 2032
- Table 85: South Africa Liquefied Natural Gas Bunkering Market Revenue (Million) Forecast, by Application 2019 & 2032
- Table 86: South Africa Liquefied Natural Gas Bunkering Market Volume (K Unit) Forecast, by Application 2019 & 2032
- Table 87: Rest of Middle East and Africa Liquefied Natural Gas Bunkering Market Revenue (Million) Forecast, by Application 2019 & 2032
- Table 88: Rest of Middle East and Africa Liquefied Natural Gas Bunkering Market Volume (K Unit) Forecast, by Application 2019 & 2032
- Table 89: Global Liquefied Natural Gas Bunkering Market Revenue Million Forecast, by End User 2019 & 2032
- Table 90: Global Liquefied Natural Gas Bunkering Market Volume K Unit Forecast, by End User 2019 & 2032
- Table 91: Global Liquefied Natural Gas Bunkering Market Revenue Million Forecast, by Country 2019 & 2032
- Table 92: Global Liquefied Natural Gas Bunkering Market Volume K Unit Forecast, by Country 2019 & 2032
- Table 93: Global Liquefied Natural Gas Bunkering Market Revenue Million Forecast, by End User 2019 & 2032
- Table 94: Global Liquefied Natural Gas Bunkering Market Volume K Unit Forecast, by End User 2019 & 2032
- Table 95: Global Liquefied Natural Gas Bunkering Market Revenue Million Forecast, by Country 2019 & 2032
- Table 96: Global Liquefied Natural Gas Bunkering Market Volume K Unit Forecast, by Country 2019 & 2032
- Table 97: Global Liquefied Natural Gas Bunkering Market Revenue Million Forecast, by End User 2019 & 2032
- Table 98: Global Liquefied Natural Gas Bunkering Market Volume K Unit Forecast, by End User 2019 & 2032
- Table 99: Global Liquefied Natural Gas Bunkering Market Revenue Million Forecast, by Country 2019 & 2032
- Table 100: Global Liquefied Natural Gas Bunkering Market Volume K Unit Forecast, by Country 2019 & 2032
- Table 101: Global Liquefied Natural Gas Bunkering Market Revenue Million Forecast, by End User 2019 & 2032
- Table 102: Global Liquefied Natural Gas Bunkering Market Volume K Unit Forecast, by End User 2019 & 2032
- Table 103: Global Liquefied Natural Gas Bunkering Market Revenue Million Forecast, by Country 2019 & 2032
- Table 104: Global Liquefied Natural Gas Bunkering Market Volume K Unit Forecast, by Country 2019 & 2032
- Table 105: Global Liquefied Natural Gas Bunkering Market Revenue Million Forecast, by End User 2019 & 2032
- Table 106: Global Liquefied Natural Gas Bunkering Market Volume K Unit Forecast, by End User 2019 & 2032
- Table 107: Global Liquefied Natural Gas Bunkering Market Revenue Million Forecast, by Country 2019 & 2032
- Table 108: Global Liquefied Natural Gas Bunkering Market Volume K Unit Forecast, by Country 2019 & 2032
Frequently Asked Questions
1. What is the projected Compound Annual Growth Rate (CAGR) of the Liquefied Natural Gas Bunkering Market?
The projected CAGR is approximately 30.20%.
2. Which companies are prominent players in the Liquefied Natural Gas Bunkering Market?
Key companies in the market include Shell PLC, Harvey Gulf International Marine LLC, Engie SA, Korea Gas Corporation, Gazprom Neft PJSC, ENN Energy Holdings Ltd, Gasum Oy, Naturgy Energy Group SA, TotalEnergies SE.
3. What are the main segments of the Liquefied Natural Gas Bunkering Market?
The market segments include End User.
4. Can you provide details about the market size?
The market size is estimated to be USD 1.26 Million as of 2022.
5. What are some drivers contributing to market growth?
4.; Modernization and Upgrades of Existing Military Aircraft Fleets4.; Increasing Defense Budgets.
6. What are the notable trends driving market growth?
Tanker Fleet to Witness Significant Growth.
7. Are there any restraints impacting market growth?
4.; Shift Toward Unmanned Aircraft.
8. Can you provide examples of recent developments in the market?
In January 2022, CMA CGM signed a ten-year contract with Shanghai International Port Group to use LNG as a bunker fuel in the Yangshan port area. CMA CGM's dual-fuelled 15,000 TEU box ships on the Pearl River Express route from China to Los Angeles will bunker in the Yangshan area.
9. What pricing options are available for accessing the report?
Pricing options include single-user, multi-user, and enterprise licenses priced at USD 4750, USD 5250, and USD 8750 respectively.
10. Is the market size provided in terms of value or volume?
The market size is provided in terms of value, measured in Million and volume, measured in K Unit.
11. Are there any specific market keywords associated with the report?
Yes, the market keyword associated with the report is "Liquefied Natural Gas Bunkering Market," which aids in identifying and referencing the specific market segment covered.
12. How do I determine which pricing option suits my needs best?
The pricing options vary based on user requirements and access needs. Individual users may opt for single-user licenses, while businesses requiring broader access may choose multi-user or enterprise licenses for cost-effective access to the report.
13. Are there any additional resources or data provided in the Liquefied Natural Gas Bunkering Market report?
While the report offers comprehensive insights, it's advisable to review the specific contents or supplementary materials provided to ascertain if additional resources or data are available.
14. How can I stay updated on further developments or reports in the Liquefied Natural Gas Bunkering Market?
To stay informed about further developments, trends, and reports in the Liquefied Natural Gas Bunkering Market, consider subscribing to industry newsletters, following relevant companies and organizations, or regularly checking reputable industry news sources and publications.
Methodology
Step 1 - Identification of Relevant Samples Size from Population Database


Step 2 - Approaches for Defining Global Market Size (Value, Volume* & Price*)

Note*: In applicable scenarios
Step 3 - Data Sources
Primary Research
- Web Analytics
- Survey Reports
- Research Institute
- Latest Research Reports
- Opinion Leaders
Secondary Research
- Annual Reports
- White Paper
- Latest Press Release
- Industry Association
- Paid Database
- Investor Presentations

Step 4 - Data Triangulation
Involves using different sources of information in order to increase the validity of a study
These sources are likely to be stakeholders in a program - participants, other researchers, program staff, other community members, and so on.
Then we put all data in single framework & apply various statistical tools to find out the dynamic on the market.
During the analysis stage, feedback from the stakeholder groups would be compared to determine areas of agreement as well as areas of divergence


