
Key Insights
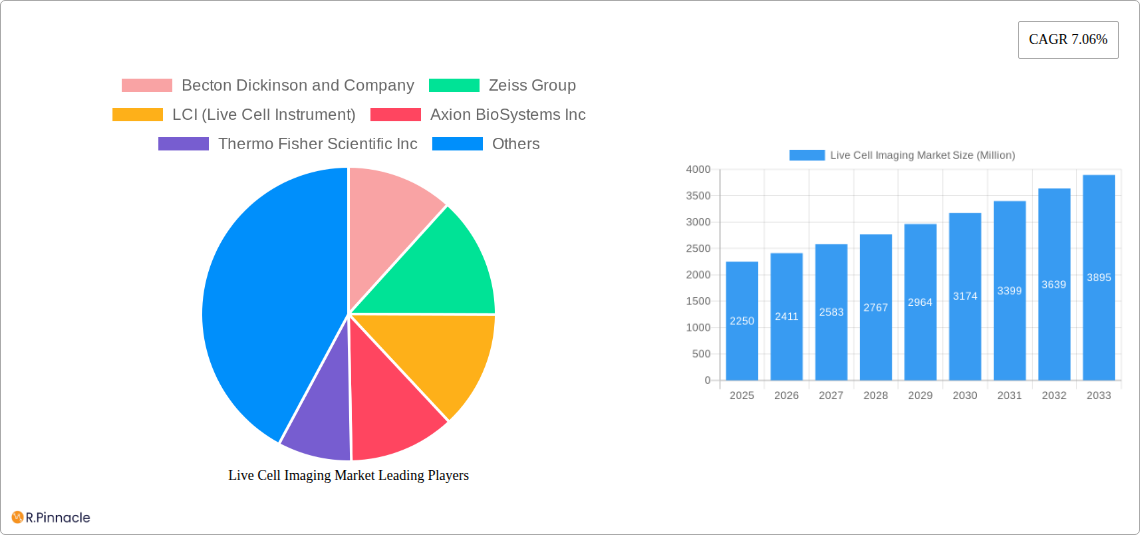
The live cell imaging market, valued at $2.25 billion in 2025, is projected to experience robust growth, driven by a compound annual growth rate (CAGR) of 7.06% from 2025 to 2033. This expansion is fueled by several key factors. The increasing prevalence of chronic diseases necessitates advanced research and development in drug discovery and personalized medicine, significantly boosting the demand for live cell imaging systems. Furthermore, advancements in technology, such as the development of high-resolution imaging techniques, automated image analysis software, and improved fluorescent probes, are enhancing the capabilities and accessibility of live cell imaging, thereby driving market growth. The rising adoption of live cell imaging in various biological research areas, including cell biology, developmental biology, and stem cell research, also contributes significantly to market expansion. The integration of artificial intelligence (AI) and machine learning (ML) in image analysis is streamlining workflows and improving the accuracy of data interpretation, further stimulating market adoption.
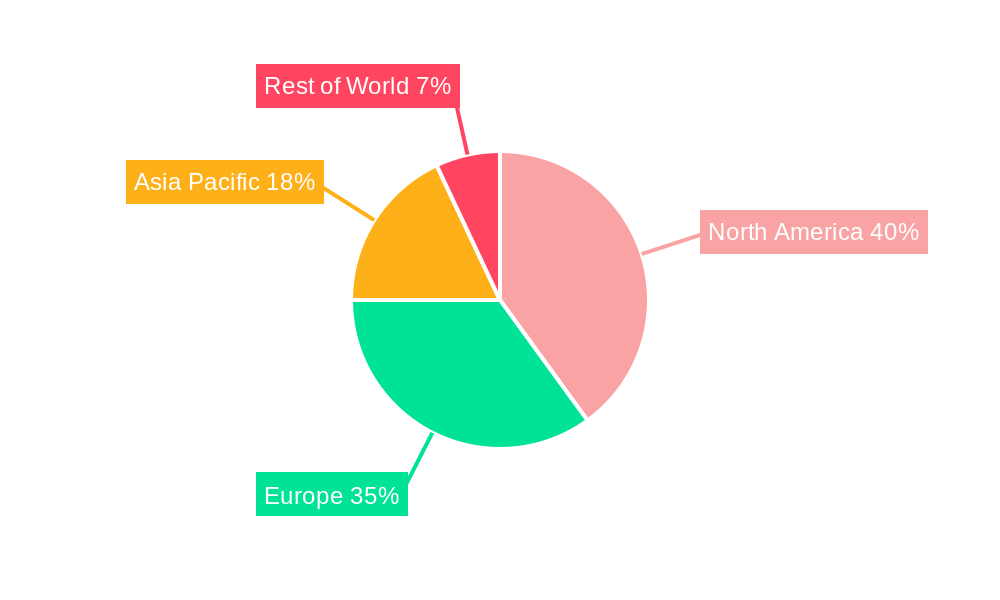
Market segmentation reveals a strong demand for consumables, including image capturing devices and other consumables like software and services. The application segments show strong growth across cell biology, developmental biology, stem cell biology, and particularly drug discovery. Geographically, North America and Europe currently hold significant market share due to established research infrastructure and high healthcare spending. However, the Asia-Pacific region is poised for substantial growth in the coming years, driven by increasing research funding and technological advancements in countries like China, Japan, and India. Competitive dynamics are shaped by major players like Becton Dickinson, Zeiss, Thermo Fisher Scientific, and Danaher, among others, who are continually investing in research and development to maintain market leadership and introduce innovative solutions. The market's future hinges on continuous technological innovations, increasing research funding, and the expanding applications of live cell imaging across diverse biological research fields.
Live Cell Imaging Market Report: 2019-2033
This comprehensive report provides a detailed analysis of the Live Cell Imaging market, offering invaluable insights for industry professionals, investors, and researchers. Covering the period from 2019 to 2033, with a focus on 2025, this report meticulously examines market dynamics, key players, technological advancements, and future growth prospects. The market is projected to reach xx Million by 2033, exhibiting a significant CAGR.
Live Cell Imaging Market Structure & Innovation Trends
The Live Cell Imaging market is moderately consolidated, with several key players holding significant market share. Becton Dickinson and Company, Zeiss Group, Thermo Fisher Scientific Inc, and Danaher (Leica Microsystems) are among the leading companies, collectively accounting for approximately xx% of the market in 2025. However, smaller companies and startups are also contributing to innovation, particularly in niche applications.
- Market Concentration: Moderately consolidated, with top players holding xx% market share in 2025.
- Innovation Drivers: Advancements in microscopy techniques (e.g., super-resolution microscopy), AI-powered image analysis, and the development of novel fluorescent probes.
- Regulatory Frameworks: Vary by region but generally focus on safety and efficacy of imaging equipment and reagents. Compliance with regulations like FDA and CE marking is crucial.
- Product Substitutes: Limited direct substitutes, though alternative techniques like traditional histology may be used in some cases.
- End-User Demographics: Primarily research institutions (universities, pharmaceutical companies, biotech firms), hospitals, and clinical diagnostic labs.
- M&A Activities: The market has witnessed several mergers and acquisitions in recent years, with deal values ranging from xx Million to xx Million. These activities reflect the strategic importance of live cell imaging technology and the desire to expand product portfolios and market reach.
Live Cell Imaging Market Dynamics & Trends
The Live Cell Imaging market is experiencing robust growth, driven by factors such as the increasing prevalence of chronic diseases, the rising demand for personalized medicine, and the growing adoption of advanced imaging techniques in research and drug discovery. The market is witnessing technological disruptions with the advent of AI-powered image analysis and high-content screening, allowing for faster and more efficient data analysis. This, coupled with increasing consumer preference for non-invasive techniques, is bolstering market growth. Competitive dynamics are intense, with companies focusing on innovation, strategic partnerships, and geographical expansion to gain a competitive edge.
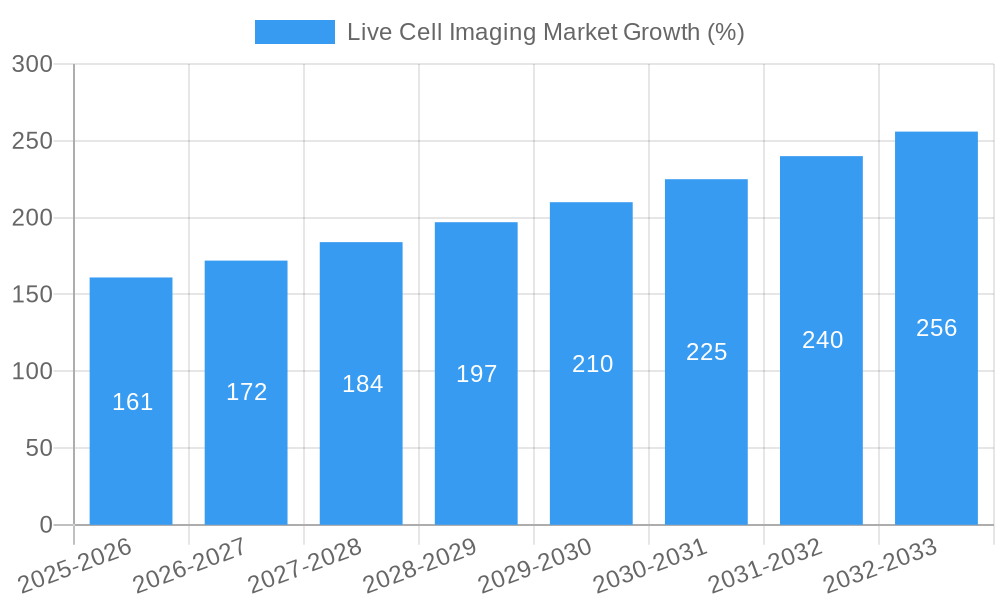
The market is projected to grow at a CAGR of xx% during the forecast period (2025-2033), reaching a market value of xx Million by 2033. Market penetration in key applications like drug discovery is steadily increasing, indicating a growing reliance on live cell imaging for research and development.
Dominant Regions & Segments in Live Cell Imaging Market
North America currently dominates the Live Cell Imaging market, driven by strong research funding, a high concentration of pharmaceutical and biotechnology companies, and advanced healthcare infrastructure. However, the Asia-Pacific region is expected to witness significant growth in the coming years, fuelled by increasing government investments in research and development, a rising number of research institutions, and a growing awareness of advanced diagnostic tools.
Key Drivers by Region:
- North America: Strong R&D spending, established healthcare infrastructure, high adoption rate of advanced technologies.
- Europe: Growing research activities, increasing focus on personalized medicine, supportive regulatory environment.
- Asia-Pacific: Rising investments in healthcare infrastructure, increasing number of research institutions, expanding pharmaceutical industry.
Dominant Segments:
- By Product: Equipment segment holds the largest market share, driven by increasing demand for high-throughput screening systems and advanced microscopy platforms.
- By Application: Drug discovery and cell biology are the leading applications, owing to the crucial role of live cell imaging in understanding cellular processes and drug mechanisms.
- By Image Capturing Devices: The consumables segment is experiencing high growth due to increasing demand for specialized reagents and dyes.
- Other Consumables & Software & Services: Software and services are increasingly important, driven by the need for sophisticated image analysis and data management tools.
Live Cell Imaging Market Product Innovations
Recent product developments include AI-powered image analysis software that significantly improves the efficiency and accuracy of data interpretation, and advanced microscopy platforms offering high-resolution imaging with minimal phototoxicity. These innovations enhance the capabilities of live cell imaging, enabling researchers to gather more comprehensive and reliable data, thus improving the speed and effectiveness of research. The market fit for these innovations is excellent, addressing the needs for higher throughput, improved image quality, and reduced experimental costs.
Report Scope & Segmentation Analysis
This report segments the Live Cell Imaging market by product (equipment, consumables, software, services), application (cell biology, developmental biology, stem cell biology, drug discovery, other applications), and image capturing devices (consumables, other consumables). Each segment demonstrates varying growth projections and competitive dynamics. For example, the equipment segment is expected to witness significant growth driven by the introduction of sophisticated and versatile microscopy systems. The consumables segment is also expected to exhibit strong growth due to the increasing use of advanced reagents for cell labeling and imaging. The drug discovery application segment is experiencing the highest growth, reflecting the crucial role of live cell imaging in this field.
Key Drivers of Live Cell Imaging Market Growth
The Live Cell Imaging market is propelled by several key factors: the increasing adoption of advanced microscopy techniques for drug discovery and personalized medicine, the growing demand for high-throughput screening systems, and ongoing technological advancements in image analysis and data processing. Government funding for research and development in life sciences is another important driver. Furthermore, the growing prevalence of chronic diseases and the rising need for faster and more accurate diagnoses fuels the need for advanced live cell imaging solutions.
Challenges in the Live Cell Imaging Market Sector
Challenges facing the Live Cell Imaging market include the high cost of advanced microscopy systems, the complexity of image analysis, and the need for specialized expertise. Supply chain disruptions and competition from alternative imaging techniques can also impact market growth. The regulatory environment varies across regions and countries, posing additional compliance challenges for manufacturers and users.
Emerging Opportunities in Live Cell Imaging Market
Emerging opportunities include the growing application of live cell imaging in areas like regenerative medicine and personalized cancer therapy, and the expansion of the market into developing economies. The integration of AI and machine learning into image analysis tools presents significant growth opportunities, along with the development of new and improved fluorescent probes and dyes. The demand for cloud-based image analysis platforms is also growing rapidly.
Leading Players in the Live Cell Imaging Market
- Becton Dickinson and Company
- Zeiss Group
- LCI (Live Cell Instrument)
- Axion BioSystems Inc
- Thermo Fisher Scientific Inc
- Danaher (Leica Microsystems)
- Agilent Technologies Inc
- Sartorius AG
- Nikon Corporation Inc
- Olympus Corporation (EVIDENT)
- Merck KGaA (Sigma- Aldrich Corporation)
- PerkinElmer Inc
Key Developments in Live Cell Imaging Market Industry
- June 2023: Nanolive launched the 3D Cell Explorer 96focus, an innovative platform enhancing label-free live cell imaging with AI-powered digital assays. This streamlined, cost-effective system significantly impacts high-content analysis capabilities.
- February 2023: Nikon Corporation launched the Nikon Spatial Array Confocal (NSPARC) detector for AX systems, enabling high-resolution live tissue imaging with reduced phototoxicity. This improves the quality and efficiency of research involving live tissue.
Future Outlook for Live Cell Imaging Market
The Live Cell Imaging market is poised for continued growth, driven by technological advancements, increasing research funding, and the expanding application of live cell imaging across various fields. Strategic partnerships and collaborations between companies will play a critical role in shaping the future of the market. The increasing use of AI and machine learning, the development of new imaging modalities, and the focus on personalized medicine are expected to drive market expansion in the coming years.
Live Cell Imaging Market Segmentation
-
1. Product
-
1.1. Equipment
- 1.1.1. Standalone Systems
- 1.1.2. Microscopes
- 1.1.3. Cell Analyzers
- 1.1.4. Image Capturing Devices
-
1.2. Consumables
- 1.2.1. Reagents and Kits
- 1.2.2. Other Consumables
- 1.3. Software and Services
-
1.1. Equipment
-
2. Application
- 2.1. Cell Biology
- 2.2. Developmental Biology
- 2.3. Stem Cell Biology
- 2.4. Drug Discovery
- 2.5. Other Applications
Live Cell Imaging Market Segmentation By Geography
-
1. North America
- 1.1. United States
- 1.2. Canada
- 1.3. Mexico
-
2. Europe
- 2.1. Germany
- 2.2. United Kingdom
- 2.3. France
- 2.4. Italy
- 2.5. Spain
- 2.6. Rest of Europe
-
3. Asia Pacific
- 3.1. China
- 3.2. Japan
- 3.3. India
- 3.4. Australia
- 3.5. South Korea
- 3.6. Rest of Asia Pacific
-
4. Middle East and Africa
- 4.1. GCC
- 4.2. South Africa
- 4.3. Rest of Middle East and Africa
-
5. South America
- 5.1. Brazil
- 5.2. Argentina
- 5.3. Rest of South America
Live Cell Imaging Market REPORT HIGHLIGHTS
| Aspects | Details |
|---|---|
| Study Period | 2019-2033 |
| Base Year | 2024 |
| Estimated Year | 2025 |
| Forecast Period | 2025-2033 |
| Historical Period | 2019-2024 |
| Growth Rate | CAGR of 7.06% from 2019-2033 |
| Segmentation |
|
Table of Contents
- 1. Introduction
- 1.1. Research Scope
- 1.2. Market Segmentation
- 1.3. Research Methodology
- 1.4. Definitions and Assumptions
- 2. Executive Summary
- 2.1. Introduction
- 3. Market Dynamics
- 3.1. Introduction
- 3.2. Market Drivers
- 3.2.1. Adoption of High-content Screening Techniques in Drug Discovery; Rising Prevalence of Chronic Disease Demanding Higher and Quicker Diagnostic Facilities; Government Funding for Cell-based Research
- 3.3. Market Restrains
- 3.3.1. High Cost of High-content Screening Systems; Shortage of Skilled Professionals
- 3.4. Market Trends
- 3.4.1. Standalone Systems Segment is Expected to Hold a Significant Market Share Over the Forecast Period
- 4. Market Factor Analysis
- 4.1. Porters Five Forces
- 4.2. Supply/Value Chain
- 4.3. PESTEL analysis
- 4.4. Market Entropy
- 4.5. Patent/Trademark Analysis
- 5. Global Live Cell Imaging Market Analysis, Insights and Forecast, 2019-2031
- 5.1. Market Analysis, Insights and Forecast - by Product
- 5.1.1. Equipment
- 5.1.1.1. Standalone Systems
- 5.1.1.2. Microscopes
- 5.1.1.3. Cell Analyzers
- 5.1.1.4. Image Capturing Devices
- 5.1.2. Consumables
- 5.1.2.1. Reagents and Kits
- 5.1.2.2. Other Consumables
- 5.1.3. Software and Services
- 5.1.1. Equipment
- 5.2. Market Analysis, Insights and Forecast - by Application
- 5.2.1. Cell Biology
- 5.2.2. Developmental Biology
- 5.2.3. Stem Cell Biology
- 5.2.4. Drug Discovery
- 5.2.5. Other Applications
- 5.3. Market Analysis, Insights and Forecast - by Region
- 5.3.1. North America
- 5.3.2. Europe
- 5.3.3. Asia Pacific
- 5.3.4. Middle East and Africa
- 5.3.5. South America
- 5.1. Market Analysis, Insights and Forecast - by Product
- 6. North America Live Cell Imaging Market Analysis, Insights and Forecast, 2019-2031
- 6.1. Market Analysis, Insights and Forecast - by Product
- 6.1.1. Equipment
- 6.1.1.1. Standalone Systems
- 6.1.1.2. Microscopes
- 6.1.1.3. Cell Analyzers
- 6.1.1.4. Image Capturing Devices
- 6.1.2. Consumables
- 6.1.2.1. Reagents and Kits
- 6.1.2.2. Other Consumables
- 6.1.3. Software and Services
- 6.1.1. Equipment
- 6.2. Market Analysis, Insights and Forecast - by Application
- 6.2.1. Cell Biology
- 6.2.2. Developmental Biology
- 6.2.3. Stem Cell Biology
- 6.2.4. Drug Discovery
- 6.2.5. Other Applications
- 6.1. Market Analysis, Insights and Forecast - by Product
- 7. Europe Live Cell Imaging Market Analysis, Insights and Forecast, 2019-2031
- 7.1. Market Analysis, Insights and Forecast - by Product
- 7.1.1. Equipment
- 7.1.1.1. Standalone Systems
- 7.1.1.2. Microscopes
- 7.1.1.3. Cell Analyzers
- 7.1.1.4. Image Capturing Devices
- 7.1.2. Consumables
- 7.1.2.1. Reagents and Kits
- 7.1.2.2. Other Consumables
- 7.1.3. Software and Services
- 7.1.1. Equipment
- 7.2. Market Analysis, Insights and Forecast - by Application
- 7.2.1. Cell Biology
- 7.2.2. Developmental Biology
- 7.2.3. Stem Cell Biology
- 7.2.4. Drug Discovery
- 7.2.5. Other Applications
- 7.1. Market Analysis, Insights and Forecast - by Product
- 8. Asia Pacific Live Cell Imaging Market Analysis, Insights and Forecast, 2019-2031
- 8.1. Market Analysis, Insights and Forecast - by Product
- 8.1.1. Equipment
- 8.1.1.1. Standalone Systems
- 8.1.1.2. Microscopes
- 8.1.1.3. Cell Analyzers
- 8.1.1.4. Image Capturing Devices
- 8.1.2. Consumables
- 8.1.2.1. Reagents and Kits
- 8.1.2.2. Other Consumables
- 8.1.3. Software and Services
- 8.1.1. Equipment
- 8.2. Market Analysis, Insights and Forecast - by Application
- 8.2.1. Cell Biology
- 8.2.2. Developmental Biology
- 8.2.3. Stem Cell Biology
- 8.2.4. Drug Discovery
- 8.2.5. Other Applications
- 8.1. Market Analysis, Insights and Forecast - by Product
- 9. Middle East and Africa Live Cell Imaging Market Analysis, Insights and Forecast, 2019-2031
- 9.1. Market Analysis, Insights and Forecast - by Product
- 9.1.1. Equipment
- 9.1.1.1. Standalone Systems
- 9.1.1.2. Microscopes
- 9.1.1.3. Cell Analyzers
- 9.1.1.4. Image Capturing Devices
- 9.1.2. Consumables
- 9.1.2.1. Reagents and Kits
- 9.1.2.2. Other Consumables
- 9.1.3. Software and Services
- 9.1.1. Equipment
- 9.2. Market Analysis, Insights and Forecast - by Application
- 9.2.1. Cell Biology
- 9.2.2. Developmental Biology
- 9.2.3. Stem Cell Biology
- 9.2.4. Drug Discovery
- 9.2.5. Other Applications
- 9.1. Market Analysis, Insights and Forecast - by Product
- 10. South America Live Cell Imaging Market Analysis, Insights and Forecast, 2019-2031
- 10.1. Market Analysis, Insights and Forecast - by Product
- 10.1.1. Equipment
- 10.1.1.1. Standalone Systems
- 10.1.1.2. Microscopes
- 10.1.1.3. Cell Analyzers
- 10.1.1.4. Image Capturing Devices
- 10.1.2. Consumables
- 10.1.2.1. Reagents and Kits
- 10.1.2.2. Other Consumables
- 10.1.3. Software and Services
- 10.1.1. Equipment
- 10.2. Market Analysis, Insights and Forecast - by Application
- 10.2.1. Cell Biology
- 10.2.2. Developmental Biology
- 10.2.3. Stem Cell Biology
- 10.2.4. Drug Discovery
- 10.2.5. Other Applications
- 10.1. Market Analysis, Insights and Forecast - by Product
- 11. North America Live Cell Imaging Market Analysis, Insights and Forecast, 2019-2031
- 11.1. Market Analysis, Insights and Forecast - By Country/Sub-region
- 11.1.1 United States
- 11.1.2 Canada
- 11.1.3 Mexico
- 12. Europe Live Cell Imaging Market Analysis, Insights and Forecast, 2019-2031
- 12.1. Market Analysis, Insights and Forecast - By Country/Sub-region
- 12.1.1 Germany
- 12.1.2 United Kingdom
- 12.1.3 France
- 12.1.4 Italy
- 12.1.5 Spain
- 12.1.6 Rest of Europe
- 13. Asia Pacific Live Cell Imaging Market Analysis, Insights and Forecast, 2019-2031
- 13.1. Market Analysis, Insights and Forecast - By Country/Sub-region
- 13.1.1 China
- 13.1.2 Japan
- 13.1.3 India
- 13.1.4 Australia
- 13.1.5 South Korea
- 13.1.6 Rest of Asia Pacific
- 14. Middle East and Africa Live Cell Imaging Market Analysis, Insights and Forecast, 2019-2031
- 14.1. Market Analysis, Insights and Forecast - By Country/Sub-region
- 14.1.1 GCC
- 14.1.2 South Africa
- 14.1.3 Rest of Middle East and Africa
- 15. South America Live Cell Imaging Market Analysis, Insights and Forecast, 2019-2031
- 15.1. Market Analysis, Insights and Forecast - By Country/Sub-region
- 15.1.1 Brazil
- 15.1.2 Argentina
- 15.1.3 Rest of South America
- 16. Competitive Analysis
- 16.1. Global Market Share Analysis 2024
- 16.2. Company Profiles
- 16.2.1 Becton Dickinson and Company
- 16.2.1.1. Overview
- 16.2.1.2. Products
- 16.2.1.3. SWOT Analysis
- 16.2.1.4. Recent Developments
- 16.2.1.5. Financials (Based on Availability)
- 16.2.2 Zeiss Group
- 16.2.2.1. Overview
- 16.2.2.2. Products
- 16.2.2.3. SWOT Analysis
- 16.2.2.4. Recent Developments
- 16.2.2.5. Financials (Based on Availability)
- 16.2.3 LCI (Live Cell Instrument)
- 16.2.3.1. Overview
- 16.2.3.2. Products
- 16.2.3.3. SWOT Analysis
- 16.2.3.4. Recent Developments
- 16.2.3.5. Financials (Based on Availability)
- 16.2.4 Axion BioSystems Inc
- 16.2.4.1. Overview
- 16.2.4.2. Products
- 16.2.4.3. SWOT Analysis
- 16.2.4.4. Recent Developments
- 16.2.4.5. Financials (Based on Availability)
- 16.2.5 Thermo Fisher Scientific Inc
- 16.2.5.1. Overview
- 16.2.5.2. Products
- 16.2.5.3. SWOT Analysis
- 16.2.5.4. Recent Developments
- 16.2.5.5. Financials (Based on Availability)
- 16.2.6 Danaher (Leica Microsystems)
- 16.2.6.1. Overview
- 16.2.6.2. Products
- 16.2.6.3. SWOT Analysis
- 16.2.6.4. Recent Developments
- 16.2.6.5. Financials (Based on Availability)
- 16.2.7 Agilent Technologies Inc
- 16.2.7.1. Overview
- 16.2.7.2. Products
- 16.2.7.3. SWOT Analysis
- 16.2.7.4. Recent Developments
- 16.2.7.5. Financials (Based on Availability)
- 16.2.8 Sartorius AG*List Not Exhaustive
- 16.2.8.1. Overview
- 16.2.8.2. Products
- 16.2.8.3. SWOT Analysis
- 16.2.8.4. Recent Developments
- 16.2.8.5. Financials (Based on Availability)
- 16.2.9 Nikon Corporation Inc
- 16.2.9.1. Overview
- 16.2.9.2. Products
- 16.2.9.3. SWOT Analysis
- 16.2.9.4. Recent Developments
- 16.2.9.5. Financials (Based on Availability)
- 16.2.10 Olympus Corporation (EVIDENT)
- 16.2.10.1. Overview
- 16.2.10.2. Products
- 16.2.10.3. SWOT Analysis
- 16.2.10.4. Recent Developments
- 16.2.10.5. Financials (Based on Availability)
- 16.2.11 Merck KGaA (Sigma- Aldrich Corporation)
- 16.2.11.1. Overview
- 16.2.11.2. Products
- 16.2.11.3. SWOT Analysis
- 16.2.11.4. Recent Developments
- 16.2.11.5. Financials (Based on Availability)
- 16.2.12 PerkinElmer Inc
- 16.2.12.1. Overview
- 16.2.12.2. Products
- 16.2.12.3. SWOT Analysis
- 16.2.12.4. Recent Developments
- 16.2.12.5. Financials (Based on Availability)
- 16.2.1 Becton Dickinson and Company
List of Figures
- Figure 1: Global Live Cell Imaging Market Revenue Breakdown (Million, %) by Region 2024 & 2032
- Figure 2: North America Live Cell Imaging Market Revenue (Million), by Country 2024 & 2032
- Figure 3: North America Live Cell Imaging Market Revenue Share (%), by Country 2024 & 2032
- Figure 4: Europe Live Cell Imaging Market Revenue (Million), by Country 2024 & 2032
- Figure 5: Europe Live Cell Imaging Market Revenue Share (%), by Country 2024 & 2032
- Figure 6: Asia Pacific Live Cell Imaging Market Revenue (Million), by Country 2024 & 2032
- Figure 7: Asia Pacific Live Cell Imaging Market Revenue Share (%), by Country 2024 & 2032
- Figure 8: Middle East and Africa Live Cell Imaging Market Revenue (Million), by Country 2024 & 2032
- Figure 9: Middle East and Africa Live Cell Imaging Market Revenue Share (%), by Country 2024 & 2032
- Figure 10: South America Live Cell Imaging Market Revenue (Million), by Country 2024 & 2032
- Figure 11: South America Live Cell Imaging Market Revenue Share (%), by Country 2024 & 2032
- Figure 12: North America Live Cell Imaging Market Revenue (Million), by Product 2024 & 2032
- Figure 13: North America Live Cell Imaging Market Revenue Share (%), by Product 2024 & 2032
- Figure 14: North America Live Cell Imaging Market Revenue (Million), by Application 2024 & 2032
- Figure 15: North America Live Cell Imaging Market Revenue Share (%), by Application 2024 & 2032
- Figure 16: North America Live Cell Imaging Market Revenue (Million), by Country 2024 & 2032
- Figure 17: North America Live Cell Imaging Market Revenue Share (%), by Country 2024 & 2032
- Figure 18: Europe Live Cell Imaging Market Revenue (Million), by Product 2024 & 2032
- Figure 19: Europe Live Cell Imaging Market Revenue Share (%), by Product 2024 & 2032
- Figure 20: Europe Live Cell Imaging Market Revenue (Million), by Application 2024 & 2032
- Figure 21: Europe Live Cell Imaging Market Revenue Share (%), by Application 2024 & 2032
- Figure 22: Europe Live Cell Imaging Market Revenue (Million), by Country 2024 & 2032
- Figure 23: Europe Live Cell Imaging Market Revenue Share (%), by Country 2024 & 2032
- Figure 24: Asia Pacific Live Cell Imaging Market Revenue (Million), by Product 2024 & 2032
- Figure 25: Asia Pacific Live Cell Imaging Market Revenue Share (%), by Product 2024 & 2032
- Figure 26: Asia Pacific Live Cell Imaging Market Revenue (Million), by Application 2024 & 2032
- Figure 27: Asia Pacific Live Cell Imaging Market Revenue Share (%), by Application 2024 & 2032
- Figure 28: Asia Pacific Live Cell Imaging Market Revenue (Million), by Country 2024 & 2032
- Figure 29: Asia Pacific Live Cell Imaging Market Revenue Share (%), by Country 2024 & 2032
- Figure 30: Middle East and Africa Live Cell Imaging Market Revenue (Million), by Product 2024 & 2032
- Figure 31: Middle East and Africa Live Cell Imaging Market Revenue Share (%), by Product 2024 & 2032
- Figure 32: Middle East and Africa Live Cell Imaging Market Revenue (Million), by Application 2024 & 2032
- Figure 33: Middle East and Africa Live Cell Imaging Market Revenue Share (%), by Application 2024 & 2032
- Figure 34: Middle East and Africa Live Cell Imaging Market Revenue (Million), by Country 2024 & 2032
- Figure 35: Middle East and Africa Live Cell Imaging Market Revenue Share (%), by Country 2024 & 2032
- Figure 36: South America Live Cell Imaging Market Revenue (Million), by Product 2024 & 2032
- Figure 37: South America Live Cell Imaging Market Revenue Share (%), by Product 2024 & 2032
- Figure 38: South America Live Cell Imaging Market Revenue (Million), by Application 2024 & 2032
- Figure 39: South America Live Cell Imaging Market Revenue Share (%), by Application 2024 & 2032
- Figure 40: South America Live Cell Imaging Market Revenue (Million), by Country 2024 & 2032
- Figure 41: South America Live Cell Imaging Market Revenue Share (%), by Country 2024 & 2032
List of Tables
- Table 1: Global Live Cell Imaging Market Revenue Million Forecast, by Region 2019 & 2032
- Table 2: Global Live Cell Imaging Market Revenue Million Forecast, by Product 2019 & 2032
- Table 3: Global Live Cell Imaging Market Revenue Million Forecast, by Application 2019 & 2032
- Table 4: Global Live Cell Imaging Market Revenue Million Forecast, by Region 2019 & 2032
- Table 5: Global Live Cell Imaging Market Revenue Million Forecast, by Country 2019 & 2032
- Table 6: United States Live Cell Imaging Market Revenue (Million) Forecast, by Application 2019 & 2032
- Table 7: Canada Live Cell Imaging Market Revenue (Million) Forecast, by Application 2019 & 2032
- Table 8: Mexico Live Cell Imaging Market Revenue (Million) Forecast, by Application 2019 & 2032
- Table 9: Global Live Cell Imaging Market Revenue Million Forecast, by Country 2019 & 2032
- Table 10: Germany Live Cell Imaging Market Revenue (Million) Forecast, by Application 2019 & 2032
- Table 11: United Kingdom Live Cell Imaging Market Revenue (Million) Forecast, by Application 2019 & 2032
- Table 12: France Live Cell Imaging Market Revenue (Million) Forecast, by Application 2019 & 2032
- Table 13: Italy Live Cell Imaging Market Revenue (Million) Forecast, by Application 2019 & 2032
- Table 14: Spain Live Cell Imaging Market Revenue (Million) Forecast, by Application 2019 & 2032
- Table 15: Rest of Europe Live Cell Imaging Market Revenue (Million) Forecast, by Application 2019 & 2032
- Table 16: Global Live Cell Imaging Market Revenue Million Forecast, by Country 2019 & 2032
- Table 17: China Live Cell Imaging Market Revenue (Million) Forecast, by Application 2019 & 2032
- Table 18: Japan Live Cell Imaging Market Revenue (Million) Forecast, by Application 2019 & 2032
- Table 19: India Live Cell Imaging Market Revenue (Million) Forecast, by Application 2019 & 2032
- Table 20: Australia Live Cell Imaging Market Revenue (Million) Forecast, by Application 2019 & 2032
- Table 21: South Korea Live Cell Imaging Market Revenue (Million) Forecast, by Application 2019 & 2032
- Table 22: Rest of Asia Pacific Live Cell Imaging Market Revenue (Million) Forecast, by Application 2019 & 2032
- Table 23: Global Live Cell Imaging Market Revenue Million Forecast, by Country 2019 & 2032
- Table 24: GCC Live Cell Imaging Market Revenue (Million) Forecast, by Application 2019 & 2032
- Table 25: South Africa Live Cell Imaging Market Revenue (Million) Forecast, by Application 2019 & 2032
- Table 26: Rest of Middle East and Africa Live Cell Imaging Market Revenue (Million) Forecast, by Application 2019 & 2032
- Table 27: Global Live Cell Imaging Market Revenue Million Forecast, by Country 2019 & 2032
- Table 28: Brazil Live Cell Imaging Market Revenue (Million) Forecast, by Application 2019 & 2032
- Table 29: Argentina Live Cell Imaging Market Revenue (Million) Forecast, by Application 2019 & 2032
- Table 30: Rest of South America Live Cell Imaging Market Revenue (Million) Forecast, by Application 2019 & 2032
- Table 31: Global Live Cell Imaging Market Revenue Million Forecast, by Product 2019 & 2032
- Table 32: Global Live Cell Imaging Market Revenue Million Forecast, by Application 2019 & 2032
- Table 33: Global Live Cell Imaging Market Revenue Million Forecast, by Country 2019 & 2032
- Table 34: United States Live Cell Imaging Market Revenue (Million) Forecast, by Application 2019 & 2032
- Table 35: Canada Live Cell Imaging Market Revenue (Million) Forecast, by Application 2019 & 2032
- Table 36: Mexico Live Cell Imaging Market Revenue (Million) Forecast, by Application 2019 & 2032
- Table 37: Global Live Cell Imaging Market Revenue Million Forecast, by Product 2019 & 2032
- Table 38: Global Live Cell Imaging Market Revenue Million Forecast, by Application 2019 & 2032
- Table 39: Global Live Cell Imaging Market Revenue Million Forecast, by Country 2019 & 2032
- Table 40: Germany Live Cell Imaging Market Revenue (Million) Forecast, by Application 2019 & 2032
- Table 41: United Kingdom Live Cell Imaging Market Revenue (Million) Forecast, by Application 2019 & 2032
- Table 42: France Live Cell Imaging Market Revenue (Million) Forecast, by Application 2019 & 2032
- Table 43: Italy Live Cell Imaging Market Revenue (Million) Forecast, by Application 2019 & 2032
- Table 44: Spain Live Cell Imaging Market Revenue (Million) Forecast, by Application 2019 & 2032
- Table 45: Rest of Europe Live Cell Imaging Market Revenue (Million) Forecast, by Application 2019 & 2032
- Table 46: Global Live Cell Imaging Market Revenue Million Forecast, by Product 2019 & 2032
- Table 47: Global Live Cell Imaging Market Revenue Million Forecast, by Application 2019 & 2032
- Table 48: Global Live Cell Imaging Market Revenue Million Forecast, by Country 2019 & 2032
- Table 49: China Live Cell Imaging Market Revenue (Million) Forecast, by Application 2019 & 2032
- Table 50: Japan Live Cell Imaging Market Revenue (Million) Forecast, by Application 2019 & 2032
- Table 51: India Live Cell Imaging Market Revenue (Million) Forecast, by Application 2019 & 2032
- Table 52: Australia Live Cell Imaging Market Revenue (Million) Forecast, by Application 2019 & 2032
- Table 53: South Korea Live Cell Imaging Market Revenue (Million) Forecast, by Application 2019 & 2032
- Table 54: Rest of Asia Pacific Live Cell Imaging Market Revenue (Million) Forecast, by Application 2019 & 2032
- Table 55: Global Live Cell Imaging Market Revenue Million Forecast, by Product 2019 & 2032
- Table 56: Global Live Cell Imaging Market Revenue Million Forecast, by Application 2019 & 2032
- Table 57: Global Live Cell Imaging Market Revenue Million Forecast, by Country 2019 & 2032
- Table 58: GCC Live Cell Imaging Market Revenue (Million) Forecast, by Application 2019 & 2032
- Table 59: South Africa Live Cell Imaging Market Revenue (Million) Forecast, by Application 2019 & 2032
- Table 60: Rest of Middle East and Africa Live Cell Imaging Market Revenue (Million) Forecast, by Application 2019 & 2032
- Table 61: Global Live Cell Imaging Market Revenue Million Forecast, by Product 2019 & 2032
- Table 62: Global Live Cell Imaging Market Revenue Million Forecast, by Application 2019 & 2032
- Table 63: Global Live Cell Imaging Market Revenue Million Forecast, by Country 2019 & 2032
- Table 64: Brazil Live Cell Imaging Market Revenue (Million) Forecast, by Application 2019 & 2032
- Table 65: Argentina Live Cell Imaging Market Revenue (Million) Forecast, by Application 2019 & 2032
- Table 66: Rest of South America Live Cell Imaging Market Revenue (Million) Forecast, by Application 2019 & 2032
Frequently Asked Questions
1. What is the projected Compound Annual Growth Rate (CAGR) of the Live Cell Imaging Market?
The projected CAGR is approximately 7.06%.
2. Which companies are prominent players in the Live Cell Imaging Market?
Key companies in the market include Becton Dickinson and Company, Zeiss Group, LCI (Live Cell Instrument), Axion BioSystems Inc, Thermo Fisher Scientific Inc, Danaher (Leica Microsystems), Agilent Technologies Inc, Sartorius AG*List Not Exhaustive, Nikon Corporation Inc, Olympus Corporation (EVIDENT), Merck KGaA (Sigma- Aldrich Corporation), PerkinElmer Inc.
3. What are the main segments of the Live Cell Imaging Market?
The market segments include Product, Application.
4. Can you provide details about the market size?
The market size is estimated to be USD 2.25 Million as of 2022.
5. What are some drivers contributing to market growth?
Adoption of High-content Screening Techniques in Drug Discovery; Rising Prevalence of Chronic Disease Demanding Higher and Quicker Diagnostic Facilities; Government Funding for Cell-based Research.
6. What are the notable trends driving market growth?
Standalone Systems Segment is Expected to Hold a Significant Market Share Over the Forecast Period.
7. Are there any restraints impacting market growth?
High Cost of High-content Screening Systems; Shortage of Skilled Professionals.
8. Can you provide examples of recent developments in the market?
June 2023: Nanolive launched the 3D Cell Explorer 96focus, an innovative platform that brings unlimited high content analysis to label-free live cell imaging without the need for labeling. With the aid of AI-powered digital assays and an automated workflow, the 3D Cell Explorer 96focus streamlines the imaging process, offering researchers a cost-effective and reliable means of conducting cell imaging experiments.
9. What pricing options are available for accessing the report?
Pricing options include single-user, multi-user, and enterprise licenses priced at USD 4750, USD 5250, and USD 8750 respectively.
10. Is the market size provided in terms of value or volume?
The market size is provided in terms of value, measured in Million.
11. Are there any specific market keywords associated with the report?
Yes, the market keyword associated with the report is "Live Cell Imaging Market," which aids in identifying and referencing the specific market segment covered.
12. How do I determine which pricing option suits my needs best?
The pricing options vary based on user requirements and access needs. Individual users may opt for single-user licenses, while businesses requiring broader access may choose multi-user or enterprise licenses for cost-effective access to the report.
13. Are there any additional resources or data provided in the Live Cell Imaging Market report?
While the report offers comprehensive insights, it's advisable to review the specific contents or supplementary materials provided to ascertain if additional resources or data are available.
14. How can I stay updated on further developments or reports in the Live Cell Imaging Market?
To stay informed about further developments, trends, and reports in the Live Cell Imaging Market, consider subscribing to industry newsletters, following relevant companies and organizations, or regularly checking reputable industry news sources and publications.
Methodology
Step 1 - Identification of Relevant Samples Size from Population Database


Step 2 - Approaches for Defining Global Market Size (Value, Volume* & Price*)

Note*: In applicable scenarios
Step 3 - Data Sources
Primary Research
- Web Analytics
- Survey Reports
- Research Institute
- Latest Research Reports
- Opinion Leaders
Secondary Research
- Annual Reports
- White Paper
- Latest Press Release
- Industry Association
- Paid Database
- Investor Presentations

Step 4 - Data Triangulation
Involves using different sources of information in order to increase the validity of a study
These sources are likely to be stakeholders in a program - participants, other researchers, program staff, other community members, and so on.
Then we put all data in single framework & apply various statistical tools to find out the dynamic on the market.
During the analysis stage, feedback from the stakeholder groups would be compared to determine areas of agreement as well as areas of divergence


