
Key Insights
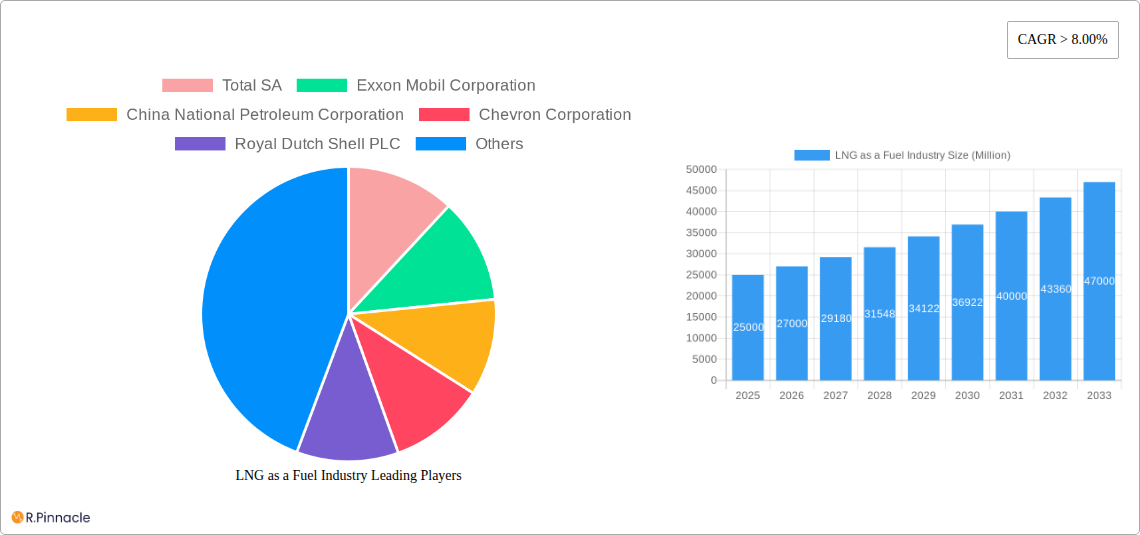
The LNG as a fuel market is experiencing robust growth, driven by increasing environmental concerns and the need for cleaner energy sources in transportation and power generation. The market's Compound Annual Growth Rate (CAGR) exceeding 8% signifies significant expansion potential through 2033. Key drivers include stringent emission regulations globally, particularly targeting maritime transport and power plants, coupled with growing investments in LNG infrastructure, such as bunkering facilities. The shift towards LNG is propelled by its lower greenhouse gas emissions compared to traditional fuels like heavy fuel oil, making it a viable alternative for environmentally conscious industries. While initial infrastructure costs and the price volatility of natural gas present some challenges, ongoing technological advancements in LNG handling and storage are mitigating these restraints. The market is segmented by application, with transportation (maritime, heavy-duty vehicles) and power generation being the major segments, with further regional variations reflecting different regulatory environments and energy mixes. Major players like TotalEnergies, ExxonMobil, and Shell are actively shaping the market landscape through strategic investments and technological innovations, focusing on expanding their LNG supply chains and developing efficient bunkering solutions.
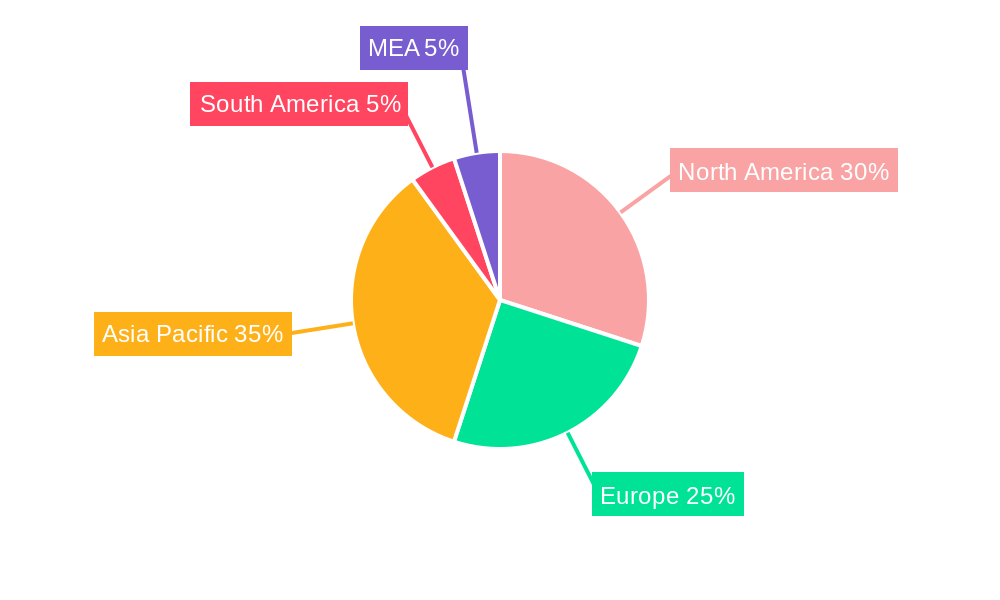
The geographical distribution of the LNG as a fuel market shows strong regional variations. North America, benefiting from established shale gas production, and Asia-Pacific, with its growing energy demands and expanding fleet of LNG-fueled vessels, are key regions. Europe, while facing challenges related to energy security and competing renewable energy sources, also exhibits significant growth potential driven by stringent environmental policies. The Middle East and Africa are expected to show moderate growth, primarily driven by industrial applications and power generation projects. Future market dynamics will be shaped by the interplay of factors such as governmental policies promoting clean energy, the continued development of LNG infrastructure, and the overall price competitiveness of LNG relative to alternative fuels. We anticipate that consistent growth will continue, reflecting a growing global commitment to cleaner energy sources and sustainable transportation.
LNG as a Fuel Industry: A Comprehensive Market Report (2019-2033)
This in-depth report provides a comprehensive analysis of the LNG as a fuel industry, offering invaluable insights for industry professionals, investors, and strategic decision-makers. Covering the period from 2019 to 2033, with a base year of 2025, this report forecasts robust market expansion driven by technological advancements and increasing environmental concerns. The report projects a market valued at xx Million by 2033, showcasing substantial growth opportunities.
LNG as a Fuel Industry Market Structure & Innovation Trends
This section analyzes the competitive landscape, examining market concentration, innovation drivers, regulatory frameworks, and the impact of mergers and acquisitions (M&A) on market dynamics. We delve into the strategies of key players such as Total SA, Exxon Mobil Corporation, China National Petroleum Corporation, Chevron Corporation, Royal Dutch Shell PLC, Eni SpA, BP PLC, and ConocoPhillips (List Not Exhaustive).
Market Concentration: The LNG as a fuel market exhibits a moderately concentrated structure, with a few major players holding significant market share. Total SA and Shell, for example, hold approximately xx% and xx% of the market share, respectively (2024 data). However, smaller players are also emerging, leading to increased competition.
Innovation Drivers: Key innovation drivers include advancements in liquefaction and regasification technologies, the development of more efficient LNG carriers, and the growing adoption of LNG as a fuel in various sectors.
Regulatory Frameworks: Government regulations and policies concerning greenhouse gas emissions and air quality are significantly influencing the adoption of LNG as a fuel, particularly in transportation. Incentive programs and carbon pricing mechanisms are playing a pivotal role.
M&A Activities: The industry has witnessed several significant M&A activities in the past five years, with total deal values exceeding xx Million. These transactions have reshaped the competitive landscape and driven further consolidation. Detailed analysis of these transactions, their impacts, and implications are provided within the report.
Product Substitutes: The primary substitutes for LNG as a fuel include traditional fossil fuels (diesel, gasoline) and alternative fuels (biofuels, hydrogen). The report analyzes the competitive threats posed by these substitutes.
End-User Demographics: The report profiles the end-users of LNG as fuel across different sectors, including transportation, power generation, and industrial applications, analyzing their consumption patterns and preferences.
LNG as a Fuel Industry Market Dynamics & Trends
This section explores the key market drivers, trends, and challenges shaping the future of the LNG as a fuel industry. We analyze market growth drivers, technological disruptions, consumer preferences, and competitive dynamics, providing a comprehensive overview of market evolution and future projections.
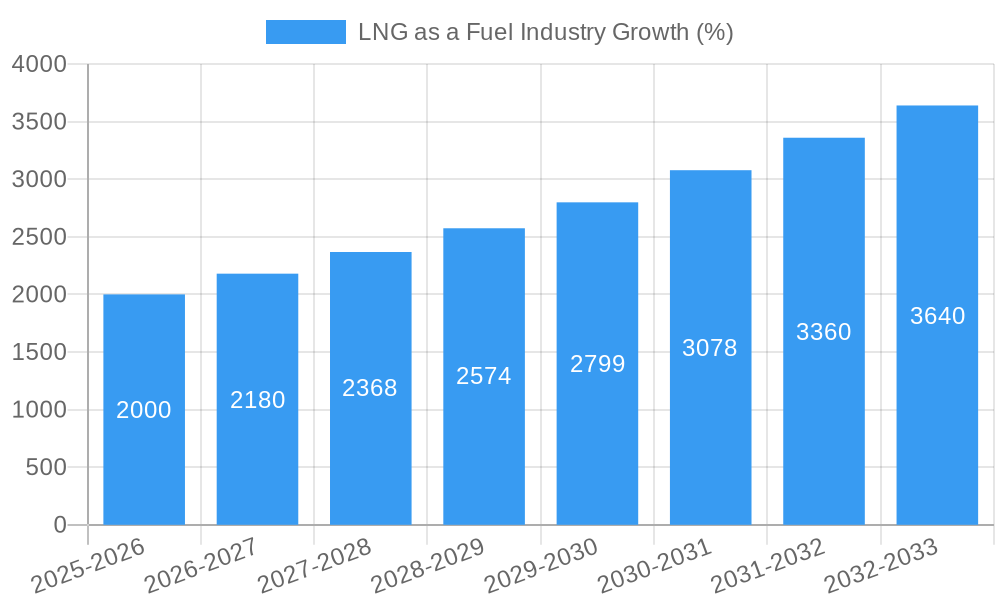
The global LNG as a fuel market is expected to exhibit a Compound Annual Growth Rate (CAGR) of xx% during the forecast period (2025-2033). Market penetration is expected to increase significantly, particularly in the transportation sector. Several factors contribute to this growth: the increasing demand for cleaner fuel alternatives, supportive government policies, advancements in LNG infrastructure, and the cost-competitiveness of LNG compared to traditional fuels in certain applications. This section details the specific contributions of each factor, analyzing market shifts and their influences on market dynamics and profitability. The report incorporates detailed analyses of factors affecting consumer preferences, technological disruptions, and their consequences for the industry, including both opportunities and threats.
Dominant Regions & Segments in LNG as a Fuel Industry
This section identifies the leading regions and segments within the LNG as a fuel market. Asia-Pacific is currently the dominant region, followed by Europe and North America. The transportation segment, particularly maritime shipping, is the fastest-growing application.
Key Drivers for Asia-Pacific Dominance:
- Rapid economic growth and industrialization.
- Growing demand for cleaner energy sources.
- Significant investments in LNG infrastructure.
- Supportive government policies.
Transportation Segment: The transportation sector’s growth is largely driven by the stringent emission regulations imposed by various countries and the increasing adoption of LNG as a marine fuel to comply with regulations like IMO 2020.
Power Generation Segment: The power generation sector's growth is fueled by the increasing demand for baseload power generation and the growing number of LNG-fueled power plants, especially in regions with limited access to natural gas pipelines.
Major LNG Bunkering Facilities around the World (as of 2019): The report provides a detailed geographical overview of the major bunkering facilities around the world.
The dominance analysis includes detailed discussions on market shares, revenue generation, and growth projections for each region and segment.
LNG as a Fuel Industry Product Innovations
Recent product innovations focus on improving the efficiency of LNG liquefaction and regasification processes, developing more advanced LNG carriers, and creating new applications for LNG as a fuel, including heavy-duty trucking and rail transportation. These innovations are enhancing the competitiveness of LNG as a fuel by improving its storage and transportation, and ultimately reducing costs and emissions.
Report Scope & Segmentation Analysis
The report segments the LNG as a fuel market by application (transportation, power generation, others), region (Asia-Pacific, North America, Europe, Middle East & Africa, South America), and key players. Each segment's growth projections, market size, and competitive dynamics are thoroughly analyzed. The transportation segment includes detailed breakdowns of maritime, road, and rail transportation. Similarly, the power generation segment is further segmented based on the size and type of power plants. The report provides a granular analysis of each segment's market potential and growth drivers, incorporating comprehensive competitive assessments for each segment.
Key Drivers of LNG as a Fuel Industry Growth
Several factors contribute to the growth of the LNG as a fuel industry. These include stringent environmental regulations aimed at reducing greenhouse gas emissions, the increasing cost-competitiveness of LNG compared to traditional fuels, advancements in LNG technology, and expanding global LNG infrastructure. Government incentives and supportive policies further accelerate market growth.
Challenges in the LNG as a Fuel Industry Sector
The LNG as a fuel industry faces challenges such as volatile LNG prices, the need for significant infrastructure investments, and safety concerns associated with LNG handling and transportation. Regulatory uncertainties and competition from alternative fuels also pose challenges. The report quantifies the impact of these challenges and provides insights into mitigation strategies.
Emerging Opportunities in LNG as a Fuel Industry
Emerging opportunities include the expansion of LNG bunkering infrastructure, the growth of the LNG-fueled heavy-duty vehicle market, and the potential for LNG to play a significant role in the decarbonization of the transportation sector. The growing demand for cleaner fuels in developing economies also presents significant opportunities for market expansion.
Leading Players in the LNG as a Fuel Industry Market
- TotalEnergies SE
- Exxon Mobil Corporation
- China National Petroleum Corporation
- Chevron Corporation
- Royal Dutch Shell PLC
- Eni SpA
- BP PLC
- ConocoPhillips
Key Developments in LNG as a Fuel Industry Industry
- 2022 Q4: Several major LNG projects commenced operations, expanding global LNG supply.
- 2023 Q1: A significant merger between two LNG shipping companies reshaped the competitive landscape.
- 2023 Q2: New environmental regulations came into effect, influencing the adoption of LNG as a fuel. (Further specific developments with dates and impacts are provided within the full report.)
Future Outlook for LNG as a Fuel Industry Market
The future outlook for the LNG as a fuel market is positive, driven by continued growth in demand for cleaner energy sources, advancements in LNG technology, and supportive government policies. The market is expected to witness significant expansion in various sectors, including transportation, power generation, and industrial applications. Strategic partnerships and investments in infrastructure will play a critical role in shaping the future of the industry.
LNG as a Fuel Industry Segmentation
-
1. Application
-
1.1. Transportation
- 1.1.1. Market Overview
- 1.1.2. LNG as a Bunkering Fuel Demand Forecast, till 2025
- 1.1.3. Number o
- 1.1.4. Major LN
-
1.2. Power Generation
- 1.2.1. Key LNG
-
1.1. Transportation
LNG as a Fuel Industry Segmentation By Geography
- 1. North America
- 2. Europe
- 3. Asia Pacific
- 4. South America
- 5. Middle East and Africa
LNG as a Fuel Industry REPORT HIGHLIGHTS
| Aspects | Details |
|---|---|
| Study Period | 2019-2033 |
| Base Year | 2024 |
| Estimated Year | 2025 |
| Forecast Period | 2025-2033 |
| Historical Period | 2019-2024 |
| Growth Rate | CAGR of > 8.00% from 2019-2033 |
| Segmentation |
|
Table of Contents
- 1. Introduction
- 1.1. Research Scope
- 1.2. Market Segmentation
- 1.3. Research Methodology
- 1.4. Definitions and Assumptions
- 2. Executive Summary
- 2.1. Introduction
- 3. Market Dynamics
- 3.1. Introduction
- 3.2. Market Drivers
- 3.2.1. 4.; Increasing Demand from Industrial Applications4.; Growing Infrastructure Across the World
- 3.3. Market Restrains
- 3.3.1. 4.; A Rise In Concerns Related To Carbon Emissions And A Shift Towards Electric Vehicles And Renewable Sources Of Energy
- 3.4. Market Trends
- 3.4.1. Transportation Application to Dominate the Market
- 4. Market Factor Analysis
- 4.1. Porters Five Forces
- 4.2. Supply/Value Chain
- 4.3. PESTEL analysis
- 4.4. Market Entropy
- 4.5. Patent/Trademark Analysis
- 5. Global LNG as a Fuel Industry Analysis, Insights and Forecast, 2019-2031
- 5.1. Market Analysis, Insights and Forecast - by Application
- 5.1.1. Transportation
- 5.1.1.1. Market Overview
- 5.1.1.2. LNG as a Bunkering Fuel Demand Forecast, till 2025
- 5.1.1.3. Number o
- 5.1.1.4. Major LN
- 5.1.2. Power Generation
- 5.1.2.1. Key LNG
- 5.1.1. Transportation
- 5.2. Market Analysis, Insights and Forecast - by Region
- 5.2.1. North America
- 5.2.2. Europe
- 5.2.3. Asia Pacific
- 5.2.4. South America
- 5.2.5. Middle East and Africa
- 5.1. Market Analysis, Insights and Forecast - by Application
- 6. North America LNG as a Fuel Industry Analysis, Insights and Forecast, 2019-2031
- 6.1. Market Analysis, Insights and Forecast - by Application
- 6.1.1. Transportation
- 6.1.1.1. Market Overview
- 6.1.1.2. LNG as a Bunkering Fuel Demand Forecast, till 2025
- 6.1.1.3. Number o
- 6.1.1.4. Major LN
- 6.1.2. Power Generation
- 6.1.2.1. Key LNG
- 6.1.1. Transportation
- 6.1. Market Analysis, Insights and Forecast - by Application
- 7. Europe LNG as a Fuel Industry Analysis, Insights and Forecast, 2019-2031
- 7.1. Market Analysis, Insights and Forecast - by Application
- 7.1.1. Transportation
- 7.1.1.1. Market Overview
- 7.1.1.2. LNG as a Bunkering Fuel Demand Forecast, till 2025
- 7.1.1.3. Number o
- 7.1.1.4. Major LN
- 7.1.2. Power Generation
- 7.1.2.1. Key LNG
- 7.1.1. Transportation
- 7.1. Market Analysis, Insights and Forecast - by Application
- 8. Asia Pacific LNG as a Fuel Industry Analysis, Insights and Forecast, 2019-2031
- 8.1. Market Analysis, Insights and Forecast - by Application
- 8.1.1. Transportation
- 8.1.1.1. Market Overview
- 8.1.1.2. LNG as a Bunkering Fuel Demand Forecast, till 2025
- 8.1.1.3. Number o
- 8.1.1.4. Major LN
- 8.1.2. Power Generation
- 8.1.2.1. Key LNG
- 8.1.1. Transportation
- 8.1. Market Analysis, Insights and Forecast - by Application
- 9. South America LNG as a Fuel Industry Analysis, Insights and Forecast, 2019-2031
- 9.1. Market Analysis, Insights and Forecast - by Application
- 9.1.1. Transportation
- 9.1.1.1. Market Overview
- 9.1.1.2. LNG as a Bunkering Fuel Demand Forecast, till 2025
- 9.1.1.3. Number o
- 9.1.1.4. Major LN
- 9.1.2. Power Generation
- 9.1.2.1. Key LNG
- 9.1.1. Transportation
- 9.1. Market Analysis, Insights and Forecast - by Application
- 10. Middle East and Africa LNG as a Fuel Industry Analysis, Insights and Forecast, 2019-2031
- 10.1. Market Analysis, Insights and Forecast - by Application
- 10.1.1. Transportation
- 10.1.1.1. Market Overview
- 10.1.1.2. LNG as a Bunkering Fuel Demand Forecast, till 2025
- 10.1.1.3. Number o
- 10.1.1.4. Major LN
- 10.1.2. Power Generation
- 10.1.2.1. Key LNG
- 10.1.1. Transportation
- 10.1. Market Analysis, Insights and Forecast - by Application
- 11. North America LNG as a Fuel Industry Analysis, Insights and Forecast, 2019-2031
- 11.1. Market Analysis, Insights and Forecast - By Country/Sub-region
- 11.1.1 United States
- 11.1.2 Canada
- 11.1.3 Mexico
- 12. Europe LNG as a Fuel Industry Analysis, Insights and Forecast, 2019-2031
- 12.1. Market Analysis, Insights and Forecast - By Country/Sub-region
- 12.1.1 Germany
- 12.1.2 United Kingdom
- 12.1.3 France
- 12.1.4 Spain
- 12.1.5 Italy
- 12.1.6 Spain
- 12.1.7 Belgium
- 12.1.8 Netherland
- 12.1.9 Nordics
- 12.1.10 Rest of Europe
- 13. Asia Pacific LNG as a Fuel Industry Analysis, Insights and Forecast, 2019-2031
- 13.1. Market Analysis, Insights and Forecast - By Country/Sub-region
- 13.1.1 China
- 13.1.2 Japan
- 13.1.3 India
- 13.1.4 South Korea
- 13.1.5 Southeast Asia
- 13.1.6 Australia
- 13.1.7 Indonesia
- 13.1.8 Phillipes
- 13.1.9 Singapore
- 13.1.10 Thailandc
- 13.1.11 Rest of Asia Pacific
- 14. South America LNG as a Fuel Industry Analysis, Insights and Forecast, 2019-2031
- 14.1. Market Analysis, Insights and Forecast - By Country/Sub-region
- 14.1.1 Brazil
- 14.1.2 Argentina
- 14.1.3 Peru
- 14.1.4 Chile
- 14.1.5 Colombia
- 14.1.6 Ecuador
- 14.1.7 Venezuela
- 14.1.8 Rest of South America
- 15. North America LNG as a Fuel Industry Analysis, Insights and Forecast, 2019-2031
- 15.1. Market Analysis, Insights and Forecast - By Country/Sub-region
- 15.1.1 United States
- 15.1.2 Canada
- 15.1.3 Mexico
- 16. MEA LNG as a Fuel Industry Analysis, Insights and Forecast, 2019-2031
- 16.1. Market Analysis, Insights and Forecast - By Country/Sub-region
- 16.1.1 United Arab Emirates
- 16.1.2 Saudi Arabia
- 16.1.3 South Africa
- 16.1.4 Rest of Middle East and Africa
- 17. Competitive Analysis
- 17.1. Global Market Share Analysis 2024
- 17.2. Company Profiles
- 17.2.1 Total SA
- 17.2.1.1. Overview
- 17.2.1.2. Products
- 17.2.1.3. SWOT Analysis
- 17.2.1.4. Recent Developments
- 17.2.1.5. Financials (Based on Availability)
- 17.2.2 Exxon Mobil Corporation
- 17.2.2.1. Overview
- 17.2.2.2. Products
- 17.2.2.3. SWOT Analysis
- 17.2.2.4. Recent Developments
- 17.2.2.5. Financials (Based on Availability)
- 17.2.3 China National Petroleum Corporation
- 17.2.3.1. Overview
- 17.2.3.2. Products
- 17.2.3.3. SWOT Analysis
- 17.2.3.4. Recent Developments
- 17.2.3.5. Financials (Based on Availability)
- 17.2.4 Chevron Corporation
- 17.2.4.1. Overview
- 17.2.4.2. Products
- 17.2.4.3. SWOT Analysis
- 17.2.4.4. Recent Developments
- 17.2.4.5. Financials (Based on Availability)
- 17.2.5 Royal Dutch Shell PLC
- 17.2.5.1. Overview
- 17.2.5.2. Products
- 17.2.5.3. SWOT Analysis
- 17.2.5.4. Recent Developments
- 17.2.5.5. Financials (Based on Availability)
- 17.2.6 Eni SpA*List Not Exhaustive
- 17.2.6.1. Overview
- 17.2.6.2. Products
- 17.2.6.3. SWOT Analysis
- 17.2.6.4. Recent Developments
- 17.2.6.5. Financials (Based on Availability)
- 17.2.7 BP PLC
- 17.2.7.1. Overview
- 17.2.7.2. Products
- 17.2.7.3. SWOT Analysis
- 17.2.7.4. Recent Developments
- 17.2.7.5. Financials (Based on Availability)
- 17.2.8 Conoco Philips
- 17.2.8.1. Overview
- 17.2.8.2. Products
- 17.2.8.3. SWOT Analysis
- 17.2.8.4. Recent Developments
- 17.2.8.5. Financials (Based on Availability)
- 17.2.1 Total SA
List of Figures
- Figure 1: Global LNG as a Fuel Industry Revenue Breakdown (Million, %) by Region 2024 & 2032
- Figure 2: Global LNG as a Fuel Industry Volume Breakdown (metric tonnes, %) by Region 2024 & 2032
- Figure 3: North America LNG as a Fuel Industry Revenue (Million), by Country 2024 & 2032
- Figure 4: North America LNG as a Fuel Industry Volume (metric tonnes), by Country 2024 & 2032
- Figure 5: North America LNG as a Fuel Industry Revenue Share (%), by Country 2024 & 2032
- Figure 6: North America LNG as a Fuel Industry Volume Share (%), by Country 2024 & 2032
- Figure 7: Europe LNG as a Fuel Industry Revenue (Million), by Country 2024 & 2032
- Figure 8: Europe LNG as a Fuel Industry Volume (metric tonnes), by Country 2024 & 2032
- Figure 9: Europe LNG as a Fuel Industry Revenue Share (%), by Country 2024 & 2032
- Figure 10: Europe LNG as a Fuel Industry Volume Share (%), by Country 2024 & 2032
- Figure 11: Asia Pacific LNG as a Fuel Industry Revenue (Million), by Country 2024 & 2032
- Figure 12: Asia Pacific LNG as a Fuel Industry Volume (metric tonnes), by Country 2024 & 2032
- Figure 13: Asia Pacific LNG as a Fuel Industry Revenue Share (%), by Country 2024 & 2032
- Figure 14: Asia Pacific LNG as a Fuel Industry Volume Share (%), by Country 2024 & 2032
- Figure 15: South America LNG as a Fuel Industry Revenue (Million), by Country 2024 & 2032
- Figure 16: South America LNG as a Fuel Industry Volume (metric tonnes), by Country 2024 & 2032
- Figure 17: South America LNG as a Fuel Industry Revenue Share (%), by Country 2024 & 2032
- Figure 18: South America LNG as a Fuel Industry Volume Share (%), by Country 2024 & 2032
- Figure 19: North America LNG as a Fuel Industry Revenue (Million), by Country 2024 & 2032
- Figure 20: North America LNG as a Fuel Industry Volume (metric tonnes), by Country 2024 & 2032
- Figure 21: North America LNG as a Fuel Industry Revenue Share (%), by Country 2024 & 2032
- Figure 22: North America LNG as a Fuel Industry Volume Share (%), by Country 2024 & 2032
- Figure 23: MEA LNG as a Fuel Industry Revenue (Million), by Country 2024 & 2032
- Figure 24: MEA LNG as a Fuel Industry Volume (metric tonnes), by Country 2024 & 2032
- Figure 25: MEA LNG as a Fuel Industry Revenue Share (%), by Country 2024 & 2032
- Figure 26: MEA LNG as a Fuel Industry Volume Share (%), by Country 2024 & 2032
- Figure 27: North America LNG as a Fuel Industry Revenue (Million), by Application 2024 & 2032
- Figure 28: North America LNG as a Fuel Industry Volume (metric tonnes), by Application 2024 & 2032
- Figure 29: North America LNG as a Fuel Industry Revenue Share (%), by Application 2024 & 2032
- Figure 30: North America LNG as a Fuel Industry Volume Share (%), by Application 2024 & 2032
- Figure 31: North America LNG as a Fuel Industry Revenue (Million), by Country 2024 & 2032
- Figure 32: North America LNG as a Fuel Industry Volume (metric tonnes), by Country 2024 & 2032
- Figure 33: North America LNG as a Fuel Industry Revenue Share (%), by Country 2024 & 2032
- Figure 34: North America LNG as a Fuel Industry Volume Share (%), by Country 2024 & 2032
- Figure 35: Europe LNG as a Fuel Industry Revenue (Million), by Application 2024 & 2032
- Figure 36: Europe LNG as a Fuel Industry Volume (metric tonnes), by Application 2024 & 2032
- Figure 37: Europe LNG as a Fuel Industry Revenue Share (%), by Application 2024 & 2032
- Figure 38: Europe LNG as a Fuel Industry Volume Share (%), by Application 2024 & 2032
- Figure 39: Europe LNG as a Fuel Industry Revenue (Million), by Country 2024 & 2032
- Figure 40: Europe LNG as a Fuel Industry Volume (metric tonnes), by Country 2024 & 2032
- Figure 41: Europe LNG as a Fuel Industry Revenue Share (%), by Country 2024 & 2032
- Figure 42: Europe LNG as a Fuel Industry Volume Share (%), by Country 2024 & 2032
- Figure 43: Asia Pacific LNG as a Fuel Industry Revenue (Million), by Application 2024 & 2032
- Figure 44: Asia Pacific LNG as a Fuel Industry Volume (metric tonnes), by Application 2024 & 2032
- Figure 45: Asia Pacific LNG as a Fuel Industry Revenue Share (%), by Application 2024 & 2032
- Figure 46: Asia Pacific LNG as a Fuel Industry Volume Share (%), by Application 2024 & 2032
- Figure 47: Asia Pacific LNG as a Fuel Industry Revenue (Million), by Country 2024 & 2032
- Figure 48: Asia Pacific LNG as a Fuel Industry Volume (metric tonnes), by Country 2024 & 2032
- Figure 49: Asia Pacific LNG as a Fuel Industry Revenue Share (%), by Country 2024 & 2032
- Figure 50: Asia Pacific LNG as a Fuel Industry Volume Share (%), by Country 2024 & 2032
- Figure 51: South America LNG as a Fuel Industry Revenue (Million), by Application 2024 & 2032
- Figure 52: South America LNG as a Fuel Industry Volume (metric tonnes), by Application 2024 & 2032
- Figure 53: South America LNG as a Fuel Industry Revenue Share (%), by Application 2024 & 2032
- Figure 54: South America LNG as a Fuel Industry Volume Share (%), by Application 2024 & 2032
- Figure 55: South America LNG as a Fuel Industry Revenue (Million), by Country 2024 & 2032
- Figure 56: South America LNG as a Fuel Industry Volume (metric tonnes), by Country 2024 & 2032
- Figure 57: South America LNG as a Fuel Industry Revenue Share (%), by Country 2024 & 2032
- Figure 58: South America LNG as a Fuel Industry Volume Share (%), by Country 2024 & 2032
- Figure 59: Middle East and Africa LNG as a Fuel Industry Revenue (Million), by Application 2024 & 2032
- Figure 60: Middle East and Africa LNG as a Fuel Industry Volume (metric tonnes), by Application 2024 & 2032
- Figure 61: Middle East and Africa LNG as a Fuel Industry Revenue Share (%), by Application 2024 & 2032
- Figure 62: Middle East and Africa LNG as a Fuel Industry Volume Share (%), by Application 2024 & 2032
- Figure 63: Middle East and Africa LNG as a Fuel Industry Revenue (Million), by Country 2024 & 2032
- Figure 64: Middle East and Africa LNG as a Fuel Industry Volume (metric tonnes), by Country 2024 & 2032
- Figure 65: Middle East and Africa LNG as a Fuel Industry Revenue Share (%), by Country 2024 & 2032
- Figure 66: Middle East and Africa LNG as a Fuel Industry Volume Share (%), by Country 2024 & 2032
List of Tables
- Table 1: Global LNG as a Fuel Industry Revenue Million Forecast, by Region 2019 & 2032
- Table 2: Global LNG as a Fuel Industry Volume metric tonnes Forecast, by Region 2019 & 2032
- Table 3: Global LNG as a Fuel Industry Revenue Million Forecast, by Application 2019 & 2032
- Table 4: Global LNG as a Fuel Industry Volume metric tonnes Forecast, by Application 2019 & 2032
- Table 5: Global LNG as a Fuel Industry Revenue Million Forecast, by Region 2019 & 2032
- Table 6: Global LNG as a Fuel Industry Volume metric tonnes Forecast, by Region 2019 & 2032
- Table 7: Global LNG as a Fuel Industry Revenue Million Forecast, by Country 2019 & 2032
- Table 8: Global LNG as a Fuel Industry Volume metric tonnes Forecast, by Country 2019 & 2032
- Table 9: United States LNG as a Fuel Industry Revenue (Million) Forecast, by Application 2019 & 2032
- Table 10: United States LNG as a Fuel Industry Volume (metric tonnes) Forecast, by Application 2019 & 2032
- Table 11: Canada LNG as a Fuel Industry Revenue (Million) Forecast, by Application 2019 & 2032
- Table 12: Canada LNG as a Fuel Industry Volume (metric tonnes) Forecast, by Application 2019 & 2032
- Table 13: Mexico LNG as a Fuel Industry Revenue (Million) Forecast, by Application 2019 & 2032
- Table 14: Mexico LNG as a Fuel Industry Volume (metric tonnes) Forecast, by Application 2019 & 2032
- Table 15: Global LNG as a Fuel Industry Revenue Million Forecast, by Country 2019 & 2032
- Table 16: Global LNG as a Fuel Industry Volume metric tonnes Forecast, by Country 2019 & 2032
- Table 17: Germany LNG as a Fuel Industry Revenue (Million) Forecast, by Application 2019 & 2032
- Table 18: Germany LNG as a Fuel Industry Volume (metric tonnes) Forecast, by Application 2019 & 2032
- Table 19: United Kingdom LNG as a Fuel Industry Revenue (Million) Forecast, by Application 2019 & 2032
- Table 20: United Kingdom LNG as a Fuel Industry Volume (metric tonnes) Forecast, by Application 2019 & 2032
- Table 21: France LNG as a Fuel Industry Revenue (Million) Forecast, by Application 2019 & 2032
- Table 22: France LNG as a Fuel Industry Volume (metric tonnes) Forecast, by Application 2019 & 2032
- Table 23: Spain LNG as a Fuel Industry Revenue (Million) Forecast, by Application 2019 & 2032
- Table 24: Spain LNG as a Fuel Industry Volume (metric tonnes) Forecast, by Application 2019 & 2032
- Table 25: Italy LNG as a Fuel Industry Revenue (Million) Forecast, by Application 2019 & 2032
- Table 26: Italy LNG as a Fuel Industry Volume (metric tonnes) Forecast, by Application 2019 & 2032
- Table 27: Spain LNG as a Fuel Industry Revenue (Million) Forecast, by Application 2019 & 2032
- Table 28: Spain LNG as a Fuel Industry Volume (metric tonnes) Forecast, by Application 2019 & 2032
- Table 29: Belgium LNG as a Fuel Industry Revenue (Million) Forecast, by Application 2019 & 2032
- Table 30: Belgium LNG as a Fuel Industry Volume (metric tonnes) Forecast, by Application 2019 & 2032
- Table 31: Netherland LNG as a Fuel Industry Revenue (Million) Forecast, by Application 2019 & 2032
- Table 32: Netherland LNG as a Fuel Industry Volume (metric tonnes) Forecast, by Application 2019 & 2032
- Table 33: Nordics LNG as a Fuel Industry Revenue (Million) Forecast, by Application 2019 & 2032
- Table 34: Nordics LNG as a Fuel Industry Volume (metric tonnes) Forecast, by Application 2019 & 2032
- Table 35: Rest of Europe LNG as a Fuel Industry Revenue (Million) Forecast, by Application 2019 & 2032
- Table 36: Rest of Europe LNG as a Fuel Industry Volume (metric tonnes) Forecast, by Application 2019 & 2032
- Table 37: Global LNG as a Fuel Industry Revenue Million Forecast, by Country 2019 & 2032
- Table 38: Global LNG as a Fuel Industry Volume metric tonnes Forecast, by Country 2019 & 2032
- Table 39: China LNG as a Fuel Industry Revenue (Million) Forecast, by Application 2019 & 2032
- Table 40: China LNG as a Fuel Industry Volume (metric tonnes) Forecast, by Application 2019 & 2032
- Table 41: Japan LNG as a Fuel Industry Revenue (Million) Forecast, by Application 2019 & 2032
- Table 42: Japan LNG as a Fuel Industry Volume (metric tonnes) Forecast, by Application 2019 & 2032
- Table 43: India LNG as a Fuel Industry Revenue (Million) Forecast, by Application 2019 & 2032
- Table 44: India LNG as a Fuel Industry Volume (metric tonnes) Forecast, by Application 2019 & 2032
- Table 45: South Korea LNG as a Fuel Industry Revenue (Million) Forecast, by Application 2019 & 2032
- Table 46: South Korea LNG as a Fuel Industry Volume (metric tonnes) Forecast, by Application 2019 & 2032
- Table 47: Southeast Asia LNG as a Fuel Industry Revenue (Million) Forecast, by Application 2019 & 2032
- Table 48: Southeast Asia LNG as a Fuel Industry Volume (metric tonnes) Forecast, by Application 2019 & 2032
- Table 49: Australia LNG as a Fuel Industry Revenue (Million) Forecast, by Application 2019 & 2032
- Table 50: Australia LNG as a Fuel Industry Volume (metric tonnes) Forecast, by Application 2019 & 2032
- Table 51: Indonesia LNG as a Fuel Industry Revenue (Million) Forecast, by Application 2019 & 2032
- Table 52: Indonesia LNG as a Fuel Industry Volume (metric tonnes) Forecast, by Application 2019 & 2032
- Table 53: Phillipes LNG as a Fuel Industry Revenue (Million) Forecast, by Application 2019 & 2032
- Table 54: Phillipes LNG as a Fuel Industry Volume (metric tonnes) Forecast, by Application 2019 & 2032
- Table 55: Singapore LNG as a Fuel Industry Revenue (Million) Forecast, by Application 2019 & 2032
- Table 56: Singapore LNG as a Fuel Industry Volume (metric tonnes) Forecast, by Application 2019 & 2032
- Table 57: Thailandc LNG as a Fuel Industry Revenue (Million) Forecast, by Application 2019 & 2032
- Table 58: Thailandc LNG as a Fuel Industry Volume (metric tonnes) Forecast, by Application 2019 & 2032
- Table 59: Rest of Asia Pacific LNG as a Fuel Industry Revenue (Million) Forecast, by Application 2019 & 2032
- Table 60: Rest of Asia Pacific LNG as a Fuel Industry Volume (metric tonnes) Forecast, by Application 2019 & 2032
- Table 61: Global LNG as a Fuel Industry Revenue Million Forecast, by Country 2019 & 2032
- Table 62: Global LNG as a Fuel Industry Volume metric tonnes Forecast, by Country 2019 & 2032
- Table 63: Brazil LNG as a Fuel Industry Revenue (Million) Forecast, by Application 2019 & 2032
- Table 64: Brazil LNG as a Fuel Industry Volume (metric tonnes) Forecast, by Application 2019 & 2032
- Table 65: Argentina LNG as a Fuel Industry Revenue (Million) Forecast, by Application 2019 & 2032
- Table 66: Argentina LNG as a Fuel Industry Volume (metric tonnes) Forecast, by Application 2019 & 2032
- Table 67: Peru LNG as a Fuel Industry Revenue (Million) Forecast, by Application 2019 & 2032
- Table 68: Peru LNG as a Fuel Industry Volume (metric tonnes) Forecast, by Application 2019 & 2032
- Table 69: Chile LNG as a Fuel Industry Revenue (Million) Forecast, by Application 2019 & 2032
- Table 70: Chile LNG as a Fuel Industry Volume (metric tonnes) Forecast, by Application 2019 & 2032
- Table 71: Colombia LNG as a Fuel Industry Revenue (Million) Forecast, by Application 2019 & 2032
- Table 72: Colombia LNG as a Fuel Industry Volume (metric tonnes) Forecast, by Application 2019 & 2032
- Table 73: Ecuador LNG as a Fuel Industry Revenue (Million) Forecast, by Application 2019 & 2032
- Table 74: Ecuador LNG as a Fuel Industry Volume (metric tonnes) Forecast, by Application 2019 & 2032
- Table 75: Venezuela LNG as a Fuel Industry Revenue (Million) Forecast, by Application 2019 & 2032
- Table 76: Venezuela LNG as a Fuel Industry Volume (metric tonnes) Forecast, by Application 2019 & 2032
- Table 77: Rest of South America LNG as a Fuel Industry Revenue (Million) Forecast, by Application 2019 & 2032
- Table 78: Rest of South America LNG as a Fuel Industry Volume (metric tonnes) Forecast, by Application 2019 & 2032
- Table 79: Global LNG as a Fuel Industry Revenue Million Forecast, by Country 2019 & 2032
- Table 80: Global LNG as a Fuel Industry Volume metric tonnes Forecast, by Country 2019 & 2032
- Table 81: United States LNG as a Fuel Industry Revenue (Million) Forecast, by Application 2019 & 2032
- Table 82: United States LNG as a Fuel Industry Volume (metric tonnes) Forecast, by Application 2019 & 2032
- Table 83: Canada LNG as a Fuel Industry Revenue (Million) Forecast, by Application 2019 & 2032
- Table 84: Canada LNG as a Fuel Industry Volume (metric tonnes) Forecast, by Application 2019 & 2032
- Table 85: Mexico LNG as a Fuel Industry Revenue (Million) Forecast, by Application 2019 & 2032
- Table 86: Mexico LNG as a Fuel Industry Volume (metric tonnes) Forecast, by Application 2019 & 2032
- Table 87: Global LNG as a Fuel Industry Revenue Million Forecast, by Country 2019 & 2032
- Table 88: Global LNG as a Fuel Industry Volume metric tonnes Forecast, by Country 2019 & 2032
- Table 89: United Arab Emirates LNG as a Fuel Industry Revenue (Million) Forecast, by Application 2019 & 2032
- Table 90: United Arab Emirates LNG as a Fuel Industry Volume (metric tonnes) Forecast, by Application 2019 & 2032
- Table 91: Saudi Arabia LNG as a Fuel Industry Revenue (Million) Forecast, by Application 2019 & 2032
- Table 92: Saudi Arabia LNG as a Fuel Industry Volume (metric tonnes) Forecast, by Application 2019 & 2032
- Table 93: South Africa LNG as a Fuel Industry Revenue (Million) Forecast, by Application 2019 & 2032
- Table 94: South Africa LNG as a Fuel Industry Volume (metric tonnes) Forecast, by Application 2019 & 2032
- Table 95: Rest of Middle East and Africa LNG as a Fuel Industry Revenue (Million) Forecast, by Application 2019 & 2032
- Table 96: Rest of Middle East and Africa LNG as a Fuel Industry Volume (metric tonnes) Forecast, by Application 2019 & 2032
- Table 97: Global LNG as a Fuel Industry Revenue Million Forecast, by Application 2019 & 2032
- Table 98: Global LNG as a Fuel Industry Volume metric tonnes Forecast, by Application 2019 & 2032
- Table 99: Global LNG as a Fuel Industry Revenue Million Forecast, by Country 2019 & 2032
- Table 100: Global LNG as a Fuel Industry Volume metric tonnes Forecast, by Country 2019 & 2032
- Table 101: Global LNG as a Fuel Industry Revenue Million Forecast, by Application 2019 & 2032
- Table 102: Global LNG as a Fuel Industry Volume metric tonnes Forecast, by Application 2019 & 2032
- Table 103: Global LNG as a Fuel Industry Revenue Million Forecast, by Country 2019 & 2032
- Table 104: Global LNG as a Fuel Industry Volume metric tonnes Forecast, by Country 2019 & 2032
- Table 105: Global LNG as a Fuel Industry Revenue Million Forecast, by Application 2019 & 2032
- Table 106: Global LNG as a Fuel Industry Volume metric tonnes Forecast, by Application 2019 & 2032
- Table 107: Global LNG as a Fuel Industry Revenue Million Forecast, by Country 2019 & 2032
- Table 108: Global LNG as a Fuel Industry Volume metric tonnes Forecast, by Country 2019 & 2032
- Table 109: Global LNG as a Fuel Industry Revenue Million Forecast, by Application 2019 & 2032
- Table 110: Global LNG as a Fuel Industry Volume metric tonnes Forecast, by Application 2019 & 2032
- Table 111: Global LNG as a Fuel Industry Revenue Million Forecast, by Country 2019 & 2032
- Table 112: Global LNG as a Fuel Industry Volume metric tonnes Forecast, by Country 2019 & 2032
- Table 113: Global LNG as a Fuel Industry Revenue Million Forecast, by Application 2019 & 2032
- Table 114: Global LNG as a Fuel Industry Volume metric tonnes Forecast, by Application 2019 & 2032
- Table 115: Global LNG as a Fuel Industry Revenue Million Forecast, by Country 2019 & 2032
- Table 116: Global LNG as a Fuel Industry Volume metric tonnes Forecast, by Country 2019 & 2032
Frequently Asked Questions
1. What is the projected Compound Annual Growth Rate (CAGR) of the LNG as a Fuel Industry?
The projected CAGR is approximately > 8.00%.
2. Which companies are prominent players in the LNG as a Fuel Industry?
Key companies in the market include Total SA, Exxon Mobil Corporation, China National Petroleum Corporation, Chevron Corporation, Royal Dutch Shell PLC, Eni SpA*List Not Exhaustive, BP PLC, Conoco Philips.
3. What are the main segments of the LNG as a Fuel Industry?
The market segments include Application.
4. Can you provide details about the market size?
The market size is estimated to be USD XX Million as of 2022.
5. What are some drivers contributing to market growth?
4.; Increasing Demand from Industrial Applications4.; Growing Infrastructure Across the World.
6. What are the notable trends driving market growth?
Transportation Application to Dominate the Market.
7. Are there any restraints impacting market growth?
4.; A Rise In Concerns Related To Carbon Emissions And A Shift Towards Electric Vehicles And Renewable Sources Of Energy.
8. Can you provide examples of recent developments in the market?
N/A
9. What pricing options are available for accessing the report?
Pricing options include single-user, multi-user, and enterprise licenses priced at USD 4750, USD 5250, and USD 8750 respectively.
10. Is the market size provided in terms of value or volume?
The market size is provided in terms of value, measured in Million and volume, measured in metric tonnes.
11. Are there any specific market keywords associated with the report?
Yes, the market keyword associated with the report is "LNG as a Fuel Industry," which aids in identifying and referencing the specific market segment covered.
12. How do I determine which pricing option suits my needs best?
The pricing options vary based on user requirements and access needs. Individual users may opt for single-user licenses, while businesses requiring broader access may choose multi-user or enterprise licenses for cost-effective access to the report.
13. Are there any additional resources or data provided in the LNG as a Fuel Industry report?
While the report offers comprehensive insights, it's advisable to review the specific contents or supplementary materials provided to ascertain if additional resources or data are available.
14. How can I stay updated on further developments or reports in the LNG as a Fuel Industry?
To stay informed about further developments, trends, and reports in the LNG as a Fuel Industry, consider subscribing to industry newsletters, following relevant companies and organizations, or regularly checking reputable industry news sources and publications.
Methodology
Step 1 - Identification of Relevant Samples Size from Population Database


Step 2 - Approaches for Defining Global Market Size (Value, Volume* & Price*)

Note*: In applicable scenarios
Step 3 - Data Sources
Primary Research
- Web Analytics
- Survey Reports
- Research Institute
- Latest Research Reports
- Opinion Leaders
Secondary Research
- Annual Reports
- White Paper
- Latest Press Release
- Industry Association
- Paid Database
- Investor Presentations

Step 4 - Data Triangulation
Involves using different sources of information in order to increase the validity of a study
These sources are likely to be stakeholders in a program - participants, other researchers, program staff, other community members, and so on.
Then we put all data in single framework & apply various statistical tools to find out the dynamic on the market.
During the analysis stage, feedback from the stakeholder groups would be compared to determine areas of agreement as well as areas of divergence


