
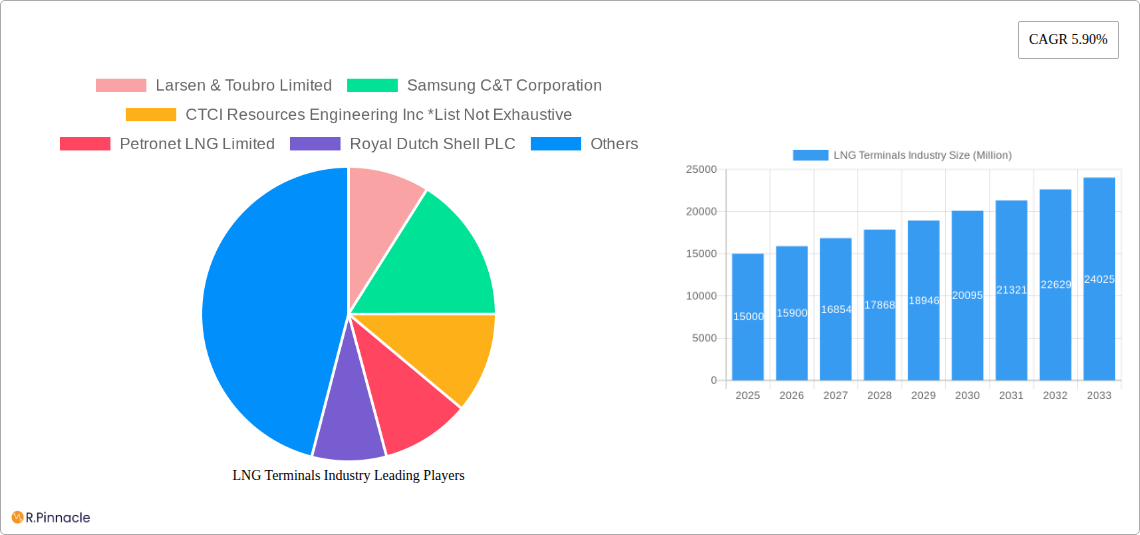
Key Insights
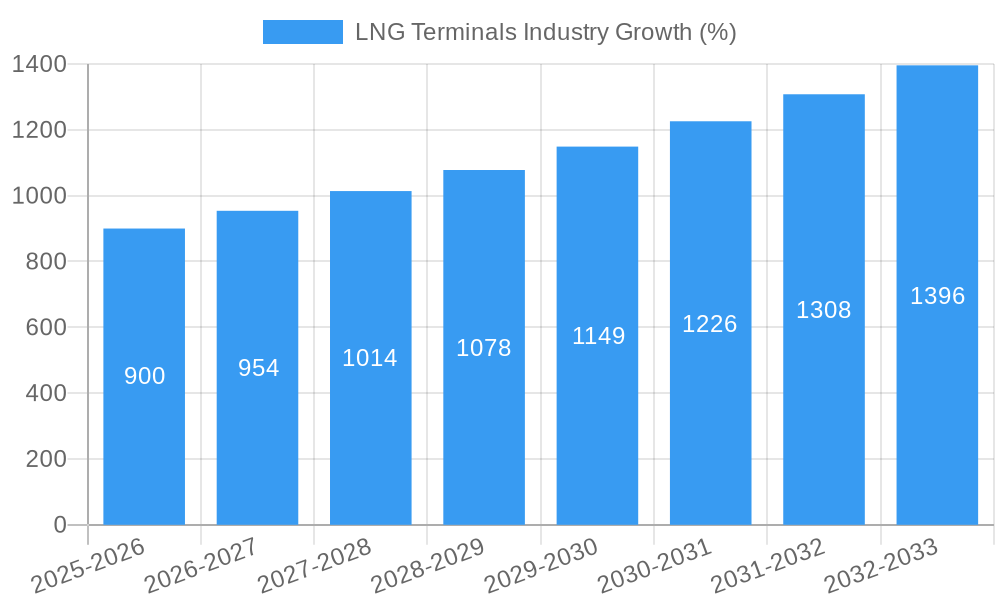
The LNG Terminals market is experiencing robust growth, projected to reach a substantial size by 2033, driven by a CAGR of 5.90%. This expansion is fueled by several key factors. Firstly, the increasing global demand for cleaner energy sources is driving a shift towards natural gas, with LNG playing a crucial role in its transportation and distribution. The rising adoption of LNG as a fuel for power generation and industrial processes, particularly in rapidly developing economies in Asia-Pacific, is significantly boosting market demand. Moreover, advancements in terminal technologies, such as the development of floating LNG (FLNG) terminals, are enhancing operational efficiency and enabling access to remote locations, further propelling market growth. The segmentations reveal strong demand for onshore terminals, but the floating terminal segment is poised for significant growth due to its flexibility and lower capital expenditure. LNG is the dominant product type, followed by other liquefied gases. Power generation and industrial sectors are the primary applications, reflecting the energy transition trend. Key players such as Larsen & Toubro, Samsung C&T, and others are strategically investing in new terminal projects and infrastructure upgrades to capitalize on this growth.
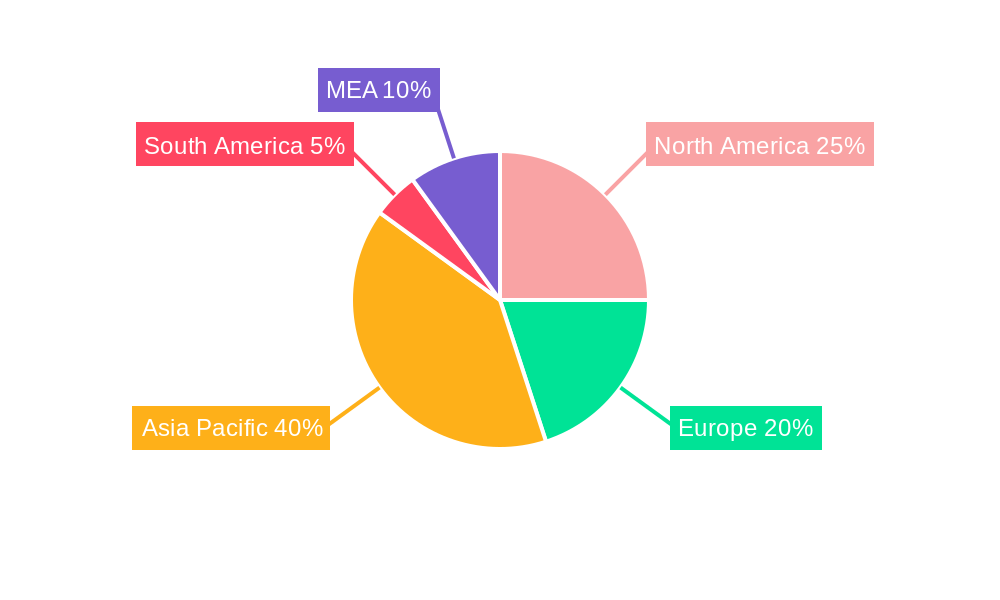
Geographic expansion is another significant driver. While North America and Europe maintain established markets, the Asia-Pacific region is exhibiting exceptionally high growth, driven by strong demand from China, Japan, India, and Southeast Asia. This regional disparity presents significant opportunities for market participants, particularly those focusing on emerging economies. However, regulatory hurdles, stringent environmental regulations, and volatile LNG prices pose challenges to the market's sustained growth. Furthermore, potential geopolitical instability in key gas-producing regions may influence supply chains and lead to price fluctuations, impacting market stability. Despite these constraints, the long-term outlook for the LNG Terminals market remains positive, driven by the enduring global need for reliable and clean energy solutions. The market will continue to witness innovation and expansion, ultimately shaping a more efficient and sustainable energy landscape.
LNG Terminals Industry Report: A Comprehensive Market Analysis (2019-2033)
This comprehensive report provides an in-depth analysis of the global LNG Terminals industry, offering invaluable insights for industry professionals, investors, and strategic decision-makers. Covering the period from 2019 to 2033, with a base year of 2025 and a forecast period from 2025 to 2033, this report meticulously examines market dynamics, technological advancements, and competitive landscapes to illuminate future opportunities and challenges. The global market size is projected to reach xx Million by 2033, exhibiting a CAGR of xx% during the forecast period.
LNG Terminals Industry Market Structure & Innovation Trends
This section analyzes the market concentration, innovation drivers, regulatory frameworks, and competitive landscape within the LNG Terminals industry. We delve into mergers and acquisitions (M&A) activities, examining deal values and their impact on market share. Key players such as Larsen & Toubro Limited, Samsung C&T Corporation, and CTCI Resources Engineering Inc., among others, are assessed for their strategic positioning and market influence. The report quantifies market share distribution among leading players and investigates the influence of regulatory changes and technological innovations on market dynamics. The analysis includes:
- Market Concentration: A detailed breakdown of market share held by major players, illustrating the level of competition and potential for consolidation. For example, the top 5 players may hold xx% of the market in 2025.
- Innovation Drivers: Examination of technological advancements driving industry growth, such as advancements in floating LNG terminal technology and improved efficiency in onshore facilities.
- Regulatory Landscape: Analysis of global and regional regulations influencing the construction, operation, and expansion of LNG terminals.
- M&A Activity: Overview of significant M&A deals in the industry during the historical period (2019-2024) and projection of future activity based on market trends. For example, an estimated xx Million in M&A deals occurred between 2019 and 2024.
- Product Substitutes: Discussion of alternative solutions to LNG transportation and storage and their potential impact on market growth.
- End-User Demographics: Analysis of the distribution of demand across various end-use sectors, including power generation, industrial, and transportation.
LNG Terminals Industry Market Dynamics & Trends
This section explores the key drivers and trends shaping the LNG Terminals market, including growth rate, market penetration, technological disruption, and consumer preferences. We analyze the factors contributing to market expansion and the competitive dynamics influencing the industry's trajectory. A comprehensive evaluation of the CAGR and market penetration rate across various segments is included.
The analysis considers:
- Market Growth Drivers: Rising global demand for natural gas, increasing investments in LNG infrastructure, and government support for cleaner energy sources.
- Technological Disruptions: The impact of innovative technologies, including automation, data analytics, and improved terminal design, on operational efficiency and cost reduction.
- Consumer Preferences: Analysis of shifting preferences towards cleaner energy sources and the influence on LNG demand.
- Competitive Dynamics: Assessment of the competitive landscape, including market share, pricing strategies, and strategic alliances.
Dominant Regions & Segments in LNG Terminals Industry
This section identifies the leading regions and segments within the LNG Terminals market. A detailed analysis is provided on the dominance of specific regions and segments, considering factors like economic policies, infrastructure development, and regulatory frameworks. Key drivers are highlighted using bullet points, followed by paragraphs providing detailed dominance analysis for each segment (Onshore, Floating Terminals; LNG Product Type; Power Generation, Industrial, Transportation Applications).
- Terminal Type: Dominance analysis for Onshore vs. Floating LNG terminals, considering factors such as cost-effectiveness, geographical limitations, and environmental impact.
- Product Type: Analysis focusing on the dominant product type (LNG) and potential for diversification.
- Application: Detailed examination of the leading application segments (Power Generation, Industrial, Transportation), focusing on their growth potential and market share.
LNG Terminals Industry Product Innovations
This section summarizes recent product developments, focusing on technological advancements, improved efficiency, and enhanced competitive advantages in the LNG Terminals industry. Emphasis is placed on how these innovations improve market fit and overall market competitiveness. The analysis includes:
[Paragraph detailing technological trends such as improved safety features, automation, and optimized designs leading to cost-efficient and environmentally friendly terminals].
Report Scope & Segmentation Analysis
This section details the market segmentation by Terminal Type (Onshore, Floating), Product Type (LNG), and Application (Power Generation, Industrial, Transportation). Each segment's growth projections, market size, and competitive dynamics are discussed individually.
- Terminal Type: Analysis of the market size and growth projections for both onshore and floating LNG terminals.
- Product Type: Focus on the LNG product type and its projected growth within the market.
- Application: Market size and growth projections for the power generation, industrial, and transportation application segments.
Key Drivers of LNG Terminals Industry Growth
This section outlines the key factors driving growth in the LNG Terminals industry. Technological advancements, economic factors, and supportive regulatory frameworks are discussed, with specific examples provided.
[Paragraph detailing growth drivers such as increasing demand for natural gas, government incentives for clean energy, and technological advancements improving terminal efficiency].
Challenges in the LNG Terminals Industry Sector
This section discusses the challenges and restraints impacting the LNG Terminals industry. Regulatory hurdles, supply chain disruptions, and competitive pressures, along with their quantifiable impacts on market growth, are analyzed.
[Paragraph detailing challenges such as high capital investment costs, environmental regulations, geopolitical risks, and competition from other energy sources].
Emerging Opportunities in LNG Terminals Industry
This section highlights emerging opportunities for growth in the LNG Terminals market. New markets, technological innovations, and evolving consumer preferences are examined.
[Paragraph outlining opportunities such as expanding into new geographical markets, developing innovative technologies for efficiency gains, and capitalizing on the increasing demand for cleaner energy sources].
Leading Players in the LNG Terminals Industry Market
- Larsen & Toubro Limited
- Samsung C&T Corporation
- CTCI Resources Engineering Inc
- Petronet LNG Limited
- Royal Dutch Shell PLC
- Tokyo Gas Co Ltd
- McDermott International Inc
- Egyptian Natural Gas Holding Company
- Toho Gas Co Ltd
Key Developments in LNG Terminals Industry
- [Bullet points listing key developments with year/month, such as new terminal construction announcements, expansion projects, technological advancements, and M&A activity].
Future Outlook for LNG Terminals Industry Market
This section summarizes the growth accelerators and future market potential for the LNG Terminals industry. Strategic opportunities are highlighted, focusing on long-term growth and industry trends.
[Paragraph discussing future growth prospects, potential market expansion, technological advancements that will shape the industry, and strategic opportunities for investors and industry players].
LNG Terminals Industry Segmentation
-
1. Terminal Type
- 1.1. Onshore
- 1.2. Floating
LNG Terminals Industry Segmentation By Geography
- 1. North America
- 2. Asia Pacific
- 3. Europe
- 4. South America
- 5. Middle East and Africa
LNG Terminals Industry REPORT HIGHLIGHTS
| Aspects | Details |
|---|---|
| Study Period | 2019-2033 |
| Base Year | 2024 |
| Estimated Year | 2025 |
| Forecast Period | 2025-2033 |
| Historical Period | 2019-2024 |
| Growth Rate | CAGR of 5.90% from 2019-2033 |
| Segmentation |
|
Table of Contents
- 1. Introduction
- 1.1. Research Scope
- 1.2. Market Segmentation
- 1.3. Research Methodology
- 1.4. Definitions and Assumptions
- 2. Executive Summary
- 2.1. Introduction
- 3. Market Dynamics
- 3.1. Introduction
- 3.2. Market Drivers
- 3.2.1. 4.; Declining Solar Panel Costs4.; Supportive Government Policies
- 3.3. Market Restrains
- 3.3.1. 4.; High Upfront Cost
- 3.4. Market Trends
- 3.4.1. Floating Storage Regasification Unit to Witness Huge Growth
- 4. Market Factor Analysis
- 4.1. Porters Five Forces
- 4.2. Supply/Value Chain
- 4.3. PESTEL analysis
- 4.4. Market Entropy
- 4.5. Patent/Trademark Analysis
- 5. Global LNG Terminals Industry Analysis, Insights and Forecast, 2019-2031
- 5.1. Market Analysis, Insights and Forecast - by Terminal Type
- 5.1.1. Onshore
- 5.1.2. Floating
- 5.2. Market Analysis, Insights and Forecast - by Region
- 5.2.1. North America
- 5.2.2. Asia Pacific
- 5.2.3. Europe
- 5.2.4. South America
- 5.2.5. Middle East and Africa
- 5.1. Market Analysis, Insights and Forecast - by Terminal Type
- 6. North America LNG Terminals Industry Analysis, Insights and Forecast, 2019-2031
- 6.1. Market Analysis, Insights and Forecast - by Terminal Type
- 6.1.1. Onshore
- 6.1.2. Floating
- 6.1. Market Analysis, Insights and Forecast - by Terminal Type
- 7. Asia Pacific LNG Terminals Industry Analysis, Insights and Forecast, 2019-2031
- 7.1. Market Analysis, Insights and Forecast - by Terminal Type
- 7.1.1. Onshore
- 7.1.2. Floating
- 7.1. Market Analysis, Insights and Forecast - by Terminal Type
- 8. Europe LNG Terminals Industry Analysis, Insights and Forecast, 2019-2031
- 8.1. Market Analysis, Insights and Forecast - by Terminal Type
- 8.1.1. Onshore
- 8.1.2. Floating
- 8.1. Market Analysis, Insights and Forecast - by Terminal Type
- 9. South America LNG Terminals Industry Analysis, Insights and Forecast, 2019-2031
- 9.1. Market Analysis, Insights and Forecast - by Terminal Type
- 9.1.1. Onshore
- 9.1.2. Floating
- 9.1. Market Analysis, Insights and Forecast - by Terminal Type
- 10. Middle East and Africa LNG Terminals Industry Analysis, Insights and Forecast, 2019-2031
- 10.1. Market Analysis, Insights and Forecast - by Terminal Type
- 10.1.1. Onshore
- 10.1.2. Floating
- 10.1. Market Analysis, Insights and Forecast - by Terminal Type
- 11. North America LNG Terminals Industry Analysis, Insights and Forecast, 2019-2031
- 11.1. Market Analysis, Insights and Forecast - By Country/Sub-region
- 11.1.1 United States
- 11.1.2 Canada
- 11.1.3 Mexico
- 12. Europe LNG Terminals Industry Analysis, Insights and Forecast, 2019-2031
- 12.1. Market Analysis, Insights and Forecast - By Country/Sub-region
- 12.1.1 Germany
- 12.1.2 United Kingdom
- 12.1.3 France
- 12.1.4 Spain
- 12.1.5 Italy
- 12.1.6 Spain
- 12.1.7 Belgium
- 12.1.8 Netherland
- 12.1.9 Nordics
- 12.1.10 Rest of Europe
- 13. Asia Pacific LNG Terminals Industry Analysis, Insights and Forecast, 2019-2031
- 13.1. Market Analysis, Insights and Forecast - By Country/Sub-region
- 13.1.1 China
- 13.1.2 Japan
- 13.1.3 India
- 13.1.4 South Korea
- 13.1.5 Southeast Asia
- 13.1.6 Australia
- 13.1.7 Indonesia
- 13.1.8 Phillipes
- 13.1.9 Singapore
- 13.1.10 Thailandc
- 13.1.11 Rest of Asia Pacific
- 14. South America LNG Terminals Industry Analysis, Insights and Forecast, 2019-2031
- 14.1. Market Analysis, Insights and Forecast - By Country/Sub-region
- 14.1.1 Brazil
- 14.1.2 Argentina
- 14.1.3 Peru
- 14.1.4 Chile
- 14.1.5 Colombia
- 14.1.6 Ecuador
- 14.1.7 Venezuela
- 14.1.8 Rest of South America
- 15. North America LNG Terminals Industry Analysis, Insights and Forecast, 2019-2031
- 15.1. Market Analysis, Insights and Forecast - By Country/Sub-region
- 15.1.1 United States
- 15.1.2 Canada
- 15.1.3 Mexico
- 16. MEA LNG Terminals Industry Analysis, Insights and Forecast, 2019-2031
- 16.1. Market Analysis, Insights and Forecast - By Country/Sub-region
- 16.1.1 United Arab Emirates
- 16.1.2 Saudi Arabia
- 16.1.3 South Africa
- 16.1.4 Rest of Middle East and Africa
- 17. Competitive Analysis
- 17.1. Global Market Share Analysis 2024
- 17.2. Company Profiles
- 17.2.1 Larsen & Toubro Limited
- 17.2.1.1. Overview
- 17.2.1.2. Products
- 17.2.1.3. SWOT Analysis
- 17.2.1.4. Recent Developments
- 17.2.1.5. Financials (Based on Availability)
- 17.2.2 Samsung C&T Corporation
- 17.2.2.1. Overview
- 17.2.2.2. Products
- 17.2.2.3. SWOT Analysis
- 17.2.2.4. Recent Developments
- 17.2.2.5. Financials (Based on Availability)
- 17.2.3 CTCI Resources Engineering Inc *List Not Exhaustive
- 17.2.3.1. Overview
- 17.2.3.2. Products
- 17.2.3.3. SWOT Analysis
- 17.2.3.4. Recent Developments
- 17.2.3.5. Financials (Based on Availability)
- 17.2.4 Petronet LNG Limited
- 17.2.4.1. Overview
- 17.2.4.2. Products
- 17.2.4.3. SWOT Analysis
- 17.2.4.4. Recent Developments
- 17.2.4.5. Financials (Based on Availability)
- 17.2.5 Royal Dutch Shell PLC
- 17.2.5.1. Overview
- 17.2.5.2. Products
- 17.2.5.3. SWOT Analysis
- 17.2.5.4. Recent Developments
- 17.2.5.5. Financials (Based on Availability)
- 17.2.6 Tokyo Gas Co Ltd
- 17.2.6.1. Overview
- 17.2.6.2. Products
- 17.2.6.3. SWOT Analysis
- 17.2.6.4. Recent Developments
- 17.2.6.5. Financials (Based on Availability)
- 17.2.7 McDermott International Inc
- 17.2.7.1. Overview
- 17.2.7.2. Products
- 17.2.7.3. SWOT Analysis
- 17.2.7.4. Recent Developments
- 17.2.7.5. Financials (Based on Availability)
- 17.2.8 Egyptian Natural Gas Holding Company
- 17.2.8.1. Overview
- 17.2.8.2. Products
- 17.2.8.3. SWOT Analysis
- 17.2.8.4. Recent Developments
- 17.2.8.5. Financials (Based on Availability)
- 17.2.9 Toho Gas Co Ltd
- 17.2.9.1. Overview
- 17.2.9.2. Products
- 17.2.9.3. SWOT Analysis
- 17.2.9.4. Recent Developments
- 17.2.9.5. Financials (Based on Availability)
- 17.2.1 Larsen & Toubro Limited
List of Figures
- Figure 1: Global LNG Terminals Industry Revenue Breakdown (Million, %) by Region 2024 & 2032
- Figure 2: North America LNG Terminals Industry Revenue (Million), by Country 2024 & 2032
- Figure 3: North America LNG Terminals Industry Revenue Share (%), by Country 2024 & 2032
- Figure 4: Europe LNG Terminals Industry Revenue (Million), by Country 2024 & 2032
- Figure 5: Europe LNG Terminals Industry Revenue Share (%), by Country 2024 & 2032
- Figure 6: Asia Pacific LNG Terminals Industry Revenue (Million), by Country 2024 & 2032
- Figure 7: Asia Pacific LNG Terminals Industry Revenue Share (%), by Country 2024 & 2032
- Figure 8: South America LNG Terminals Industry Revenue (Million), by Country 2024 & 2032
- Figure 9: South America LNG Terminals Industry Revenue Share (%), by Country 2024 & 2032
- Figure 10: North America LNG Terminals Industry Revenue (Million), by Country 2024 & 2032
- Figure 11: North America LNG Terminals Industry Revenue Share (%), by Country 2024 & 2032
- Figure 12: MEA LNG Terminals Industry Revenue (Million), by Country 2024 & 2032
- Figure 13: MEA LNG Terminals Industry Revenue Share (%), by Country 2024 & 2032
- Figure 14: North America LNG Terminals Industry Revenue (Million), by Terminal Type 2024 & 2032
- Figure 15: North America LNG Terminals Industry Revenue Share (%), by Terminal Type 2024 & 2032
- Figure 16: North America LNG Terminals Industry Revenue (Million), by Country 2024 & 2032
- Figure 17: North America LNG Terminals Industry Revenue Share (%), by Country 2024 & 2032
- Figure 18: Asia Pacific LNG Terminals Industry Revenue (Million), by Terminal Type 2024 & 2032
- Figure 19: Asia Pacific LNG Terminals Industry Revenue Share (%), by Terminal Type 2024 & 2032
- Figure 20: Asia Pacific LNG Terminals Industry Revenue (Million), by Country 2024 & 2032
- Figure 21: Asia Pacific LNG Terminals Industry Revenue Share (%), by Country 2024 & 2032
- Figure 22: Europe LNG Terminals Industry Revenue (Million), by Terminal Type 2024 & 2032
- Figure 23: Europe LNG Terminals Industry Revenue Share (%), by Terminal Type 2024 & 2032
- Figure 24: Europe LNG Terminals Industry Revenue (Million), by Country 2024 & 2032
- Figure 25: Europe LNG Terminals Industry Revenue Share (%), by Country 2024 & 2032
- Figure 26: South America LNG Terminals Industry Revenue (Million), by Terminal Type 2024 & 2032
- Figure 27: South America LNG Terminals Industry Revenue Share (%), by Terminal Type 2024 & 2032
- Figure 28: South America LNG Terminals Industry Revenue (Million), by Country 2024 & 2032
- Figure 29: South America LNG Terminals Industry Revenue Share (%), by Country 2024 & 2032
- Figure 30: Middle East and Africa LNG Terminals Industry Revenue (Million), by Terminal Type 2024 & 2032
- Figure 31: Middle East and Africa LNG Terminals Industry Revenue Share (%), by Terminal Type 2024 & 2032
- Figure 32: Middle East and Africa LNG Terminals Industry Revenue (Million), by Country 2024 & 2032
- Figure 33: Middle East and Africa LNG Terminals Industry Revenue Share (%), by Country 2024 & 2032
List of Tables
- Table 1: Global LNG Terminals Industry Revenue Million Forecast, by Region 2019 & 2032
- Table 2: Global LNG Terminals Industry Revenue Million Forecast, by Terminal Type 2019 & 2032
- Table 3: Global LNG Terminals Industry Revenue Million Forecast, by Region 2019 & 2032
- Table 4: Global LNG Terminals Industry Revenue Million Forecast, by Country 2019 & 2032
- Table 5: United States LNG Terminals Industry Revenue (Million) Forecast, by Application 2019 & 2032
- Table 6: Canada LNG Terminals Industry Revenue (Million) Forecast, by Application 2019 & 2032
- Table 7: Mexico LNG Terminals Industry Revenue (Million) Forecast, by Application 2019 & 2032
- Table 8: Global LNG Terminals Industry Revenue Million Forecast, by Country 2019 & 2032
- Table 9: Germany LNG Terminals Industry Revenue (Million) Forecast, by Application 2019 & 2032
- Table 10: United Kingdom LNG Terminals Industry Revenue (Million) Forecast, by Application 2019 & 2032
- Table 11: France LNG Terminals Industry Revenue (Million) Forecast, by Application 2019 & 2032
- Table 12: Spain LNG Terminals Industry Revenue (Million) Forecast, by Application 2019 & 2032
- Table 13: Italy LNG Terminals Industry Revenue (Million) Forecast, by Application 2019 & 2032
- Table 14: Spain LNG Terminals Industry Revenue (Million) Forecast, by Application 2019 & 2032
- Table 15: Belgium LNG Terminals Industry Revenue (Million) Forecast, by Application 2019 & 2032
- Table 16: Netherland LNG Terminals Industry Revenue (Million) Forecast, by Application 2019 & 2032
- Table 17: Nordics LNG Terminals Industry Revenue (Million) Forecast, by Application 2019 & 2032
- Table 18: Rest of Europe LNG Terminals Industry Revenue (Million) Forecast, by Application 2019 & 2032
- Table 19: Global LNG Terminals Industry Revenue Million Forecast, by Country 2019 & 2032
- Table 20: China LNG Terminals Industry Revenue (Million) Forecast, by Application 2019 & 2032
- Table 21: Japan LNG Terminals Industry Revenue (Million) Forecast, by Application 2019 & 2032
- Table 22: India LNG Terminals Industry Revenue (Million) Forecast, by Application 2019 & 2032
- Table 23: South Korea LNG Terminals Industry Revenue (Million) Forecast, by Application 2019 & 2032
- Table 24: Southeast Asia LNG Terminals Industry Revenue (Million) Forecast, by Application 2019 & 2032
- Table 25: Australia LNG Terminals Industry Revenue (Million) Forecast, by Application 2019 & 2032
- Table 26: Indonesia LNG Terminals Industry Revenue (Million) Forecast, by Application 2019 & 2032
- Table 27: Phillipes LNG Terminals Industry Revenue (Million) Forecast, by Application 2019 & 2032
- Table 28: Singapore LNG Terminals Industry Revenue (Million) Forecast, by Application 2019 & 2032
- Table 29: Thailandc LNG Terminals Industry Revenue (Million) Forecast, by Application 2019 & 2032
- Table 30: Rest of Asia Pacific LNG Terminals Industry Revenue (Million) Forecast, by Application 2019 & 2032
- Table 31: Global LNG Terminals Industry Revenue Million Forecast, by Country 2019 & 2032
- Table 32: Brazil LNG Terminals Industry Revenue (Million) Forecast, by Application 2019 & 2032
- Table 33: Argentina LNG Terminals Industry Revenue (Million) Forecast, by Application 2019 & 2032
- Table 34: Peru LNG Terminals Industry Revenue (Million) Forecast, by Application 2019 & 2032
- Table 35: Chile LNG Terminals Industry Revenue (Million) Forecast, by Application 2019 & 2032
- Table 36: Colombia LNG Terminals Industry Revenue (Million) Forecast, by Application 2019 & 2032
- Table 37: Ecuador LNG Terminals Industry Revenue (Million) Forecast, by Application 2019 & 2032
- Table 38: Venezuela LNG Terminals Industry Revenue (Million) Forecast, by Application 2019 & 2032
- Table 39: Rest of South America LNG Terminals Industry Revenue (Million) Forecast, by Application 2019 & 2032
- Table 40: Global LNG Terminals Industry Revenue Million Forecast, by Country 2019 & 2032
- Table 41: United States LNG Terminals Industry Revenue (Million) Forecast, by Application 2019 & 2032
- Table 42: Canada LNG Terminals Industry Revenue (Million) Forecast, by Application 2019 & 2032
- Table 43: Mexico LNG Terminals Industry Revenue (Million) Forecast, by Application 2019 & 2032
- Table 44: Global LNG Terminals Industry Revenue Million Forecast, by Country 2019 & 2032
- Table 45: United Arab Emirates LNG Terminals Industry Revenue (Million) Forecast, by Application 2019 & 2032
- Table 46: Saudi Arabia LNG Terminals Industry Revenue (Million) Forecast, by Application 2019 & 2032
- Table 47: South Africa LNG Terminals Industry Revenue (Million) Forecast, by Application 2019 & 2032
- Table 48: Rest of Middle East and Africa LNG Terminals Industry Revenue (Million) Forecast, by Application 2019 & 2032
- Table 49: Global LNG Terminals Industry Revenue Million Forecast, by Terminal Type 2019 & 2032
- Table 50: Global LNG Terminals Industry Revenue Million Forecast, by Country 2019 & 2032
- Table 51: Global LNG Terminals Industry Revenue Million Forecast, by Terminal Type 2019 & 2032
- Table 52: Global LNG Terminals Industry Revenue Million Forecast, by Country 2019 & 2032
- Table 53: Global LNG Terminals Industry Revenue Million Forecast, by Terminal Type 2019 & 2032
- Table 54: Global LNG Terminals Industry Revenue Million Forecast, by Country 2019 & 2032
- Table 55: Global LNG Terminals Industry Revenue Million Forecast, by Terminal Type 2019 & 2032
- Table 56: Global LNG Terminals Industry Revenue Million Forecast, by Country 2019 & 2032
- Table 57: Global LNG Terminals Industry Revenue Million Forecast, by Terminal Type 2019 & 2032
- Table 58: Global LNG Terminals Industry Revenue Million Forecast, by Country 2019 & 2032
Frequently Asked Questions
1. What is the projected Compound Annual Growth Rate (CAGR) of the LNG Terminals Industry?
The projected CAGR is approximately 5.90%.
2. Which companies are prominent players in the LNG Terminals Industry?
Key companies in the market include Larsen & Toubro Limited, Samsung C&T Corporation, CTCI Resources Engineering Inc *List Not Exhaustive, Petronet LNG Limited, Royal Dutch Shell PLC, Tokyo Gas Co Ltd, McDermott International Inc, Egyptian Natural Gas Holding Company, Toho Gas Co Ltd.
3. What are the main segments of the LNG Terminals Industry?
The market segments include Terminal Type.
4. Can you provide details about the market size?
The market size is estimated to be USD XX Million as of 2022.
5. What are some drivers contributing to market growth?
4.; Declining Solar Panel Costs4.; Supportive Government Policies.
6. What are the notable trends driving market growth?
Floating Storage Regasification Unit to Witness Huge Growth.
7. Are there any restraints impacting market growth?
4.; High Upfront Cost.
8. Can you provide examples of recent developments in the market?
N/A
9. What pricing options are available for accessing the report?
Pricing options include single-user, multi-user, and enterprise licenses priced at USD 4750, USD 5250, and USD 8750 respectively.
10. Is the market size provided in terms of value or volume?
The market size is provided in terms of value, measured in Million.
11. Are there any specific market keywords associated with the report?
Yes, the market keyword associated with the report is "LNG Terminals Industry," which aids in identifying and referencing the specific market segment covered.
12. How do I determine which pricing option suits my needs best?
The pricing options vary based on user requirements and access needs. Individual users may opt for single-user licenses, while businesses requiring broader access may choose multi-user or enterprise licenses for cost-effective access to the report.
13. Are there any additional resources or data provided in the LNG Terminals Industry report?
While the report offers comprehensive insights, it's advisable to review the specific contents or supplementary materials provided to ascertain if additional resources or data are available.
14. How can I stay updated on further developments or reports in the LNG Terminals Industry?
To stay informed about further developments, trends, and reports in the LNG Terminals Industry, consider subscribing to industry newsletters, following relevant companies and organizations, or regularly checking reputable industry news sources and publications.
Methodology
Step 1 - Identification of Relevant Samples Size from Population Database


Step 2 - Approaches for Defining Global Market Size (Value, Volume* & Price*)

Note*: In applicable scenarios
Step 3 - Data Sources
Primary Research
- Web Analytics
- Survey Reports
- Research Institute
- Latest Research Reports
- Opinion Leaders
Secondary Research
- Annual Reports
- White Paper
- Latest Press Release
- Industry Association
- Paid Database
- Investor Presentations

Step 4 - Data Triangulation
Involves using different sources of information in order to increase the validity of a study
These sources are likely to be stakeholders in a program - participants, other researchers, program staff, other community members, and so on.
Then we put all data in single framework & apply various statistical tools to find out the dynamic on the market.
During the analysis stage, feedback from the stakeholder groups would be compared to determine areas of agreement as well as areas of divergence


