
Key Insights
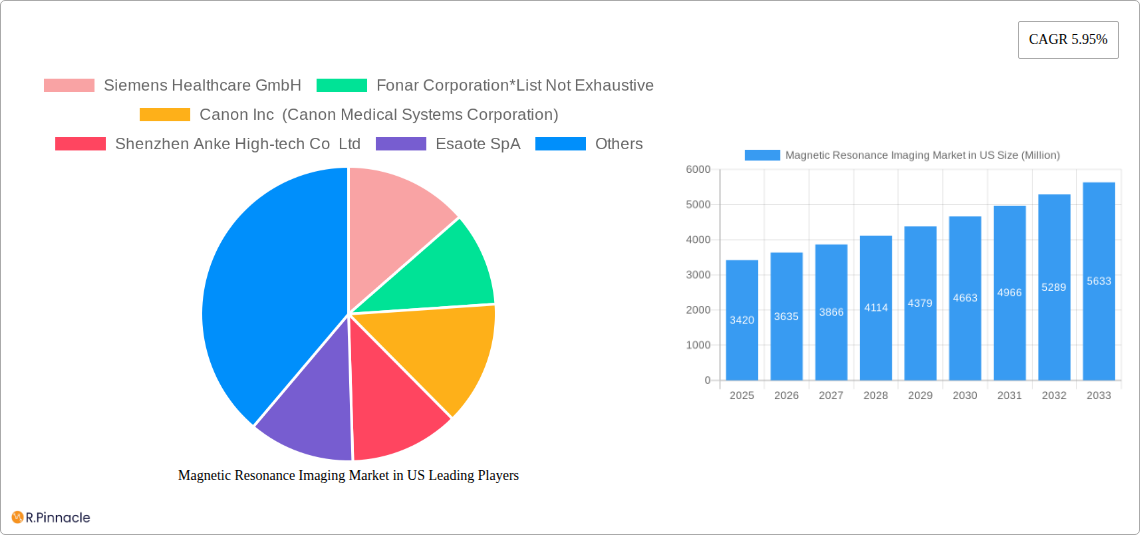
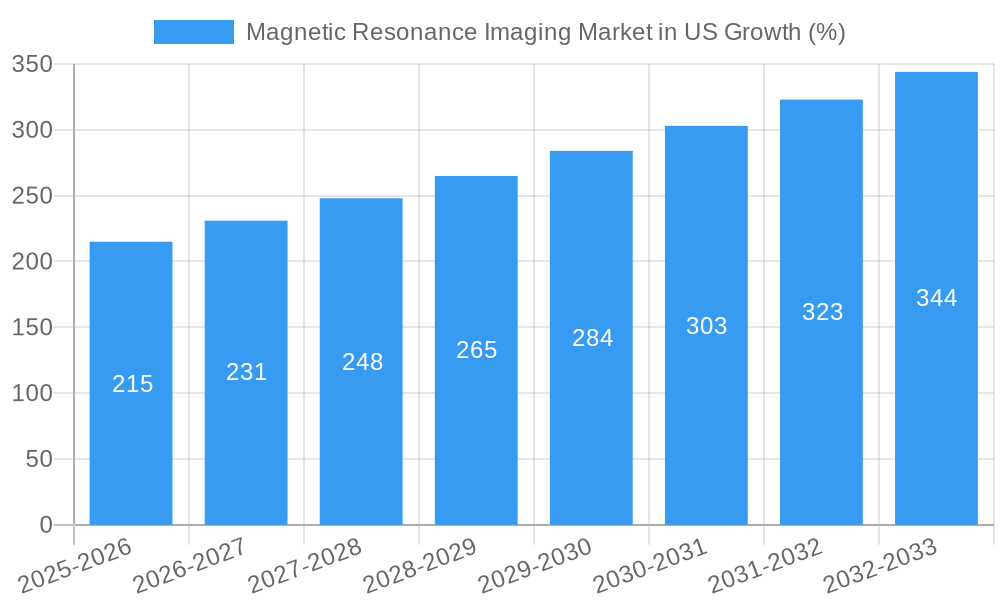
The US Magnetic Resonance Imaging (MRI) market, valued at $3.42 billion in 2025, is projected to experience robust growth, driven by a rising prevalence of chronic diseases requiring advanced diagnostic imaging, technological advancements leading to faster scan times and improved image quality, and increasing adoption of minimally invasive procedures. The market's Compound Annual Growth Rate (CAGR) of 5.95% from 2025 to 2033 indicates substantial expansion. Key segments driving this growth include high-field and ultra-high-field MRI systems offering superior resolution and diagnostic capabilities, particularly crucial in oncology, neurology, and cardiology applications. The increasing demand for advanced MRI technology in specialized applications, like musculoskeletal imaging, is further fueling market expansion. Growth is also propelled by ongoing research and development in MRI technology, resulting in innovations such as improved coil designs, faster data acquisition methods, and advanced image processing algorithms.
However, market growth may face some restraints. High capital expenditure associated with MRI systems, particularly high-field and ultra-high-field systems, might limit accessibility for smaller healthcare facilities. Furthermore, the increasing preference for less expensive alternatives, such as computed tomography (CT) scans in certain applications, could partially restrain market expansion. Nevertheless, the continued advancement in MRI technology, coupled with government initiatives promoting advanced healthcare infrastructure, are likely to mitigate these challenges, ensuring a sustained growth trajectory for the US MRI market throughout the forecast period. Leading companies like Siemens Healthcare, GE Healthcare, and Philips are expected to remain key players, while smaller, specialized companies are expected to compete effectively in niche segments.
Magnetic Resonance Imaging (MRI) Market in US: A Comprehensive Report (2019-2033)
This in-depth report provides a comprehensive analysis of the Magnetic Resonance Imaging (MRI) market in the US, covering the period from 2019 to 2033. It offers invaluable insights for industry professionals, investors, and strategic decision-makers seeking to understand the market's dynamics, growth drivers, and future potential. The report leverages extensive data analysis and incorporates recent industry developments to present a clear and actionable picture of this vital healthcare sector. The US MRI market is segmented by architecture (Closed and Open MRI Systems), field strength (Low, High, Very High, and Ultra-high Field MRI Systems), and application (Oncology, Neurology, Cardiology, Gastroenterology, Musculoskeletal, and Other Applications). Key players analyzed include Siemens Healthcare GmbH, Fonar Corporation, Canon Inc (Canon Medical Systems Corporation), Shenzhen Anke High-tech Co Ltd, Esaote SpA, Aurora Imaging Technology, Koninklijke Philips N V, GE HealthCare, Neusoft Medical Systems Co Ltd, and Fujifilm Holdings Corporation. This is not an exhaustive list.
Magnetic Resonance Imaging Market in US Market Structure & Innovation Trends
The US MRI market exhibits a moderately concentrated structure, with a few dominant players holding significant market share. Siemens Healthcare GmbH, GE HealthCare, and Philips are among the leading companies, collectively accounting for an estimated xx% of the market in 2025. However, smaller players and specialized providers are also contributing to market growth, particularly in niche applications. Innovation is a key driver, fueled by advancements in deep learning, improved image quality, faster scan times, and the development of new contrast agents. The regulatory framework, primarily overseen by the FDA, plays a crucial role in ensuring safety and efficacy. Substitutes for MRI, such as CT scans and ultrasound, exist, but MRI's unique capabilities in soft tissue imaging maintain its dominance in specific applications. The end-user demographic is primarily hospitals, imaging centers, and private practices. M&A activities have been relatively moderate in recent years, with deal values totaling approximately xx Million in the period 2019-2024, driven by consolidation efforts and expansion into new markets.
Magnetic Resonance Imaging Market in US Market Dynamics & Trends
The US MRI market is experiencing robust growth, driven by factors such as the rising prevalence of chronic diseases (e.g., cancer, cardiovascular diseases, neurological disorders), technological advancements resulting in improved image quality and faster scan times, and increased healthcare spending. The market's compound annual growth rate (CAGR) is projected to be xx% during the forecast period (2025-2033). Technological disruptions, such as the integration of AI and deep learning, are significantly enhancing diagnostic accuracy and efficiency. Consumer preferences are increasingly leaning towards faster, less claustrophobic MRI systems with improved patient comfort. Competitive dynamics are characterized by intense innovation, strategic partnerships, and a focus on differentiated product offerings. Market penetration of high-field and ultra-high-field MRI systems is expected to increase steadily, driven by their superior imaging capabilities.
Dominant Regions & Segments in Magnetic Resonance Imaging Market in US
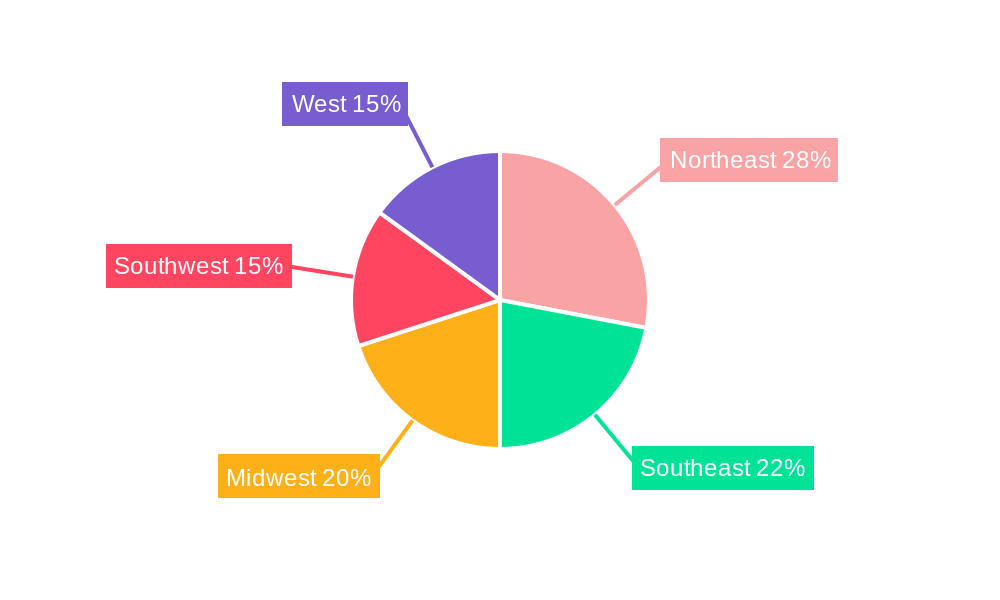
The MRI market in the US is geographically diverse, with significant growth across all major regions. However, densely populated states with high concentrations of hospitals and imaging centers (e.g., California, Texas, Florida, New York) tend to exhibit higher demand.
Key Drivers:
- High Healthcare Expenditure: Significant investment in healthcare infrastructure and technology.
- Favorable Regulatory Environment: FDA approval processes facilitate market entry and innovation.
- Advanced Healthcare Infrastructure: Well-established network of hospitals and diagnostic imaging centers.
Segment Dominance:
- Architecture: Closed MRI systems currently hold a larger market share due to superior image quality; however, open MRI systems are experiencing growth driven by patient comfort and reduced claustrophobia.
- Field Strength: High-field and ultra-high-field MRI systems are gaining traction due to enhanced image resolution and diagnostic capabilities, albeit at a higher cost.
- Application: Oncology and neurology remain the largest application segments, reflecting the high prevalence of related diseases and the unique diagnostic capabilities of MRI in these areas.
Magnetic Resonance Imaging Market in US Product Innovations
Recent innovations in MRI technology focus on enhanced image quality, reduced scan times, and improved patient comfort. Deep learning algorithms are being integrated to accelerate image acquisition and improve diagnostic accuracy. New contrast agents are being developed to enhance visualization of specific tissues and organs. These innovations are expanding the applications of MRI, making it more accessible and efficient. The market fit of these innovations is strong, as they address key limitations of traditional MRI systems and cater to growing market demands for faster, higher-quality imaging.
Report Scope & Segmentation Analysis
This report provides a comprehensive segmentation of the US MRI market across architecture, field strength, and application.
Architecture: Closed MRI Systems (market size xx Million in 2025, projected CAGR xx%), Open MRI Systems (market size xx Million in 2025, projected CAGR xx%). Competitive dynamics are shaped by the trade-off between image quality and patient comfort.
Field Strength: Low Field MRI Systems (market size xx Million in 2025, projected CAGR xx%), High Field MRI Systems (market size xx Million in 2025, projected CAGR xx%), Very High Field MRI Systems (market size xx Million in 2025, projected CAGR xx%), Ultra-high Field MRI Systems (market size xx Million in 2025, projected CAGR xx%). Higher field strengths offer improved image quality, but come at a higher cost.
Application: Oncology (market size xx Million in 2025, projected CAGR xx%), Neurology (market size xx Million in 2025, projected CAGR xx%), Cardiology (market size xx Million in 2025, projected CAGR xx%), Gastroenterology (market size xx Million in 2025, projected CAGR xx%), Musculoskeletal (market size xx Million in 2025, projected CAGR xx%), Other Applications (market size xx Million in 2025, projected CAGR xx%). Each application segment shows varying growth rates reflecting disease prevalence and technological advancements.
Key Drivers of Magnetic Resonance Imaging Market in US Growth
The US MRI market's growth is propelled by several factors: the increasing prevalence of chronic diseases requiring advanced diagnostic imaging, continuous technological advancements resulting in faster and higher-resolution scans, rising healthcare spending, and favorable regulatory support from the FDA. The expanding application of MRI in various medical specialties further fuels market expansion.
Challenges in the Magnetic Resonance Imaging Market in US Sector
The MRI market faces challenges such as high equipment costs, the need for specialized personnel, and the competition from alternative imaging modalities like CT scans and ultrasound. Regulatory hurdles, potential supply chain disruptions, and reimbursement policies also influence market growth. These factors contribute to a complex market landscape.
Emerging Opportunities in Magnetic Resonance Imaging Market in US
Emerging opportunities include the integration of AI and machine learning for enhanced image analysis, the development of novel contrast agents for improved specificity and sensitivity, and the expansion of MRI applications into new therapeutic areas. Growth potential also lies in the development of more compact and portable MRI systems to improve accessibility.
Leading Players in the Magnetic Resonance Imaging Market in US Market
- Siemens Healthcare GmbH
- Fonar Corporation
- Canon Inc (Canon Medical Systems Corporation)
- Shenzhen Anke High-tech Co Ltd
- Esaote SpA
- Aurora Imaging Technology
- Koninklijke Philips N V
- GE HealthCare
- Neusoft Medical Systems Co Ltd
- Fujifilm Holdings Corporation
Key Developments in Magnetic Resonance Imaging Market in US Industry
- June 2023: GE HealthCare launched its FDA-cleared Sonic DL, a deep learning-based technology accelerating MRI image acquisition, enabling high-quality cardiac MRI in a single heartbeat. This significantly enhances workflow efficiency and diagnostic capabilities.
- May 2023: Cincinnati Children’s Hospital Medical Center used XENOVIEW, a xenon gas MRI technology, for the first time in the US, expanding MRI applications into lung ventilation assessment. This illustrates the market's expansion into novel diagnostic areas.
Future Outlook for Magnetic Resonance Imaging Market in US Market
The future of the US MRI market is promising, driven by ongoing technological advancements, increasing prevalence of chronic diseases, and the expansion of MRI's applications. Strategic partnerships, investment in R&D, and the development of innovative solutions will shape the market's trajectory. The focus will remain on improving image quality, reducing scan times, enhancing patient comfort, and expanding access to MRI technology across different healthcare settings.
Magnetic Resonance Imaging Market in US Segmentation
-
1. Architecture
- 1.1. Closed MRI Systems
- 1.2. Open MRI Systems
-
2. Field Strength
- 2.1. Low Field MRI Systems
- 2.2. High Field MRI Systems
- 2.3. Very Hig
-
3. Application
- 3.1. Oncology
- 3.2. Neurology
- 3.3. Cardiology
- 3.4. Gastroenterology
- 3.5. Musculoskeletal
- 3.6. Other Applications
Magnetic Resonance Imaging Market in US Segmentation By Geography
-
1. North America
- 1.1. United States
- 1.2. Canada
- 1.3. Mexico
-
2. South America
- 2.1. Brazil
- 2.2. Argentina
- 2.3. Rest of South America
-
3. Europe
- 3.1. United Kingdom
- 3.2. Germany
- 3.3. France
- 3.4. Italy
- 3.5. Spain
- 3.6. Russia
- 3.7. Benelux
- 3.8. Nordics
- 3.9. Rest of Europe
-
4. Middle East & Africa
- 4.1. Turkey
- 4.2. Israel
- 4.3. GCC
- 4.4. North Africa
- 4.5. South Africa
- 4.6. Rest of Middle East & Africa
-
5. Asia Pacific
- 5.1. China
- 5.2. India
- 5.3. Japan
- 5.4. South Korea
- 5.5. ASEAN
- 5.6. Oceania
- 5.7. Rest of Asia Pacific
Magnetic Resonance Imaging Market in US REPORT HIGHLIGHTS
| Aspects | Details |
|---|---|
| Study Period | 2019-2033 |
| Base Year | 2024 |
| Estimated Year | 2025 |
| Forecast Period | 2025-2033 |
| Historical Period | 2019-2024 |
| Growth Rate | CAGR of 5.95% from 2019-2033 |
| Segmentation |
|
Table of Contents
- 1. Introduction
- 1.1. Research Scope
- 1.2. Market Segmentation
- 1.3. Research Methodology
- 1.4. Definitions and Assumptions
- 2. Executive Summary
- 2.1. Introduction
- 3. Market Dynamics
- 3.1. Introduction
- 3.2. Market Drivers
- 3.2.1. Growing Burden of Chronic Diseases; Advancements in MRI Systems and Availability of Universal Health Coverage
- 3.3. Market Restrains
- 3.3.1. High Cost of MRI Systems
- 3.4. Market Trends
- 3.4.1. Neurology Segment is Expected to Witness Significant Growth Over the Forecast Period
- 4. Market Factor Analysis
- 4.1. Porters Five Forces
- 4.2. Supply/Value Chain
- 4.3. PESTEL analysis
- 4.4. Market Entropy
- 4.5. Patent/Trademark Analysis
- 5. Global Magnetic Resonance Imaging Market in US Analysis, Insights and Forecast, 2019-2031
- 5.1. Market Analysis, Insights and Forecast - by Architecture
- 5.1.1. Closed MRI Systems
- 5.1.2. Open MRI Systems
- 5.2. Market Analysis, Insights and Forecast - by Field Strength
- 5.2.1. Low Field MRI Systems
- 5.2.2. High Field MRI Systems
- 5.2.3. Very Hig
- 5.3. Market Analysis, Insights and Forecast - by Application
- 5.3.1. Oncology
- 5.3.2. Neurology
- 5.3.3. Cardiology
- 5.3.4. Gastroenterology
- 5.3.5. Musculoskeletal
- 5.3.6. Other Applications
- 5.4. Market Analysis, Insights and Forecast - by Region
- 5.4.1. North America
- 5.4.2. South America
- 5.4.3. Europe
- 5.4.4. Middle East & Africa
- 5.4.5. Asia Pacific
- 5.1. Market Analysis, Insights and Forecast - by Architecture
- 6. North America Magnetic Resonance Imaging Market in US Analysis, Insights and Forecast, 2019-2031
- 6.1. Market Analysis, Insights and Forecast - by Architecture
- 6.1.1. Closed MRI Systems
- 6.1.2. Open MRI Systems
- 6.2. Market Analysis, Insights and Forecast - by Field Strength
- 6.2.1. Low Field MRI Systems
- 6.2.2. High Field MRI Systems
- 6.2.3. Very Hig
- 6.3. Market Analysis, Insights and Forecast - by Application
- 6.3.1. Oncology
- 6.3.2. Neurology
- 6.3.3. Cardiology
- 6.3.4. Gastroenterology
- 6.3.5. Musculoskeletal
- 6.3.6. Other Applications
- 6.1. Market Analysis, Insights and Forecast - by Architecture
- 7. South America Magnetic Resonance Imaging Market in US Analysis, Insights and Forecast, 2019-2031
- 7.1. Market Analysis, Insights and Forecast - by Architecture
- 7.1.1. Closed MRI Systems
- 7.1.2. Open MRI Systems
- 7.2. Market Analysis, Insights and Forecast - by Field Strength
- 7.2.1. Low Field MRI Systems
- 7.2.2. High Field MRI Systems
- 7.2.3. Very Hig
- 7.3. Market Analysis, Insights and Forecast - by Application
- 7.3.1. Oncology
- 7.3.2. Neurology
- 7.3.3. Cardiology
- 7.3.4. Gastroenterology
- 7.3.5. Musculoskeletal
- 7.3.6. Other Applications
- 7.1. Market Analysis, Insights and Forecast - by Architecture
- 8. Europe Magnetic Resonance Imaging Market in US Analysis, Insights and Forecast, 2019-2031
- 8.1. Market Analysis, Insights and Forecast - by Architecture
- 8.1.1. Closed MRI Systems
- 8.1.2. Open MRI Systems
- 8.2. Market Analysis, Insights and Forecast - by Field Strength
- 8.2.1. Low Field MRI Systems
- 8.2.2. High Field MRI Systems
- 8.2.3. Very Hig
- 8.3. Market Analysis, Insights and Forecast - by Application
- 8.3.1. Oncology
- 8.3.2. Neurology
- 8.3.3. Cardiology
- 8.3.4. Gastroenterology
- 8.3.5. Musculoskeletal
- 8.3.6. Other Applications
- 8.1. Market Analysis, Insights and Forecast - by Architecture
- 9. Middle East & Africa Magnetic Resonance Imaging Market in US Analysis, Insights and Forecast, 2019-2031
- 9.1. Market Analysis, Insights and Forecast - by Architecture
- 9.1.1. Closed MRI Systems
- 9.1.2. Open MRI Systems
- 9.2. Market Analysis, Insights and Forecast - by Field Strength
- 9.2.1. Low Field MRI Systems
- 9.2.2. High Field MRI Systems
- 9.2.3. Very Hig
- 9.3. Market Analysis, Insights and Forecast - by Application
- 9.3.1. Oncology
- 9.3.2. Neurology
- 9.3.3. Cardiology
- 9.3.4. Gastroenterology
- 9.3.5. Musculoskeletal
- 9.3.6. Other Applications
- 9.1. Market Analysis, Insights and Forecast - by Architecture
- 10. Asia Pacific Magnetic Resonance Imaging Market in US Analysis, Insights and Forecast, 2019-2031
- 10.1. Market Analysis, Insights and Forecast - by Architecture
- 10.1.1. Closed MRI Systems
- 10.1.2. Open MRI Systems
- 10.2. Market Analysis, Insights and Forecast - by Field Strength
- 10.2.1. Low Field MRI Systems
- 10.2.2. High Field MRI Systems
- 10.2.3. Very Hig
- 10.3. Market Analysis, Insights and Forecast - by Application
- 10.3.1. Oncology
- 10.3.2. Neurology
- 10.3.3. Cardiology
- 10.3.4. Gastroenterology
- 10.3.5. Musculoskeletal
- 10.3.6. Other Applications
- 10.1. Market Analysis, Insights and Forecast - by Architecture
- 11. Northeast Magnetic Resonance Imaging Market in US Analysis, Insights and Forecast, 2019-2031
- 12. Southeast Magnetic Resonance Imaging Market in US Analysis, Insights and Forecast, 2019-2031
- 13. Midwest Magnetic Resonance Imaging Market in US Analysis, Insights and Forecast, 2019-2031
- 14. Southwest Magnetic Resonance Imaging Market in US Analysis, Insights and Forecast, 2019-2031
- 15. West Magnetic Resonance Imaging Market in US Analysis, Insights and Forecast, 2019-2031
- 16. Competitive Analysis
- 16.1. Global Market Share Analysis 2024
- 16.2. Company Profiles
- 16.2.1 Siemens Healthcare GmbH
- 16.2.1.1. Overview
- 16.2.1.2. Products
- 16.2.1.3. SWOT Analysis
- 16.2.1.4. Recent Developments
- 16.2.1.5. Financials (Based on Availability)
- 16.2.2 Fonar Corporation*List Not Exhaustive
- 16.2.2.1. Overview
- 16.2.2.2. Products
- 16.2.2.3. SWOT Analysis
- 16.2.2.4. Recent Developments
- 16.2.2.5. Financials (Based on Availability)
- 16.2.3 Canon Inc (Canon Medical Systems Corporation)
- 16.2.3.1. Overview
- 16.2.3.2. Products
- 16.2.3.3. SWOT Analysis
- 16.2.3.4. Recent Developments
- 16.2.3.5. Financials (Based on Availability)
- 16.2.4 Shenzhen Anke High-tech Co Ltd
- 16.2.4.1. Overview
- 16.2.4.2. Products
- 16.2.4.3. SWOT Analysis
- 16.2.4.4. Recent Developments
- 16.2.4.5. Financials (Based on Availability)
- 16.2.5 Esaote SpA
- 16.2.5.1. Overview
- 16.2.5.2. Products
- 16.2.5.3. SWOT Analysis
- 16.2.5.4. Recent Developments
- 16.2.5.5. Financials (Based on Availability)
- 16.2.6 Aurora Imaging Technology
- 16.2.6.1. Overview
- 16.2.6.2. Products
- 16.2.6.3. SWOT Analysis
- 16.2.6.4. Recent Developments
- 16.2.6.5. Financials (Based on Availability)
- 16.2.7 Koninklijke Philips N V
- 16.2.7.1. Overview
- 16.2.7.2. Products
- 16.2.7.3. SWOT Analysis
- 16.2.7.4. Recent Developments
- 16.2.7.5. Financials (Based on Availability)
- 16.2.8 GE HealthCare
- 16.2.8.1. Overview
- 16.2.8.2. Products
- 16.2.8.3. SWOT Analysis
- 16.2.8.4. Recent Developments
- 16.2.8.5. Financials (Based on Availability)
- 16.2.9 Neusoft Medical Systems Co Ltd
- 16.2.9.1. Overview
- 16.2.9.2. Products
- 16.2.9.3. SWOT Analysis
- 16.2.9.4. Recent Developments
- 16.2.9.5. Financials (Based on Availability)
- 16.2.10 Fujifilm Holdings Corporation
- 16.2.10.1. Overview
- 16.2.10.2. Products
- 16.2.10.3. SWOT Analysis
- 16.2.10.4. Recent Developments
- 16.2.10.5. Financials (Based on Availability)
- 16.2.1 Siemens Healthcare GmbH
List of Figures
- Figure 1: Global Magnetic Resonance Imaging Market in US Revenue Breakdown (Million, %) by Region 2024 & 2032
- Figure 2: Global Magnetic Resonance Imaging Market in US Volume Breakdown (Piece, %) by Region 2024 & 2032
- Figure 3: United states Magnetic Resonance Imaging Market in US Revenue (Million), by Country 2024 & 2032
- Figure 4: United states Magnetic Resonance Imaging Market in US Volume (Piece), by Country 2024 & 2032
- Figure 5: United states Magnetic Resonance Imaging Market in US Revenue Share (%), by Country 2024 & 2032
- Figure 6: United states Magnetic Resonance Imaging Market in US Volume Share (%), by Country 2024 & 2032
- Figure 7: North America Magnetic Resonance Imaging Market in US Revenue (Million), by Architecture 2024 & 2032
- Figure 8: North America Magnetic Resonance Imaging Market in US Volume (Piece), by Architecture 2024 & 2032
- Figure 9: North America Magnetic Resonance Imaging Market in US Revenue Share (%), by Architecture 2024 & 2032
- Figure 10: North America Magnetic Resonance Imaging Market in US Volume Share (%), by Architecture 2024 & 2032
- Figure 11: North America Magnetic Resonance Imaging Market in US Revenue (Million), by Field Strength 2024 & 2032
- Figure 12: North America Magnetic Resonance Imaging Market in US Volume (Piece), by Field Strength 2024 & 2032
- Figure 13: North America Magnetic Resonance Imaging Market in US Revenue Share (%), by Field Strength 2024 & 2032
- Figure 14: North America Magnetic Resonance Imaging Market in US Volume Share (%), by Field Strength 2024 & 2032
- Figure 15: North America Magnetic Resonance Imaging Market in US Revenue (Million), by Application 2024 & 2032
- Figure 16: North America Magnetic Resonance Imaging Market in US Volume (Piece), by Application 2024 & 2032
- Figure 17: North America Magnetic Resonance Imaging Market in US Revenue Share (%), by Application 2024 & 2032
- Figure 18: North America Magnetic Resonance Imaging Market in US Volume Share (%), by Application 2024 & 2032
- Figure 19: North America Magnetic Resonance Imaging Market in US Revenue (Million), by Country 2024 & 2032
- Figure 20: North America Magnetic Resonance Imaging Market in US Volume (Piece), by Country 2024 & 2032
- Figure 21: North America Magnetic Resonance Imaging Market in US Revenue Share (%), by Country 2024 & 2032
- Figure 22: North America Magnetic Resonance Imaging Market in US Volume Share (%), by Country 2024 & 2032
- Figure 23: South America Magnetic Resonance Imaging Market in US Revenue (Million), by Architecture 2024 & 2032
- Figure 24: South America Magnetic Resonance Imaging Market in US Volume (Piece), by Architecture 2024 & 2032
- Figure 25: South America Magnetic Resonance Imaging Market in US Revenue Share (%), by Architecture 2024 & 2032
- Figure 26: South America Magnetic Resonance Imaging Market in US Volume Share (%), by Architecture 2024 & 2032
- Figure 27: South America Magnetic Resonance Imaging Market in US Revenue (Million), by Field Strength 2024 & 2032
- Figure 28: South America Magnetic Resonance Imaging Market in US Volume (Piece), by Field Strength 2024 & 2032
- Figure 29: South America Magnetic Resonance Imaging Market in US Revenue Share (%), by Field Strength 2024 & 2032
- Figure 30: South America Magnetic Resonance Imaging Market in US Volume Share (%), by Field Strength 2024 & 2032
- Figure 31: South America Magnetic Resonance Imaging Market in US Revenue (Million), by Application 2024 & 2032
- Figure 32: South America Magnetic Resonance Imaging Market in US Volume (Piece), by Application 2024 & 2032
- Figure 33: South America Magnetic Resonance Imaging Market in US Revenue Share (%), by Application 2024 & 2032
- Figure 34: South America Magnetic Resonance Imaging Market in US Volume Share (%), by Application 2024 & 2032
- Figure 35: South America Magnetic Resonance Imaging Market in US Revenue (Million), by Country 2024 & 2032
- Figure 36: South America Magnetic Resonance Imaging Market in US Volume (Piece), by Country 2024 & 2032
- Figure 37: South America Magnetic Resonance Imaging Market in US Revenue Share (%), by Country 2024 & 2032
- Figure 38: South America Magnetic Resonance Imaging Market in US Volume Share (%), by Country 2024 & 2032
- Figure 39: Europe Magnetic Resonance Imaging Market in US Revenue (Million), by Architecture 2024 & 2032
- Figure 40: Europe Magnetic Resonance Imaging Market in US Volume (Piece), by Architecture 2024 & 2032
- Figure 41: Europe Magnetic Resonance Imaging Market in US Revenue Share (%), by Architecture 2024 & 2032
- Figure 42: Europe Magnetic Resonance Imaging Market in US Volume Share (%), by Architecture 2024 & 2032
- Figure 43: Europe Magnetic Resonance Imaging Market in US Revenue (Million), by Field Strength 2024 & 2032
- Figure 44: Europe Magnetic Resonance Imaging Market in US Volume (Piece), by Field Strength 2024 & 2032
- Figure 45: Europe Magnetic Resonance Imaging Market in US Revenue Share (%), by Field Strength 2024 & 2032
- Figure 46: Europe Magnetic Resonance Imaging Market in US Volume Share (%), by Field Strength 2024 & 2032
- Figure 47: Europe Magnetic Resonance Imaging Market in US Revenue (Million), by Application 2024 & 2032
- Figure 48: Europe Magnetic Resonance Imaging Market in US Volume (Piece), by Application 2024 & 2032
- Figure 49: Europe Magnetic Resonance Imaging Market in US Revenue Share (%), by Application 2024 & 2032
- Figure 50: Europe Magnetic Resonance Imaging Market in US Volume Share (%), by Application 2024 & 2032
- Figure 51: Europe Magnetic Resonance Imaging Market in US Revenue (Million), by Country 2024 & 2032
- Figure 52: Europe Magnetic Resonance Imaging Market in US Volume (Piece), by Country 2024 & 2032
- Figure 53: Europe Magnetic Resonance Imaging Market in US Revenue Share (%), by Country 2024 & 2032
- Figure 54: Europe Magnetic Resonance Imaging Market in US Volume Share (%), by Country 2024 & 2032
- Figure 55: Middle East & Africa Magnetic Resonance Imaging Market in US Revenue (Million), by Architecture 2024 & 2032
- Figure 56: Middle East & Africa Magnetic Resonance Imaging Market in US Volume (Piece), by Architecture 2024 & 2032
- Figure 57: Middle East & Africa Magnetic Resonance Imaging Market in US Revenue Share (%), by Architecture 2024 & 2032
- Figure 58: Middle East & Africa Magnetic Resonance Imaging Market in US Volume Share (%), by Architecture 2024 & 2032
- Figure 59: Middle East & Africa Magnetic Resonance Imaging Market in US Revenue (Million), by Field Strength 2024 & 2032
- Figure 60: Middle East & Africa Magnetic Resonance Imaging Market in US Volume (Piece), by Field Strength 2024 & 2032
- Figure 61: Middle East & Africa Magnetic Resonance Imaging Market in US Revenue Share (%), by Field Strength 2024 & 2032
- Figure 62: Middle East & Africa Magnetic Resonance Imaging Market in US Volume Share (%), by Field Strength 2024 & 2032
- Figure 63: Middle East & Africa Magnetic Resonance Imaging Market in US Revenue (Million), by Application 2024 & 2032
- Figure 64: Middle East & Africa Magnetic Resonance Imaging Market in US Volume (Piece), by Application 2024 & 2032
- Figure 65: Middle East & Africa Magnetic Resonance Imaging Market in US Revenue Share (%), by Application 2024 & 2032
- Figure 66: Middle East & Africa Magnetic Resonance Imaging Market in US Volume Share (%), by Application 2024 & 2032
- Figure 67: Middle East & Africa Magnetic Resonance Imaging Market in US Revenue (Million), by Country 2024 & 2032
- Figure 68: Middle East & Africa Magnetic Resonance Imaging Market in US Volume (Piece), by Country 2024 & 2032
- Figure 69: Middle East & Africa Magnetic Resonance Imaging Market in US Revenue Share (%), by Country 2024 & 2032
- Figure 70: Middle East & Africa Magnetic Resonance Imaging Market in US Volume Share (%), by Country 2024 & 2032
- Figure 71: Asia Pacific Magnetic Resonance Imaging Market in US Revenue (Million), by Architecture 2024 & 2032
- Figure 72: Asia Pacific Magnetic Resonance Imaging Market in US Volume (Piece), by Architecture 2024 & 2032
- Figure 73: Asia Pacific Magnetic Resonance Imaging Market in US Revenue Share (%), by Architecture 2024 & 2032
- Figure 74: Asia Pacific Magnetic Resonance Imaging Market in US Volume Share (%), by Architecture 2024 & 2032
- Figure 75: Asia Pacific Magnetic Resonance Imaging Market in US Revenue (Million), by Field Strength 2024 & 2032
- Figure 76: Asia Pacific Magnetic Resonance Imaging Market in US Volume (Piece), by Field Strength 2024 & 2032
- Figure 77: Asia Pacific Magnetic Resonance Imaging Market in US Revenue Share (%), by Field Strength 2024 & 2032
- Figure 78: Asia Pacific Magnetic Resonance Imaging Market in US Volume Share (%), by Field Strength 2024 & 2032
- Figure 79: Asia Pacific Magnetic Resonance Imaging Market in US Revenue (Million), by Application 2024 & 2032
- Figure 80: Asia Pacific Magnetic Resonance Imaging Market in US Volume (Piece), by Application 2024 & 2032
- Figure 81: Asia Pacific Magnetic Resonance Imaging Market in US Revenue Share (%), by Application 2024 & 2032
- Figure 82: Asia Pacific Magnetic Resonance Imaging Market in US Volume Share (%), by Application 2024 & 2032
- Figure 83: Asia Pacific Magnetic Resonance Imaging Market in US Revenue (Million), by Country 2024 & 2032
- Figure 84: Asia Pacific Magnetic Resonance Imaging Market in US Volume (Piece), by Country 2024 & 2032
- Figure 85: Asia Pacific Magnetic Resonance Imaging Market in US Revenue Share (%), by Country 2024 & 2032
- Figure 86: Asia Pacific Magnetic Resonance Imaging Market in US Volume Share (%), by Country 2024 & 2032
List of Tables
- Table 1: Global Magnetic Resonance Imaging Market in US Revenue Million Forecast, by Region 2019 & 2032
- Table 2: Global Magnetic Resonance Imaging Market in US Volume Piece Forecast, by Region 2019 & 2032
- Table 3: Global Magnetic Resonance Imaging Market in US Revenue Million Forecast, by Architecture 2019 & 2032
- Table 4: Global Magnetic Resonance Imaging Market in US Volume Piece Forecast, by Architecture 2019 & 2032
- Table 5: Global Magnetic Resonance Imaging Market in US Revenue Million Forecast, by Field Strength 2019 & 2032
- Table 6: Global Magnetic Resonance Imaging Market in US Volume Piece Forecast, by Field Strength 2019 & 2032
- Table 7: Global Magnetic Resonance Imaging Market in US Revenue Million Forecast, by Application 2019 & 2032
- Table 8: Global Magnetic Resonance Imaging Market in US Volume Piece Forecast, by Application 2019 & 2032
- Table 9: Global Magnetic Resonance Imaging Market in US Revenue Million Forecast, by Region 2019 & 2032
- Table 10: Global Magnetic Resonance Imaging Market in US Volume Piece Forecast, by Region 2019 & 2032
- Table 11: Global Magnetic Resonance Imaging Market in US Revenue Million Forecast, by Country 2019 & 2032
- Table 12: Global Magnetic Resonance Imaging Market in US Volume Piece Forecast, by Country 2019 & 2032
- Table 13: Northeast Magnetic Resonance Imaging Market in US Revenue (Million) Forecast, by Application 2019 & 2032
- Table 14: Northeast Magnetic Resonance Imaging Market in US Volume (Piece) Forecast, by Application 2019 & 2032
- Table 15: Southeast Magnetic Resonance Imaging Market in US Revenue (Million) Forecast, by Application 2019 & 2032
- Table 16: Southeast Magnetic Resonance Imaging Market in US Volume (Piece) Forecast, by Application 2019 & 2032
- Table 17: Midwest Magnetic Resonance Imaging Market in US Revenue (Million) Forecast, by Application 2019 & 2032
- Table 18: Midwest Magnetic Resonance Imaging Market in US Volume (Piece) Forecast, by Application 2019 & 2032
- Table 19: Southwest Magnetic Resonance Imaging Market in US Revenue (Million) Forecast, by Application 2019 & 2032
- Table 20: Southwest Magnetic Resonance Imaging Market in US Volume (Piece) Forecast, by Application 2019 & 2032
- Table 21: West Magnetic Resonance Imaging Market in US Revenue (Million) Forecast, by Application 2019 & 2032
- Table 22: West Magnetic Resonance Imaging Market in US Volume (Piece) Forecast, by Application 2019 & 2032
- Table 23: Global Magnetic Resonance Imaging Market in US Revenue Million Forecast, by Architecture 2019 & 2032
- Table 24: Global Magnetic Resonance Imaging Market in US Volume Piece Forecast, by Architecture 2019 & 2032
- Table 25: Global Magnetic Resonance Imaging Market in US Revenue Million Forecast, by Field Strength 2019 & 2032
- Table 26: Global Magnetic Resonance Imaging Market in US Volume Piece Forecast, by Field Strength 2019 & 2032
- Table 27: Global Magnetic Resonance Imaging Market in US Revenue Million Forecast, by Application 2019 & 2032
- Table 28: Global Magnetic Resonance Imaging Market in US Volume Piece Forecast, by Application 2019 & 2032
- Table 29: Global Magnetic Resonance Imaging Market in US Revenue Million Forecast, by Country 2019 & 2032
- Table 30: Global Magnetic Resonance Imaging Market in US Volume Piece Forecast, by Country 2019 & 2032
- Table 31: United States Magnetic Resonance Imaging Market in US Revenue (Million) Forecast, by Application 2019 & 2032
- Table 32: United States Magnetic Resonance Imaging Market in US Volume (Piece) Forecast, by Application 2019 & 2032
- Table 33: Canada Magnetic Resonance Imaging Market in US Revenue (Million) Forecast, by Application 2019 & 2032
- Table 34: Canada Magnetic Resonance Imaging Market in US Volume (Piece) Forecast, by Application 2019 & 2032
- Table 35: Mexico Magnetic Resonance Imaging Market in US Revenue (Million) Forecast, by Application 2019 & 2032
- Table 36: Mexico Magnetic Resonance Imaging Market in US Volume (Piece) Forecast, by Application 2019 & 2032
- Table 37: Global Magnetic Resonance Imaging Market in US Revenue Million Forecast, by Architecture 2019 & 2032
- Table 38: Global Magnetic Resonance Imaging Market in US Volume Piece Forecast, by Architecture 2019 & 2032
- Table 39: Global Magnetic Resonance Imaging Market in US Revenue Million Forecast, by Field Strength 2019 & 2032
- Table 40: Global Magnetic Resonance Imaging Market in US Volume Piece Forecast, by Field Strength 2019 & 2032
- Table 41: Global Magnetic Resonance Imaging Market in US Revenue Million Forecast, by Application 2019 & 2032
- Table 42: Global Magnetic Resonance Imaging Market in US Volume Piece Forecast, by Application 2019 & 2032
- Table 43: Global Magnetic Resonance Imaging Market in US Revenue Million Forecast, by Country 2019 & 2032
- Table 44: Global Magnetic Resonance Imaging Market in US Volume Piece Forecast, by Country 2019 & 2032
- Table 45: Brazil Magnetic Resonance Imaging Market in US Revenue (Million) Forecast, by Application 2019 & 2032
- Table 46: Brazil Magnetic Resonance Imaging Market in US Volume (Piece) Forecast, by Application 2019 & 2032
- Table 47: Argentina Magnetic Resonance Imaging Market in US Revenue (Million) Forecast, by Application 2019 & 2032
- Table 48: Argentina Magnetic Resonance Imaging Market in US Volume (Piece) Forecast, by Application 2019 & 2032
- Table 49: Rest of South America Magnetic Resonance Imaging Market in US Revenue (Million) Forecast, by Application 2019 & 2032
- Table 50: Rest of South America Magnetic Resonance Imaging Market in US Volume (Piece) Forecast, by Application 2019 & 2032
- Table 51: Global Magnetic Resonance Imaging Market in US Revenue Million Forecast, by Architecture 2019 & 2032
- Table 52: Global Magnetic Resonance Imaging Market in US Volume Piece Forecast, by Architecture 2019 & 2032
- Table 53: Global Magnetic Resonance Imaging Market in US Revenue Million Forecast, by Field Strength 2019 & 2032
- Table 54: Global Magnetic Resonance Imaging Market in US Volume Piece Forecast, by Field Strength 2019 & 2032
- Table 55: Global Magnetic Resonance Imaging Market in US Revenue Million Forecast, by Application 2019 & 2032
- Table 56: Global Magnetic Resonance Imaging Market in US Volume Piece Forecast, by Application 2019 & 2032
- Table 57: Global Magnetic Resonance Imaging Market in US Revenue Million Forecast, by Country 2019 & 2032
- Table 58: Global Magnetic Resonance Imaging Market in US Volume Piece Forecast, by Country 2019 & 2032
- Table 59: United Kingdom Magnetic Resonance Imaging Market in US Revenue (Million) Forecast, by Application 2019 & 2032
- Table 60: United Kingdom Magnetic Resonance Imaging Market in US Volume (Piece) Forecast, by Application 2019 & 2032
- Table 61: Germany Magnetic Resonance Imaging Market in US Revenue (Million) Forecast, by Application 2019 & 2032
- Table 62: Germany Magnetic Resonance Imaging Market in US Volume (Piece) Forecast, by Application 2019 & 2032
- Table 63: France Magnetic Resonance Imaging Market in US Revenue (Million) Forecast, by Application 2019 & 2032
- Table 64: France Magnetic Resonance Imaging Market in US Volume (Piece) Forecast, by Application 2019 & 2032
- Table 65: Italy Magnetic Resonance Imaging Market in US Revenue (Million) Forecast, by Application 2019 & 2032
- Table 66: Italy Magnetic Resonance Imaging Market in US Volume (Piece) Forecast, by Application 2019 & 2032
- Table 67: Spain Magnetic Resonance Imaging Market in US Revenue (Million) Forecast, by Application 2019 & 2032
- Table 68: Spain Magnetic Resonance Imaging Market in US Volume (Piece) Forecast, by Application 2019 & 2032
- Table 69: Russia Magnetic Resonance Imaging Market in US Revenue (Million) Forecast, by Application 2019 & 2032
- Table 70: Russia Magnetic Resonance Imaging Market in US Volume (Piece) Forecast, by Application 2019 & 2032
- Table 71: Benelux Magnetic Resonance Imaging Market in US Revenue (Million) Forecast, by Application 2019 & 2032
- Table 72: Benelux Magnetic Resonance Imaging Market in US Volume (Piece) Forecast, by Application 2019 & 2032
- Table 73: Nordics Magnetic Resonance Imaging Market in US Revenue (Million) Forecast, by Application 2019 & 2032
- Table 74: Nordics Magnetic Resonance Imaging Market in US Volume (Piece) Forecast, by Application 2019 & 2032
- Table 75: Rest of Europe Magnetic Resonance Imaging Market in US Revenue (Million) Forecast, by Application 2019 & 2032
- Table 76: Rest of Europe Magnetic Resonance Imaging Market in US Volume (Piece) Forecast, by Application 2019 & 2032
- Table 77: Global Magnetic Resonance Imaging Market in US Revenue Million Forecast, by Architecture 2019 & 2032
- Table 78: Global Magnetic Resonance Imaging Market in US Volume Piece Forecast, by Architecture 2019 & 2032
- Table 79: Global Magnetic Resonance Imaging Market in US Revenue Million Forecast, by Field Strength 2019 & 2032
- Table 80: Global Magnetic Resonance Imaging Market in US Volume Piece Forecast, by Field Strength 2019 & 2032
- Table 81: Global Magnetic Resonance Imaging Market in US Revenue Million Forecast, by Application 2019 & 2032
- Table 82: Global Magnetic Resonance Imaging Market in US Volume Piece Forecast, by Application 2019 & 2032
- Table 83: Global Magnetic Resonance Imaging Market in US Revenue Million Forecast, by Country 2019 & 2032
- Table 84: Global Magnetic Resonance Imaging Market in US Volume Piece Forecast, by Country 2019 & 2032
- Table 85: Turkey Magnetic Resonance Imaging Market in US Revenue (Million) Forecast, by Application 2019 & 2032
- Table 86: Turkey Magnetic Resonance Imaging Market in US Volume (Piece) Forecast, by Application 2019 & 2032
- Table 87: Israel Magnetic Resonance Imaging Market in US Revenue (Million) Forecast, by Application 2019 & 2032
- Table 88: Israel Magnetic Resonance Imaging Market in US Volume (Piece) Forecast, by Application 2019 & 2032
- Table 89: GCC Magnetic Resonance Imaging Market in US Revenue (Million) Forecast, by Application 2019 & 2032
- Table 90: GCC Magnetic Resonance Imaging Market in US Volume (Piece) Forecast, by Application 2019 & 2032
- Table 91: North Africa Magnetic Resonance Imaging Market in US Revenue (Million) Forecast, by Application 2019 & 2032
- Table 92: North Africa Magnetic Resonance Imaging Market in US Volume (Piece) Forecast, by Application 2019 & 2032
- Table 93: South Africa Magnetic Resonance Imaging Market in US Revenue (Million) Forecast, by Application 2019 & 2032
- Table 94: South Africa Magnetic Resonance Imaging Market in US Volume (Piece) Forecast, by Application 2019 & 2032
- Table 95: Rest of Middle East & Africa Magnetic Resonance Imaging Market in US Revenue (Million) Forecast, by Application 2019 & 2032
- Table 96: Rest of Middle East & Africa Magnetic Resonance Imaging Market in US Volume (Piece) Forecast, by Application 2019 & 2032
- Table 97: Global Magnetic Resonance Imaging Market in US Revenue Million Forecast, by Architecture 2019 & 2032
- Table 98: Global Magnetic Resonance Imaging Market in US Volume Piece Forecast, by Architecture 2019 & 2032
- Table 99: Global Magnetic Resonance Imaging Market in US Revenue Million Forecast, by Field Strength 2019 & 2032
- Table 100: Global Magnetic Resonance Imaging Market in US Volume Piece Forecast, by Field Strength 2019 & 2032
- Table 101: Global Magnetic Resonance Imaging Market in US Revenue Million Forecast, by Application 2019 & 2032
- Table 102: Global Magnetic Resonance Imaging Market in US Volume Piece Forecast, by Application 2019 & 2032
- Table 103: Global Magnetic Resonance Imaging Market in US Revenue Million Forecast, by Country 2019 & 2032
- Table 104: Global Magnetic Resonance Imaging Market in US Volume Piece Forecast, by Country 2019 & 2032
- Table 105: China Magnetic Resonance Imaging Market in US Revenue (Million) Forecast, by Application 2019 & 2032
- Table 106: China Magnetic Resonance Imaging Market in US Volume (Piece) Forecast, by Application 2019 & 2032
- Table 107: India Magnetic Resonance Imaging Market in US Revenue (Million) Forecast, by Application 2019 & 2032
- Table 108: India Magnetic Resonance Imaging Market in US Volume (Piece) Forecast, by Application 2019 & 2032
- Table 109: Japan Magnetic Resonance Imaging Market in US Revenue (Million) Forecast, by Application 2019 & 2032
- Table 110: Japan Magnetic Resonance Imaging Market in US Volume (Piece) Forecast, by Application 2019 & 2032
- Table 111: South Korea Magnetic Resonance Imaging Market in US Revenue (Million) Forecast, by Application 2019 & 2032
- Table 112: South Korea Magnetic Resonance Imaging Market in US Volume (Piece) Forecast, by Application 2019 & 2032
- Table 113: ASEAN Magnetic Resonance Imaging Market in US Revenue (Million) Forecast, by Application 2019 & 2032
- Table 114: ASEAN Magnetic Resonance Imaging Market in US Volume (Piece) Forecast, by Application 2019 & 2032
- Table 115: Oceania Magnetic Resonance Imaging Market in US Revenue (Million) Forecast, by Application 2019 & 2032
- Table 116: Oceania Magnetic Resonance Imaging Market in US Volume (Piece) Forecast, by Application 2019 & 2032
- Table 117: Rest of Asia Pacific Magnetic Resonance Imaging Market in US Revenue (Million) Forecast, by Application 2019 & 2032
- Table 118: Rest of Asia Pacific Magnetic Resonance Imaging Market in US Volume (Piece) Forecast, by Application 2019 & 2032
Frequently Asked Questions
1. What is the projected Compound Annual Growth Rate (CAGR) of the Magnetic Resonance Imaging Market in US?
The projected CAGR is approximately 5.95%.
2. Which companies are prominent players in the Magnetic Resonance Imaging Market in US?
Key companies in the market include Siemens Healthcare GmbH, Fonar Corporation*List Not Exhaustive, Canon Inc (Canon Medical Systems Corporation), Shenzhen Anke High-tech Co Ltd, Esaote SpA, Aurora Imaging Technology, Koninklijke Philips N V, GE HealthCare, Neusoft Medical Systems Co Ltd, Fujifilm Holdings Corporation.
3. What are the main segments of the Magnetic Resonance Imaging Market in US?
The market segments include Architecture, Field Strength, Application.
4. Can you provide details about the market size?
The market size is estimated to be USD 3.42 Million as of 2022.
5. What are some drivers contributing to market growth?
Growing Burden of Chronic Diseases; Advancements in MRI Systems and Availability of Universal Health Coverage.
6. What are the notable trends driving market growth?
Neurology Segment is Expected to Witness Significant Growth Over the Forecast Period.
7. Are there any restraints impacting market growth?
High Cost of MRI Systems.
8. Can you provide examples of recent developments in the market?
June 2023: GE HealthCare launched its FDA-cleared Sonic DL, a state-of-the-art deep learning-based technology designed to dramatically accelerate image acquisition in magnetic resonance imaging (MRI). Sonic DL enables new imaging paradigms, such as high-quality cardiac MRI in a single heartbeat.
9. What pricing options are available for accessing the report?
Pricing options include single-user, multi-user, and enterprise licenses priced at USD 3800, USD 4500, and USD 5800 respectively.
10. Is the market size provided in terms of value or volume?
The market size is provided in terms of value, measured in Million and volume, measured in Piece.
11. Are there any specific market keywords associated with the report?
Yes, the market keyword associated with the report is "Magnetic Resonance Imaging Market in US," which aids in identifying and referencing the specific market segment covered.
12. How do I determine which pricing option suits my needs best?
The pricing options vary based on user requirements and access needs. Individual users may opt for single-user licenses, while businesses requiring broader access may choose multi-user or enterprise licenses for cost-effective access to the report.
13. Are there any additional resources or data provided in the Magnetic Resonance Imaging Market in US report?
While the report offers comprehensive insights, it's advisable to review the specific contents or supplementary materials provided to ascertain if additional resources or data are available.
14. How can I stay updated on further developments or reports in the Magnetic Resonance Imaging Market in US?
To stay informed about further developments, trends, and reports in the Magnetic Resonance Imaging Market in US, consider subscribing to industry newsletters, following relevant companies and organizations, or regularly checking reputable industry news sources and publications.
Methodology
Step 1 - Identification of Relevant Samples Size from Population Database


Step 2 - Approaches for Defining Global Market Size (Value, Volume* & Price*)

Note*: In applicable scenarios
Step 3 - Data Sources
Primary Research
- Web Analytics
- Survey Reports
- Research Institute
- Latest Research Reports
- Opinion Leaders
Secondary Research
- Annual Reports
- White Paper
- Latest Press Release
- Industry Association
- Paid Database
- Investor Presentations

Step 4 - Data Triangulation
Involves using different sources of information in order to increase the validity of a study
These sources are likely to be stakeholders in a program - participants, other researchers, program staff, other community members, and so on.
Then we put all data in single framework & apply various statistical tools to find out the dynamic on the market.
During the analysis stage, feedback from the stakeholder groups would be compared to determine areas of agreement as well as areas of divergence


