
Key Insights
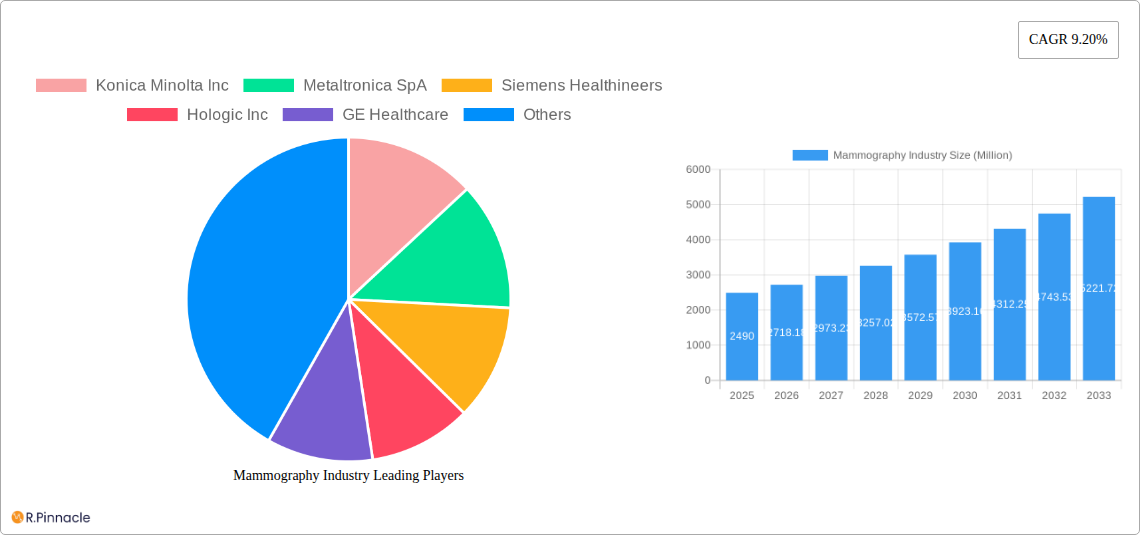
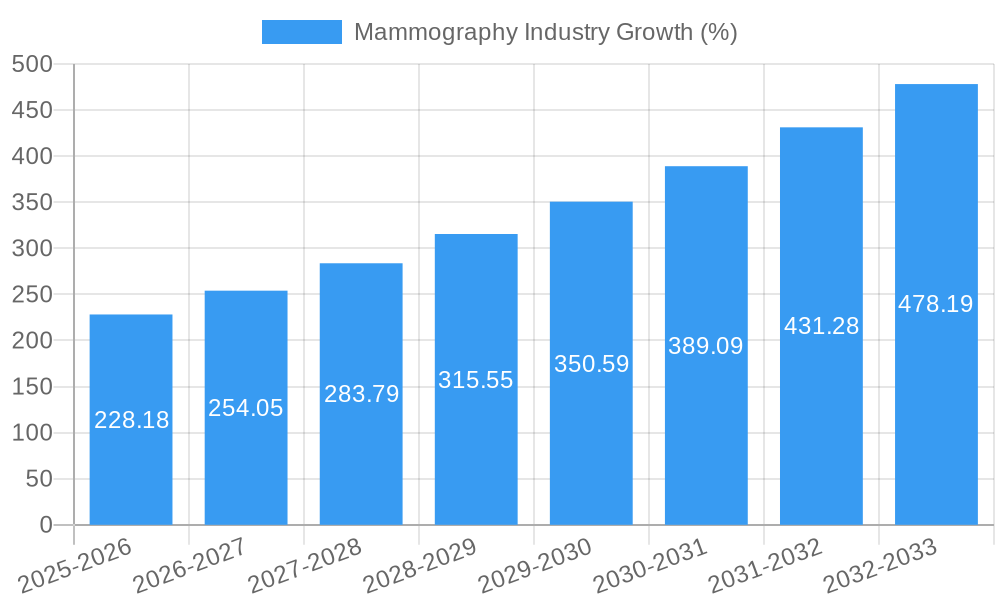
The mammography market, valued at $2.49 billion in 2025, is projected to experience robust growth, driven by a compound annual growth rate (CAGR) of 9.20% from 2025 to 2033. This expansion is fueled by several key factors. Increasing prevalence of breast cancer globally necessitates more frequent screenings, boosting demand for mammography systems. Technological advancements, such as digital mammography and breast tomosynthesis, offer improved image quality, reduced radiation exposure, and enhanced diagnostic capabilities, further stimulating market growth. The rising geriatric population, a key demographic at higher risk for breast cancer, also contributes significantly to market expansion. Furthermore, the increasing adoption of advanced imaging techniques in hospitals, specialty clinics, and diagnostic centers is a primary driver of market growth across all regions. The market is segmented by product type (digital, analog, tomosynthesis, and others) and end-users (hospitals, specialty clinics, and diagnostic centers), with digital systems currently dominating due to their superior image quality and efficiency.
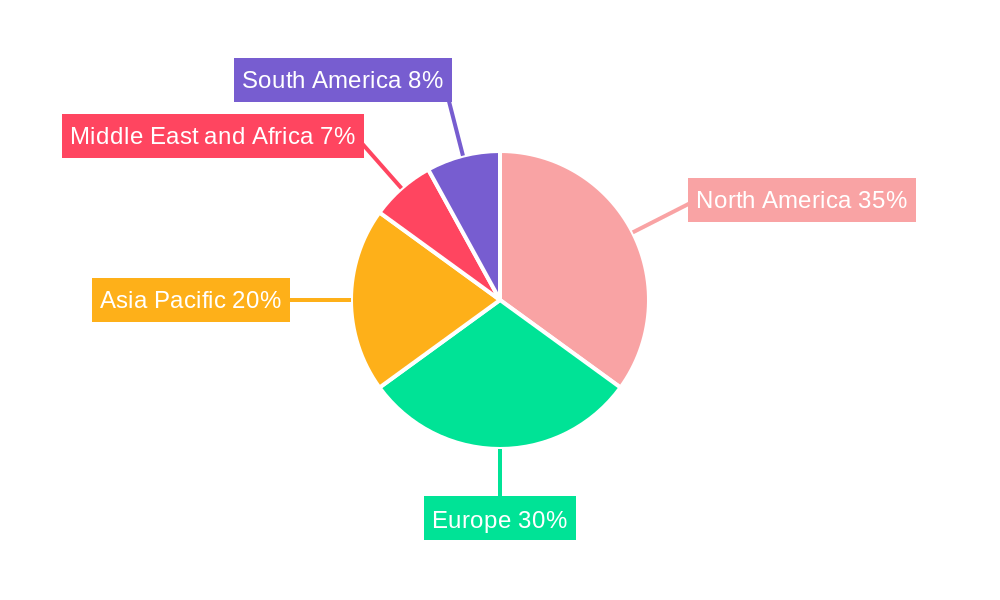
While the market presents significant opportunities, challenges remain. High initial investment costs associated with advanced mammography systems can be a barrier to entry for smaller clinics and healthcare facilities in developing nations. Furthermore, regulatory hurdles and reimbursement policies in different regions can impact market penetration. However, ongoing technological innovations, coupled with increasing government initiatives promoting early breast cancer detection, are expected to mitigate these restraints. The market is geographically diverse, with North America and Europe currently holding significant market shares due to advanced healthcare infrastructure and high awareness of breast cancer screening. However, rapidly developing economies in Asia Pacific and other regions are expected to witness significant growth in the coming years driven by rising disposable incomes and improved healthcare infrastructure. The competitive landscape includes established players like GE Healthcare, Hologic, and Siemens Healthineers, alongside emerging companies offering innovative technologies.
Mammography Industry Market Report: 2019-2033
This comprehensive report provides a detailed analysis of the global mammography industry, offering invaluable insights for industry professionals, investors, and strategic decision-makers. With a study period spanning 2019-2033, a base year of 2025, and a forecast period of 2025-2033, this report leverages extensive data analysis and expert insights to present a clear picture of the current market landscape and its future trajectory. The report covers market size, segmentation, key players, growth drivers, challenges, and emerging opportunities within the mammography industry. The total market size is projected to reach xx Million by 2033.
Mammography Industry Market Structure & Innovation Trends
The global mammography market exhibits a moderately concentrated structure, with key players such as Hologic Inc, Siemens Healthineers, and Fujifilm Holdings Corporation holding significant market share. The combined market share of the top five players is estimated at xx%. Innovation is driven by advancements in digital mammography, breast tomosynthesis, and AI-powered image analysis. Regulatory frameworks, such as FDA approvals and CE markings, play a crucial role in shaping market dynamics. Product substitutes, such as ultrasound and MRI, present competitive challenges, while the aging population and increasing breast cancer awareness fuel market growth. M&A activity in the sector has been moderate, with deal values averaging around xx Million in recent years. Notable examples include [Insert specific examples of M&A deals if available, otherwise omit].
- Market Concentration: Moderately concentrated, top 5 players hold xx% market share.
- Innovation Drivers: Digital mammography, tomosynthesis, AI-powered image analysis.
- Regulatory Landscape: FDA approvals, CE markings.
- Product Substitutes: Ultrasound, MRI.
- End-User Demographics: Aging population, increasing breast cancer awareness.
- M&A Activity: Moderate, average deal value around xx Million.
Mammography Industry Market Dynamics & Trends
The global mammography market is experiencing robust growth, driven by several key factors. The increasing prevalence of breast cancer, coupled with rising awareness and screening rates, is a primary driver. Technological advancements, particularly in digital mammography and tomosynthesis, are enhancing diagnostic capabilities and improving patient outcomes. The integration of AI and machine learning is further revolutionizing image analysis, leading to improved accuracy and efficiency. Consumer preferences are shifting towards minimally invasive procedures and personalized breast care. Competitive dynamics are characterized by ongoing innovation, strategic partnerships, and a focus on expanding geographic reach. The market is expected to exhibit a CAGR of xx% during the forecast period (2025-2033), with market penetration steadily increasing across various regions. Specific growth factors include technological advancements, increased screening rates, and favorable reimbursement policies in various countries. The market is characterized by a combination of organic growth and acquisitions that improve market penetration.
Dominant Regions & Segments in Mammography Industry
North America currently dominates the global mammography market, driven by high healthcare expenditure, advanced healthcare infrastructure, and a relatively high prevalence of breast cancer. Within product types, digital mammography systems hold the largest market share, reflecting the widespread adoption of digital technology in healthcare. Breast tomosynthesis is experiencing rapid growth, driven by its superior diagnostic capabilities. Among end-users, hospitals are the largest segment, owing to their comprehensive diagnostic services and patient volume.
- Key Drivers for North American Dominance: High healthcare expenditure, advanced infrastructure, high breast cancer prevalence.
- Digital Mammography: Largest market share due to widespread technology adoption.
- Breast Tomosynthesis: Rapid growth driven by superior diagnostic capabilities.
- Hospitals: Largest end-user segment due to comprehensive services and high patient volume.
- Other Factors: Favorable reimbursement policies, presence of major players.
Mammography Industry Product Innovations
Recent innovations in mammography technology have focused on improving image quality, reducing radiation exposure, and enhancing diagnostic accuracy. This includes advancements in digital mammography detectors, tomosynthesis systems, and AI-powered image analysis software. These innovations are designed to improve workflow efficiency, reduce costs, and provide more personalized breast care. The market is witnessing increased adoption of AI-driven solutions for automated detection, improving the speed and accuracy of diagnosis.
Report Scope & Segmentation Analysis
This report segments the mammography market by product type (digital systems, analog systems, breast tomosynthesis, other product types) and end-user (hospitals, specialty clinics, diagnostic centers). Each segment's growth projections, market size, and competitive dynamics are analyzed in detail. For example, the digital mammography systems segment is expected to show steady growth due to its advantages in image quality and workflow efficiency. The analog systems segment is expected to see limited growth while breast tomosynthesis and other product types are expected to show faster growth as they continue to gain traction in the market. The hospital segment shows the highest market size in the end user sector.
Key Drivers of Mammography Industry Growth
Several factors contribute to the growth of the mammography industry. Technological advancements, like AI-powered image analysis, improve diagnostic accuracy and efficiency. Rising breast cancer prevalence globally fuels increased screening demand. Favorable reimbursement policies and government initiatives supporting early detection also drive market expansion. Furthermore, the growing awareness of breast cancer among women increases the demand for mammography services.
Challenges in the Mammography Industry Sector
The mammography industry faces challenges such as high equipment costs, the need for skilled technicians, and regulatory complexities. Supply chain disruptions can impact the availability of components and equipment, influencing market growth. Intense competition among manufacturers puts pressure on pricing and margins. The potential for reimbursement cuts could also hinder industry growth. The industry faces a shortage of trained professionals which restricts the market growth rate.
Emerging Opportunities in Mammography Industry
The industry presents promising opportunities in developing markets with rising healthcare spending. Advancements in AI and machine learning are improving image analysis and early detection capabilities, creating new market segments. Personalized breast care solutions tailored to individual risk profiles offer significant growth potential. Furthermore, the development of more comfortable and efficient screening technologies is expected to increase adoption rates and improve patient experience.
Leading Players in the Mammography Industry Market
- Konica Minolta Inc
- Metaltronica SpA
- Siemens Healthineers
- Hologic Inc
- GE Healthcare
- Carestream Health
- Koninklijke Philips NV
- General Medical Merate SpA
- Planmed Oy
- Fujifilm Holdings Corporation
- Canon Medical Systems
Key Developments in Mammography Industry
- May 2022: Volpara Health launched updated products for personalized breast care at the SBI/ACR Breast Imaging Symposium 2022, focusing on AI-driven software for mammography quality, density measurement, and cancer risk assessment.
- January 2022: ScreenPoint Medical expanded its presence in the US and 30 countries with the launch of Transpara, an AI breast care system.
Future Outlook for Mammography Industry Market
The mammography market is poised for continued growth, driven by technological advancements, rising awareness, and increasing demand for early detection. Strategic partnerships, acquisitions, and expansion into emerging markets will shape the industry's future. Focus on AI integration, personalized medicine, and improved patient experience will be key factors driving market expansion and creating significant business opportunities in the coming years.
Mammography Industry Segmentation
-
1. Product Type
- 1.1. Digital Systems
- 1.2. Analog Systems
- 1.3. Breast Tomosynthesis
- 1.4. Other Product Types
-
2. End Users
- 2.1. Hospitals
- 2.2. Specialty Clinics
- 2.3. Diagnostic Centers
Mammography Industry Segmentation By Geography
-
1. North America
- 1.1. United States
- 1.2. Canada
- 1.3. Mexico
-
2. Europe
- 2.1. Germany
- 2.2. United Kingdom
- 2.3. France
- 2.4. Italy
- 2.5. Spain
- 2.6. Rest of Europe
-
3. Asia Pacific
- 3.1. China
- 3.2. Japan
- 3.3. India
- 3.4. Australia
- 3.5. South Korea
- 3.6. Rest of Asia Pacific
-
4. Middle East and Africa
- 4.1. GCC
- 4.2. South Africa
- 4.3. Rest of Middle East and Africa
-
5. South America
- 5.1. Brazil
- 5.2. Argentina
- 5.3. Rest of South America
Mammography Industry REPORT HIGHLIGHTS
| Aspects | Details |
|---|---|
| Study Period | 2019-2033 |
| Base Year | 2024 |
| Estimated Year | 2025 |
| Forecast Period | 2025-2033 |
| Historical Period | 2019-2024 |
| Growth Rate | CAGR of 9.20% from 2019-2033 |
| Segmentation |
|
Table of Contents
- 1. Introduction
- 1.1. Research Scope
- 1.2. Market Segmentation
- 1.3. Research Methodology
- 1.4. Definitions and Assumptions
- 2. Executive Summary
- 2.1. Introduction
- 3. Market Dynamics
- 3.1. Introduction
- 3.2. Market Drivers
- 3.2.1. Growing Burden of Breast Cancer; Technological Advancements in the Field of Breast Imaging; Investment from Various Organizations in Breast Cancer Screening Campaigns
- 3.3. Market Restrains
- 3.3.1. Risk of Adverse Effects from Radiation Exposure; Reduction in Reimbursement
- 3.4. Market Trends
- 3.4.1. The Digital Mammography Segment is Expected to Account for the Large Market Share During the Forecast Period
- 4. Market Factor Analysis
- 4.1. Porters Five Forces
- 4.2. Supply/Value Chain
- 4.3. PESTEL analysis
- 4.4. Market Entropy
- 4.5. Patent/Trademark Analysis
- 5. Global Mammography Industry Analysis, Insights and Forecast, 2019-2031
- 5.1. Market Analysis, Insights and Forecast - by Product Type
- 5.1.1. Digital Systems
- 5.1.2. Analog Systems
- 5.1.3. Breast Tomosynthesis
- 5.1.4. Other Product Types
- 5.2. Market Analysis, Insights and Forecast - by End Users
- 5.2.1. Hospitals
- 5.2.2. Specialty Clinics
- 5.2.3. Diagnostic Centers
- 5.3. Market Analysis, Insights and Forecast - by Region
- 5.3.1. North America
- 5.3.2. Europe
- 5.3.3. Asia Pacific
- 5.3.4. Middle East and Africa
- 5.3.5. South America
- 5.1. Market Analysis, Insights and Forecast - by Product Type
- 6. North America Mammography Industry Analysis, Insights and Forecast, 2019-2031
- 6.1. Market Analysis, Insights and Forecast - by Product Type
- 6.1.1. Digital Systems
- 6.1.2. Analog Systems
- 6.1.3. Breast Tomosynthesis
- 6.1.4. Other Product Types
- 6.2. Market Analysis, Insights and Forecast - by End Users
- 6.2.1. Hospitals
- 6.2.2. Specialty Clinics
- 6.2.3. Diagnostic Centers
- 6.1. Market Analysis, Insights and Forecast - by Product Type
- 7. Europe Mammography Industry Analysis, Insights and Forecast, 2019-2031
- 7.1. Market Analysis, Insights and Forecast - by Product Type
- 7.1.1. Digital Systems
- 7.1.2. Analog Systems
- 7.1.3. Breast Tomosynthesis
- 7.1.4. Other Product Types
- 7.2. Market Analysis, Insights and Forecast - by End Users
- 7.2.1. Hospitals
- 7.2.2. Specialty Clinics
- 7.2.3. Diagnostic Centers
- 7.1. Market Analysis, Insights and Forecast - by Product Type
- 8. Asia Pacific Mammography Industry Analysis, Insights and Forecast, 2019-2031
- 8.1. Market Analysis, Insights and Forecast - by Product Type
- 8.1.1. Digital Systems
- 8.1.2. Analog Systems
- 8.1.3. Breast Tomosynthesis
- 8.1.4. Other Product Types
- 8.2. Market Analysis, Insights and Forecast - by End Users
- 8.2.1. Hospitals
- 8.2.2. Specialty Clinics
- 8.2.3. Diagnostic Centers
- 8.1. Market Analysis, Insights and Forecast - by Product Type
- 9. Middle East and Africa Mammography Industry Analysis, Insights and Forecast, 2019-2031
- 9.1. Market Analysis, Insights and Forecast - by Product Type
- 9.1.1. Digital Systems
- 9.1.2. Analog Systems
- 9.1.3. Breast Tomosynthesis
- 9.1.4. Other Product Types
- 9.2. Market Analysis, Insights and Forecast - by End Users
- 9.2.1. Hospitals
- 9.2.2. Specialty Clinics
- 9.2.3. Diagnostic Centers
- 9.1. Market Analysis, Insights and Forecast - by Product Type
- 10. South America Mammography Industry Analysis, Insights and Forecast, 2019-2031
- 10.1. Market Analysis, Insights and Forecast - by Product Type
- 10.1.1. Digital Systems
- 10.1.2. Analog Systems
- 10.1.3. Breast Tomosynthesis
- 10.1.4. Other Product Types
- 10.2. Market Analysis, Insights and Forecast - by End Users
- 10.2.1. Hospitals
- 10.2.2. Specialty Clinics
- 10.2.3. Diagnostic Centers
- 10.1. Market Analysis, Insights and Forecast - by Product Type
- 11. North America Mammography Industry Analysis, Insights and Forecast, 2019-2031
- 11.1. Market Analysis, Insights and Forecast - By Country/Sub-region
- 11.1.1 United States
- 11.1.2 Canada
- 11.1.3 Mexico
- 12. Europe Mammography Industry Analysis, Insights and Forecast, 2019-2031
- 12.1. Market Analysis, Insights and Forecast - By Country/Sub-region
- 12.1.1 Germany
- 12.1.2 United Kingdom
- 12.1.3 France
- 12.1.4 Italy
- 12.1.5 Spain
- 12.1.6 Rest of Europe
- 13. Asia Pacific Mammography Industry Analysis, Insights and Forecast, 2019-2031
- 13.1. Market Analysis, Insights and Forecast - By Country/Sub-region
- 13.1.1 China
- 13.1.2 Japan
- 13.1.3 India
- 13.1.4 Australia
- 13.1.5 South Korea
- 13.1.6 Rest of Asia Pacific
- 14. Middle East and Africa Mammography Industry Analysis, Insights and Forecast, 2019-2031
- 14.1. Market Analysis, Insights and Forecast - By Country/Sub-region
- 14.1.1 GCC
- 14.1.2 South Africa
- 14.1.3 Rest of Middle East and Africa
- 15. South America Mammography Industry Analysis, Insights and Forecast, 2019-2031
- 15.1. Market Analysis, Insights and Forecast - By Country/Sub-region
- 15.1.1 Brazil
- 15.1.2 Argentina
- 15.1.3 Rest of South America
- 16. Competitive Analysis
- 16.1. Global Market Share Analysis 2024
- 16.2. Company Profiles
- 16.2.1 Konica Minolta Inc
- 16.2.1.1. Overview
- 16.2.1.2. Products
- 16.2.1.3. SWOT Analysis
- 16.2.1.4. Recent Developments
- 16.2.1.5. Financials (Based on Availability)
- 16.2.2 Metaltronica SpA
- 16.2.2.1. Overview
- 16.2.2.2. Products
- 16.2.2.3. SWOT Analysis
- 16.2.2.4. Recent Developments
- 16.2.2.5. Financials (Based on Availability)
- 16.2.3 Siemens Healthineers
- 16.2.3.1. Overview
- 16.2.3.2. Products
- 16.2.3.3. SWOT Analysis
- 16.2.3.4. Recent Developments
- 16.2.3.5. Financials (Based on Availability)
- 16.2.4 Hologic Inc
- 16.2.4.1. Overview
- 16.2.4.2. Products
- 16.2.4.3. SWOT Analysis
- 16.2.4.4. Recent Developments
- 16.2.4.5. Financials (Based on Availability)
- 16.2.5 GE Healthcare
- 16.2.5.1. Overview
- 16.2.5.2. Products
- 16.2.5.3. SWOT Analysis
- 16.2.5.4. Recent Developments
- 16.2.5.5. Financials (Based on Availability)
- 16.2.6 Carestream Health
- 16.2.6.1. Overview
- 16.2.6.2. Products
- 16.2.6.3. SWOT Analysis
- 16.2.6.4. Recent Developments
- 16.2.6.5. Financials (Based on Availability)
- 16.2.7 Koninklijke Philips NV
- 16.2.7.1. Overview
- 16.2.7.2. Products
- 16.2.7.3. SWOT Analysis
- 16.2.7.4. Recent Developments
- 16.2.7.5. Financials (Based on Availability)
- 16.2.8 General Medical Merate SpA
- 16.2.8.1. Overview
- 16.2.8.2. Products
- 16.2.8.3. SWOT Analysis
- 16.2.8.4. Recent Developments
- 16.2.8.5. Financials (Based on Availability)
- 16.2.9 Planmed Oy
- 16.2.9.1. Overview
- 16.2.9.2. Products
- 16.2.9.3. SWOT Analysis
- 16.2.9.4. Recent Developments
- 16.2.9.5. Financials (Based on Availability)
- 16.2.10 Fujifilm Holdings Corporation
- 16.2.10.1. Overview
- 16.2.10.2. Products
- 16.2.10.3. SWOT Analysis
- 16.2.10.4. Recent Developments
- 16.2.10.5. Financials (Based on Availability)
- 16.2.11 Canon Medical Systems
- 16.2.11.1. Overview
- 16.2.11.2. Products
- 16.2.11.3. SWOT Analysis
- 16.2.11.4. Recent Developments
- 16.2.11.5. Financials (Based on Availability)
- 16.2.1 Konica Minolta Inc
List of Figures
- Figure 1: Global Mammography Industry Revenue Breakdown (Million, %) by Region 2024 & 2032
- Figure 2: North America Mammography Industry Revenue (Million), by Country 2024 & 2032
- Figure 3: North America Mammography Industry Revenue Share (%), by Country 2024 & 2032
- Figure 4: Europe Mammography Industry Revenue (Million), by Country 2024 & 2032
- Figure 5: Europe Mammography Industry Revenue Share (%), by Country 2024 & 2032
- Figure 6: Asia Pacific Mammography Industry Revenue (Million), by Country 2024 & 2032
- Figure 7: Asia Pacific Mammography Industry Revenue Share (%), by Country 2024 & 2032
- Figure 8: Middle East and Africa Mammography Industry Revenue (Million), by Country 2024 & 2032
- Figure 9: Middle East and Africa Mammography Industry Revenue Share (%), by Country 2024 & 2032
- Figure 10: South America Mammography Industry Revenue (Million), by Country 2024 & 2032
- Figure 11: South America Mammography Industry Revenue Share (%), by Country 2024 & 2032
- Figure 12: North America Mammography Industry Revenue (Million), by Product Type 2024 & 2032
- Figure 13: North America Mammography Industry Revenue Share (%), by Product Type 2024 & 2032
- Figure 14: North America Mammography Industry Revenue (Million), by End Users 2024 & 2032
- Figure 15: North America Mammography Industry Revenue Share (%), by End Users 2024 & 2032
- Figure 16: North America Mammography Industry Revenue (Million), by Country 2024 & 2032
- Figure 17: North America Mammography Industry Revenue Share (%), by Country 2024 & 2032
- Figure 18: Europe Mammography Industry Revenue (Million), by Product Type 2024 & 2032
- Figure 19: Europe Mammography Industry Revenue Share (%), by Product Type 2024 & 2032
- Figure 20: Europe Mammography Industry Revenue (Million), by End Users 2024 & 2032
- Figure 21: Europe Mammography Industry Revenue Share (%), by End Users 2024 & 2032
- Figure 22: Europe Mammography Industry Revenue (Million), by Country 2024 & 2032
- Figure 23: Europe Mammography Industry Revenue Share (%), by Country 2024 & 2032
- Figure 24: Asia Pacific Mammography Industry Revenue (Million), by Product Type 2024 & 2032
- Figure 25: Asia Pacific Mammography Industry Revenue Share (%), by Product Type 2024 & 2032
- Figure 26: Asia Pacific Mammography Industry Revenue (Million), by End Users 2024 & 2032
- Figure 27: Asia Pacific Mammography Industry Revenue Share (%), by End Users 2024 & 2032
- Figure 28: Asia Pacific Mammography Industry Revenue (Million), by Country 2024 & 2032
- Figure 29: Asia Pacific Mammography Industry Revenue Share (%), by Country 2024 & 2032
- Figure 30: Middle East and Africa Mammography Industry Revenue (Million), by Product Type 2024 & 2032
- Figure 31: Middle East and Africa Mammography Industry Revenue Share (%), by Product Type 2024 & 2032
- Figure 32: Middle East and Africa Mammography Industry Revenue (Million), by End Users 2024 & 2032
- Figure 33: Middle East and Africa Mammography Industry Revenue Share (%), by End Users 2024 & 2032
- Figure 34: Middle East and Africa Mammography Industry Revenue (Million), by Country 2024 & 2032
- Figure 35: Middle East and Africa Mammography Industry Revenue Share (%), by Country 2024 & 2032
- Figure 36: South America Mammography Industry Revenue (Million), by Product Type 2024 & 2032
- Figure 37: South America Mammography Industry Revenue Share (%), by Product Type 2024 & 2032
- Figure 38: South America Mammography Industry Revenue (Million), by End Users 2024 & 2032
- Figure 39: South America Mammography Industry Revenue Share (%), by End Users 2024 & 2032
- Figure 40: South America Mammography Industry Revenue (Million), by Country 2024 & 2032
- Figure 41: South America Mammography Industry Revenue Share (%), by Country 2024 & 2032
List of Tables
- Table 1: Global Mammography Industry Revenue Million Forecast, by Region 2019 & 2032
- Table 2: Global Mammography Industry Revenue Million Forecast, by Product Type 2019 & 2032
- Table 3: Global Mammography Industry Revenue Million Forecast, by End Users 2019 & 2032
- Table 4: Global Mammography Industry Revenue Million Forecast, by Region 2019 & 2032
- Table 5: Global Mammography Industry Revenue Million Forecast, by Country 2019 & 2032
- Table 6: United States Mammography Industry Revenue (Million) Forecast, by Application 2019 & 2032
- Table 7: Canada Mammography Industry Revenue (Million) Forecast, by Application 2019 & 2032
- Table 8: Mexico Mammography Industry Revenue (Million) Forecast, by Application 2019 & 2032
- Table 9: Global Mammography Industry Revenue Million Forecast, by Country 2019 & 2032
- Table 10: Germany Mammography Industry Revenue (Million) Forecast, by Application 2019 & 2032
- Table 11: United Kingdom Mammography Industry Revenue (Million) Forecast, by Application 2019 & 2032
- Table 12: France Mammography Industry Revenue (Million) Forecast, by Application 2019 & 2032
- Table 13: Italy Mammography Industry Revenue (Million) Forecast, by Application 2019 & 2032
- Table 14: Spain Mammography Industry Revenue (Million) Forecast, by Application 2019 & 2032
- Table 15: Rest of Europe Mammography Industry Revenue (Million) Forecast, by Application 2019 & 2032
- Table 16: Global Mammography Industry Revenue Million Forecast, by Country 2019 & 2032
- Table 17: China Mammography Industry Revenue (Million) Forecast, by Application 2019 & 2032
- Table 18: Japan Mammography Industry Revenue (Million) Forecast, by Application 2019 & 2032
- Table 19: India Mammography Industry Revenue (Million) Forecast, by Application 2019 & 2032
- Table 20: Australia Mammography Industry Revenue (Million) Forecast, by Application 2019 & 2032
- Table 21: South Korea Mammography Industry Revenue (Million) Forecast, by Application 2019 & 2032
- Table 22: Rest of Asia Pacific Mammography Industry Revenue (Million) Forecast, by Application 2019 & 2032
- Table 23: Global Mammography Industry Revenue Million Forecast, by Country 2019 & 2032
- Table 24: GCC Mammography Industry Revenue (Million) Forecast, by Application 2019 & 2032
- Table 25: South Africa Mammography Industry Revenue (Million) Forecast, by Application 2019 & 2032
- Table 26: Rest of Middle East and Africa Mammography Industry Revenue (Million) Forecast, by Application 2019 & 2032
- Table 27: Global Mammography Industry Revenue Million Forecast, by Country 2019 & 2032
- Table 28: Brazil Mammography Industry Revenue (Million) Forecast, by Application 2019 & 2032
- Table 29: Argentina Mammography Industry Revenue (Million) Forecast, by Application 2019 & 2032
- Table 30: Rest of South America Mammography Industry Revenue (Million) Forecast, by Application 2019 & 2032
- Table 31: Global Mammography Industry Revenue Million Forecast, by Product Type 2019 & 2032
- Table 32: Global Mammography Industry Revenue Million Forecast, by End Users 2019 & 2032
- Table 33: Global Mammography Industry Revenue Million Forecast, by Country 2019 & 2032
- Table 34: United States Mammography Industry Revenue (Million) Forecast, by Application 2019 & 2032
- Table 35: Canada Mammography Industry Revenue (Million) Forecast, by Application 2019 & 2032
- Table 36: Mexico Mammography Industry Revenue (Million) Forecast, by Application 2019 & 2032
- Table 37: Global Mammography Industry Revenue Million Forecast, by Product Type 2019 & 2032
- Table 38: Global Mammography Industry Revenue Million Forecast, by End Users 2019 & 2032
- Table 39: Global Mammography Industry Revenue Million Forecast, by Country 2019 & 2032
- Table 40: Germany Mammography Industry Revenue (Million) Forecast, by Application 2019 & 2032
- Table 41: United Kingdom Mammography Industry Revenue (Million) Forecast, by Application 2019 & 2032
- Table 42: France Mammography Industry Revenue (Million) Forecast, by Application 2019 & 2032
- Table 43: Italy Mammography Industry Revenue (Million) Forecast, by Application 2019 & 2032
- Table 44: Spain Mammography Industry Revenue (Million) Forecast, by Application 2019 & 2032
- Table 45: Rest of Europe Mammography Industry Revenue (Million) Forecast, by Application 2019 & 2032
- Table 46: Global Mammography Industry Revenue Million Forecast, by Product Type 2019 & 2032
- Table 47: Global Mammography Industry Revenue Million Forecast, by End Users 2019 & 2032
- Table 48: Global Mammography Industry Revenue Million Forecast, by Country 2019 & 2032
- Table 49: China Mammography Industry Revenue (Million) Forecast, by Application 2019 & 2032
- Table 50: Japan Mammography Industry Revenue (Million) Forecast, by Application 2019 & 2032
- Table 51: India Mammography Industry Revenue (Million) Forecast, by Application 2019 & 2032
- Table 52: Australia Mammography Industry Revenue (Million) Forecast, by Application 2019 & 2032
- Table 53: South Korea Mammography Industry Revenue (Million) Forecast, by Application 2019 & 2032
- Table 54: Rest of Asia Pacific Mammography Industry Revenue (Million) Forecast, by Application 2019 & 2032
- Table 55: Global Mammography Industry Revenue Million Forecast, by Product Type 2019 & 2032
- Table 56: Global Mammography Industry Revenue Million Forecast, by End Users 2019 & 2032
- Table 57: Global Mammography Industry Revenue Million Forecast, by Country 2019 & 2032
- Table 58: GCC Mammography Industry Revenue (Million) Forecast, by Application 2019 & 2032
- Table 59: South Africa Mammography Industry Revenue (Million) Forecast, by Application 2019 & 2032
- Table 60: Rest of Middle East and Africa Mammography Industry Revenue (Million) Forecast, by Application 2019 & 2032
- Table 61: Global Mammography Industry Revenue Million Forecast, by Product Type 2019 & 2032
- Table 62: Global Mammography Industry Revenue Million Forecast, by End Users 2019 & 2032
- Table 63: Global Mammography Industry Revenue Million Forecast, by Country 2019 & 2032
- Table 64: Brazil Mammography Industry Revenue (Million) Forecast, by Application 2019 & 2032
- Table 65: Argentina Mammography Industry Revenue (Million) Forecast, by Application 2019 & 2032
- Table 66: Rest of South America Mammography Industry Revenue (Million) Forecast, by Application 2019 & 2032
Frequently Asked Questions
1. What is the projected Compound Annual Growth Rate (CAGR) of the Mammography Industry?
The projected CAGR is approximately 9.20%.
2. Which companies are prominent players in the Mammography Industry?
Key companies in the market include Konica Minolta Inc, Metaltronica SpA, Siemens Healthineers, Hologic Inc, GE Healthcare, Carestream Health, Koninklijke Philips NV, General Medical Merate SpA, Planmed Oy, Fujifilm Holdings Corporation, Canon Medical Systems.
3. What are the main segments of the Mammography Industry?
The market segments include Product Type, End Users.
4. Can you provide details about the market size?
The market size is estimated to be USD 2.49 Million as of 2022.
5. What are some drivers contributing to market growth?
Growing Burden of Breast Cancer; Technological Advancements in the Field of Breast Imaging; Investment from Various Organizations in Breast Cancer Screening Campaigns.
6. What are the notable trends driving market growth?
The Digital Mammography Segment is Expected to Account for the Large Market Share During the Forecast Period.
7. Are there any restraints impacting market growth?
Risk of Adverse Effects from Radiation Exposure; Reduction in Reimbursement.
8. Can you provide examples of recent developments in the market?
In May 2022, Volpara Health introduced updated products for its integrated platform for the delivery of personalized breast care at the SBI/ACR Breast Imaging Symposium 2022. Volpara's AI-driven breast software tools provide mammography quality and reporting, volumetric breast density measurements, and cancer risk assessment.
9. What pricing options are available for accessing the report?
Pricing options include single-user, multi-user, and enterprise licenses priced at USD 4750, USD 5250, and USD 8750 respectively.
10. Is the market size provided in terms of value or volume?
The market size is provided in terms of value, measured in Million.
11. Are there any specific market keywords associated with the report?
Yes, the market keyword associated with the report is "Mammography Industry," which aids in identifying and referencing the specific market segment covered.
12. How do I determine which pricing option suits my needs best?
The pricing options vary based on user requirements and access needs. Individual users may opt for single-user licenses, while businesses requiring broader access may choose multi-user or enterprise licenses for cost-effective access to the report.
13. Are there any additional resources or data provided in the Mammography Industry report?
While the report offers comprehensive insights, it's advisable to review the specific contents or supplementary materials provided to ascertain if additional resources or data are available.
14. How can I stay updated on further developments or reports in the Mammography Industry?
To stay informed about further developments, trends, and reports in the Mammography Industry, consider subscribing to industry newsletters, following relevant companies and organizations, or regularly checking reputable industry news sources and publications.
Methodology
Step 1 - Identification of Relevant Samples Size from Population Database


Step 2 - Approaches for Defining Global Market Size (Value, Volume* & Price*)

Note*: In applicable scenarios
Step 3 - Data Sources
Primary Research
- Web Analytics
- Survey Reports
- Research Institute
- Latest Research Reports
- Opinion Leaders
Secondary Research
- Annual Reports
- White Paper
- Latest Press Release
- Industry Association
- Paid Database
- Investor Presentations

Step 4 - Data Triangulation
Involves using different sources of information in order to increase the validity of a study
These sources are likely to be stakeholders in a program - participants, other researchers, program staff, other community members, and so on.
Then we put all data in single framework & apply various statistical tools to find out the dynamic on the market.
During the analysis stage, feedback from the stakeholder groups would be compared to determine areas of agreement as well as areas of divergence


