
Key Insights
The Middle East and Africa (MEA) Compressed Natural Gas (CNG) Dispenser market is experiencing robust growth, driven by increasing government initiatives promoting cleaner transportation fuels and the expanding adoption of CNG vehicles across various sectors. A rising awareness of environmental concerns and the need to reduce carbon emissions is further fueling market expansion. The region's substantial reserves of natural gas, coupled with favorable government policies offering subsidies and incentives for CNG infrastructure development, are creating a fertile ground for market growth. Specific growth drivers include the increasing urbanization leading to higher vehicle density, particularly in commercial fleets and public transportation, along with the development of robust CNG refueling infrastructure networks to support this growing demand. While the initial investment in CNG dispensing infrastructure can be high, the long-term cost savings associated with CNG's lower price compared to gasoline or diesel are incentivizing adoption. Different dispenser types, such as fast-fill and slow-fill, catering to various application needs, further contribute to market segmentation and growth. However, challenges persist, including the need for substantial investment in pipeline infrastructure to ensure reliable CNG supply across the region and addressing potential safety concerns associated with CNG handling.
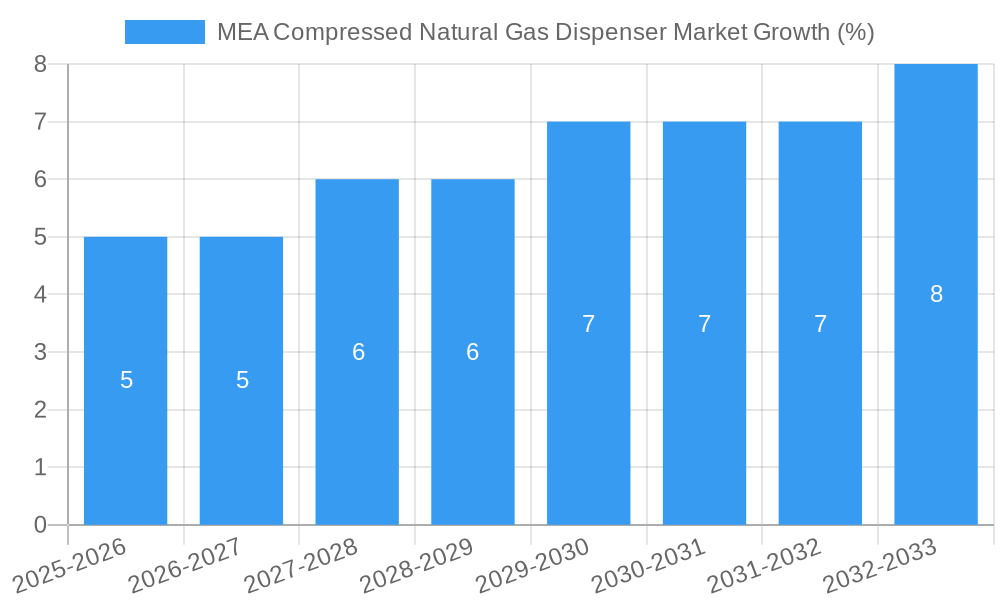
The forecast period (2025-2033) anticipates continued, albeit potentially moderating, growth in the MEA CNG dispenser market. This moderation may stem from the initial high growth rate plateauing as the market matures and reaches a certain saturation point, along with potential economic fluctuations impacting investment in infrastructure. Nevertheless, the long-term outlook remains positive, particularly in countries with strong government support for renewable and sustainable fuel alternatives. Focus will shift toward technologically advanced dispensers incorporating features such as smart monitoring and control systems, improving efficiency and safety. The market is also likely to witness increased mergers and acquisitions as larger players consolidate their market share. Further market segmentation based on nozzle type (single, double, quadruple) will likely evolve based on the specific needs of end-users and the fueling requirements of various vehicle types within the commercial, industrial, and transportation sectors.
MEA Compressed Natural Gas Dispenser Market: A Comprehensive Report (2019-2033)
This in-depth report provides a comprehensive analysis of the Middle East and Africa (MEA) Compressed Natural Gas (CNG) Dispenser market, offering invaluable insights for industry professionals, investors, and strategic decision-makers. Covering the period from 2019 to 2033, with a focus on 2025, this report unveils market dynamics, growth drivers, challenges, and emerging opportunities within this vital sector. The study encompasses detailed segmentation analysis, competitive landscapes, and future projections, providing a 360-degree view of the MEA CNG dispenser market.
MEA Compressed Natural Gas Dispenser Market Structure & Innovation Trends
This section analyzes the MEA CNG dispenser market structure, highlighting market concentration, innovation drivers, and regulatory frameworks. We delve into the competitive landscape, examining mergers and acquisitions (M&A) activities and their impact on market share. The report explores the influence of product substitutes and evolving end-user demographics on market growth.
- Market Concentration: The MEA CNG dispenser market exhibits a [Insert Market Concentration Level: e.g., moderately concentrated] structure, with [Insert Number] xx major players holding a combined market share of approximately xx%.
- Innovation Drivers: Key innovation drivers include advancements in dispenser technology (e.g., fast-fill dispensers, increased nozzle capacity), stricter emission regulations, and the rising adoption of CNG as a cleaner fuel alternative.
- Regulatory Landscape: Government regulations promoting CNG adoption and supporting infrastructure development significantly influence market growth. Variations in regulatory frameworks across different MEA countries are analyzed.
- M&A Activity: The report details significant M&A activities in the MEA CNG dispenser market during the historical period (2019-2024), including deal values and their impact on market consolidation. For example, [Insert specific M&A example if available, otherwise state "Specific examples of M&A activities impacting market share are detailed within the report"].
- Product Substitutes: The primary substitutes for CNG dispensers are other fueling infrastructure technologies, such as liquefied petroleum gas (LPG) and electric vehicle charging stations. Their market penetration and competitive implications are assessed.
- End-User Demographics: The report analyzes the end-user landscape, considering the growth of commercial fleets, public transportation systems, and retail CNG stations across the MEA region.
MEA Compressed Natural Gas Dispenser Market Dynamics & Trends
This section explores the key dynamics and trends shaping the MEA CNG dispenser market. We examine market growth drivers, technological advancements, evolving consumer preferences, and competitive dynamics. The report provides quantitative data, including Compound Annual Growth Rate (CAGR) and market penetration rates, to illustrate these trends.
[Insert 600 words analyzing market growth drivers, technological disruptions (e.g., the introduction of faster filling technologies), consumer preferences (e.g., demand for efficient and reliable dispensers), and competitive dynamics (e.g., pricing strategies, product differentiation) with specific metrics like CAGR and market penetration for the forecast period. Quantifiable data should be included wherever possible. If specific data points are unavailable, estimate values with clarity that they are estimates.]
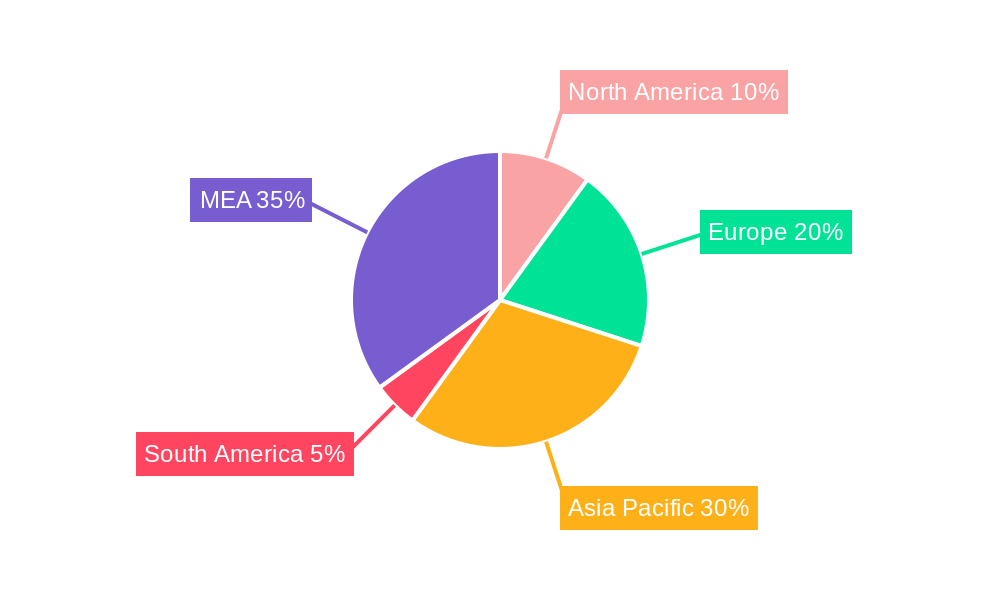
Dominant Regions & Segments in MEA Compressed Natural Gas Dispenser Market
This section identifies the leading regions, countries, and market segments within the MEA CNG dispenser market. We analyze the key drivers of growth in each segment, including economic policies, infrastructure development, and consumer demand.
- By Type:
- Fast-fill Dispensers: [Describe market dominance, key drivers, and growth projections. Include quantitative data if available.]
- Slow-fill Dispensers: [Describe market dominance, key drivers, and growth projections. Include quantitative data if available.]
- By Number of Nozzles:
- Single-nozzle: [Describe market dominance, key drivers, and growth projections. Include quantitative data if available.]
- Two-nozzle: [Describe market dominance, key drivers, and growth projections. Include quantitative data if available.]
- Four-nozzle: [Describe market dominance, key drivers, and growth projections. Include quantitative data if available.]
- By End User:
- Commercial Fleets: [Describe market dominance, key drivers, and growth projections. Include quantitative data if available.]
- Public Transportation: [Describe market dominance, key drivers, and growth projections. Include quantitative data if available.]
- Retail: [Describe market dominance, key drivers, and growth projections. Include quantitative data if available.]
- By Application:
- Transportation: [Describe market dominance, key drivers, and growth projections. Include quantitative data if available.]
- Industrial: [Describe market dominance, key drivers, and growth projections. Include quantitative data if available.]
- Commercial: [Describe market dominance, key drivers, and growth projections. Include quantitative data if available.]
[Detailed dominance analysis for each segment including key drivers (economic policies, infrastructure development, etc.) should be provided in paragraph form for each segment.]
MEA Compressed Natural Gas Dispenser Market Product Innovations
This section summarizes recent product developments and technological advancements in the MEA CNG dispenser market. We highlight key product features, competitive advantages, and their market fit.
[Insert 100-150 words summarizing product developments, focusing on technological trends and market fit. Mention specific examples of innovative products and their impact on the market.]
Report Scope & Segmentation Analysis
This report provides a detailed segmentation analysis of the MEA CNG dispenser market. The market is segmented by type (fast-fill and slow-fill dispensers), number of nozzles (single, two, and four-nozzle), end-user (commercial fleets, public transportation, and retail), and application (transportation, industrial, and commercial). Each segment's growth projections, market size, and competitive dynamics are analyzed.
[Insert 100-150 words detailing each market segmentation with growth projections, market sizes (in Millions), and competitive dynamics. Use paragraphs for each segment type.]
Key Drivers of MEA Compressed Natural Gas Dispenser Market Growth
Several factors are driving the growth of the MEA CNG dispenser market. These include:
[Insert 150 words outlining growth drivers focusing on technological advancements (e.g., improved dispenser efficiency), economic factors (e.g., government subsidies for CNG infrastructure), and regulatory policies (e.g., emission reduction targets). Include specific examples.]
Challenges in the MEA Compressed Natural Gas Dispenser Market Sector
Despite the positive outlook, the MEA CNG dispenser market faces several challenges:
[Insert 150 words discussing barriers and restraints, addressing regulatory hurdles, supply chain issues (e.g., component availability), and competitive pressures (e.g., price competition). Include quantifiable impacts where possible.]
Emerging Opportunities in MEA Compressed Natural Gas Dispenser Market
The MEA CNG dispenser market presents numerous emerging opportunities:
[Insert 150 words highlighting emerging trends and opportunities, such as expansion into new markets (e.g., underserved regions), technological advancements (e.g., smart dispensers with remote monitoring capabilities), and changing consumer preferences (e.g., demand for faster filling times).]
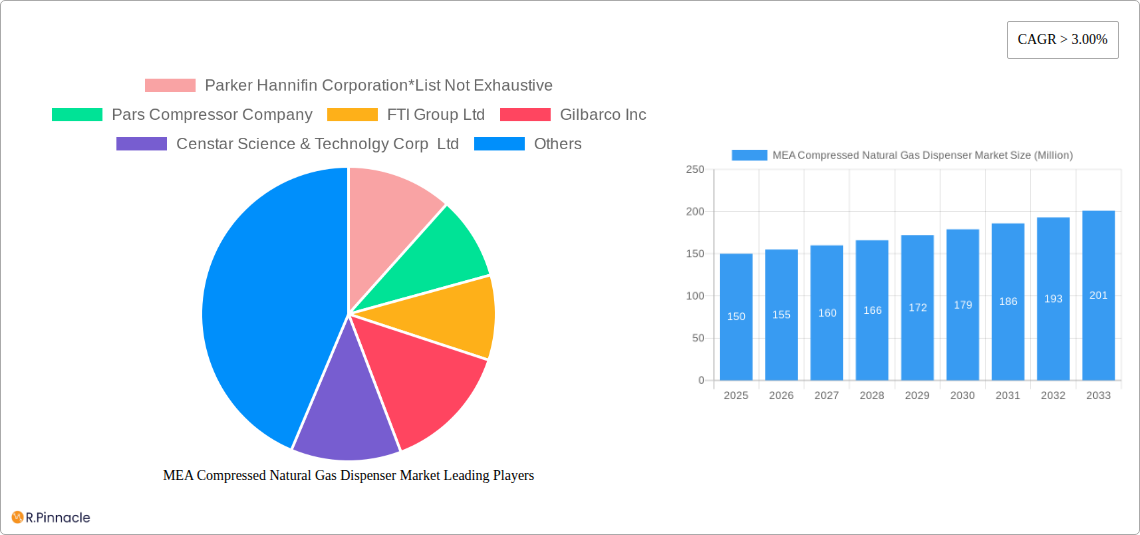
Leading Players in the MEA Compressed Natural Gas Dispenser Market Market
- Parker Hannifin Corporation
- Pars Compressor Company
- FTI Group Ltd
- Gilbarco Inc
- Censtar Science & Technology Corp Ltd
- Compressor Sazi Tabriz
- Galileo Technologies SA
- Dover Fuelling Solutions
Key Developments in MEA Compressed Natural Gas Dispenser Market Industry
- July 2022: Dover Fuelling Solutions (DFS) launched a new technologically advanced four-nozzle Wayne Helix CNG dispenser and hydrogen dispenser for the EMEA region. This launch is expected to significantly impact the market by offering a more efficient and versatile dispensing solution.
Future Outlook for MEA Compressed Natural Gas Dispenser Market Market
The MEA CNG dispenser market is poised for significant growth over the forecast period (2025-2033). Continued government support for CNG infrastructure development, rising environmental concerns, and the increasing adoption of CNG vehicles will drive market expansion. Strategic partnerships, technological innovation, and expansion into new markets will be key success factors for players in this dynamic sector. The market is expected to reach a value of xx Million by 2033.
MEA Compressed Natural Gas Dispenser Market Segmentation
-
1. Geography
- 1.1. United Arab Emirates
- 1.2. Saudi Arabia
- 1.3. Egypt
- 1.4. Tanzania
- 1.5. Rest of Middle-East and Africa
MEA Compressed Natural Gas Dispenser Market Segmentation By Geography
- 1. United Arab Emirates
- 2. Saudi Arabia
- 3. Egypt
- 4. Tanzania
- 5. Rest of Middle East and Africa
MEA Compressed Natural Gas Dispenser Market REPORT HIGHLIGHTS
| Aspects | Details |
|---|---|
| Study Period | 2019-2033 |
| Base Year | 2024 |
| Estimated Year | 2025 |
| Forecast Period | 2025-2033 |
| Historical Period | 2019-2024 |
| Growth Rate | CAGR of > 3.00% from 2019-2033 |
| Segmentation |
|
Table of Contents
- 1. Introduction
- 1.1. Research Scope
- 1.2. Market Segmentation
- 1.3. Research Methodology
- 1.4. Definitions and Assumptions
- 2. Executive Summary
- 2.1. Introduction
- 3. Market Dynamics
- 3.1. Introduction
- 3.2. Market Drivers
- 3.2.1. Increasing Offshore Oil and Gas Exploration and Production Activities4.; Growing Demand for Energy
- 3.3. Market Restrains
- 3.3.1. High Upfront Costs
- 3.4. Market Trends
- 3.4.1. Growing Demand of CNG vehicles Expected to Drive the Market
- 4. Market Factor Analysis
- 4.1. Porters Five Forces
- 4.2. Supply/Value Chain
- 4.3. PESTEL analysis
- 4.4. Market Entropy
- 4.5. Patent/Trademark Analysis
- 5. Global MEA Compressed Natural Gas Dispenser Market Analysis, Insights and Forecast, 2019-2031
- 5.1. Market Analysis, Insights and Forecast - by Geography
- 5.1.1. United Arab Emirates
- 5.1.2. Saudi Arabia
- 5.1.3. Egypt
- 5.1.4. Tanzania
- 5.1.5. Rest of Middle-East and Africa
- 5.2. Market Analysis, Insights and Forecast - by Region
- 5.2.1. United Arab Emirates
- 5.2.2. Saudi Arabia
- 5.2.3. Egypt
- 5.2.4. Tanzania
- 5.2.5. Rest of Middle East and Africa
- 5.1. Market Analysis, Insights and Forecast - by Geography
- 6. United Arab Emirates MEA Compressed Natural Gas Dispenser Market Analysis, Insights and Forecast, 2019-2031
- 6.1. Market Analysis, Insights and Forecast - by Geography
- 6.1.1. United Arab Emirates
- 6.1.2. Saudi Arabia
- 6.1.3. Egypt
- 6.1.4. Tanzania
- 6.1.5. Rest of Middle-East and Africa
- 6.1. Market Analysis, Insights and Forecast - by Geography
- 7. Saudi Arabia MEA Compressed Natural Gas Dispenser Market Analysis, Insights and Forecast, 2019-2031
- 7.1. Market Analysis, Insights and Forecast - by Geography
- 7.1.1. United Arab Emirates
- 7.1.2. Saudi Arabia
- 7.1.3. Egypt
- 7.1.4. Tanzania
- 7.1.5. Rest of Middle-East and Africa
- 7.1. Market Analysis, Insights and Forecast - by Geography
- 8. Egypt MEA Compressed Natural Gas Dispenser Market Analysis, Insights and Forecast, 2019-2031
- 8.1. Market Analysis, Insights and Forecast - by Geography
- 8.1.1. United Arab Emirates
- 8.1.2. Saudi Arabia
- 8.1.3. Egypt
- 8.1.4. Tanzania
- 8.1.5. Rest of Middle-East and Africa
- 8.1. Market Analysis, Insights and Forecast - by Geography
- 9. Tanzania MEA Compressed Natural Gas Dispenser Market Analysis, Insights and Forecast, 2019-2031
- 9.1. Market Analysis, Insights and Forecast - by Geography
- 9.1.1. United Arab Emirates
- 9.1.2. Saudi Arabia
- 9.1.3. Egypt
- 9.1.4. Tanzania
- 9.1.5. Rest of Middle-East and Africa
- 9.1. Market Analysis, Insights and Forecast - by Geography
- 10. Rest of Middle East and Africa MEA Compressed Natural Gas Dispenser Market Analysis, Insights and Forecast, 2019-2031
- 10.1. Market Analysis, Insights and Forecast - by Geography
- 10.1.1. United Arab Emirates
- 10.1.2. Saudi Arabia
- 10.1.3. Egypt
- 10.1.4. Tanzania
- 10.1.5. Rest of Middle-East and Africa
- 10.1. Market Analysis, Insights and Forecast - by Geography
- 11. North America MEA Compressed Natural Gas Dispenser Market Analysis, Insights and Forecast, 2019-2031
- 11.1. Market Analysis, Insights and Forecast - By Country/Sub-region
- 11.1.1 United States
- 11.1.2 Canada
- 11.1.3 Mexico
- 12. Europe MEA Compressed Natural Gas Dispenser Market Analysis, Insights and Forecast, 2019-2031
- 12.1. Market Analysis, Insights and Forecast - By Country/Sub-region
- 12.1.1 Germany
- 12.1.2 United Kingdom
- 12.1.3 France
- 12.1.4 Spain
- 12.1.5 Italy
- 12.1.6 Spain
- 12.1.7 Belgium
- 12.1.8 Netherland
- 12.1.9 Nordics
- 12.1.10 Rest of Europe
- 13. Asia Pacific MEA Compressed Natural Gas Dispenser Market Analysis, Insights and Forecast, 2019-2031
- 13.1. Market Analysis, Insights and Forecast - By Country/Sub-region
- 13.1.1 China
- 13.1.2 Japan
- 13.1.3 India
- 13.1.4 South Korea
- 13.1.5 Southeast Asia
- 13.1.6 Australia
- 13.1.7 Indonesia
- 13.1.8 Phillipes
- 13.1.9 Singapore
- 13.1.10 Thailandc
- 13.1.11 Rest of Asia Pacific
- 14. South America MEA Compressed Natural Gas Dispenser Market Analysis, Insights and Forecast, 2019-2031
- 14.1. Market Analysis, Insights and Forecast - By Country/Sub-region
- 14.1.1 Brazil
- 14.1.2 Argentina
- 14.1.3 Peru
- 14.1.4 Chile
- 14.1.5 Colombia
- 14.1.6 Ecuador
- 14.1.7 Venezuela
- 14.1.8 Rest of South America
- 15. MEA MEA Compressed Natural Gas Dispenser Market Analysis, Insights and Forecast, 2019-2031
- 15.1. Market Analysis, Insights and Forecast - By Country/Sub-region
- 15.1.1 United Arab Emirates
- 15.1.2 Saudi Arabia
- 15.1.3 South Africa
- 15.1.4 Rest of Middle East and Africa
- 16. Competitive Analysis
- 16.1. Global Market Share Analysis 2024
- 16.2. Company Profiles
- 16.2.1 Parker Hannifin Corporation*List Not Exhaustive
- 16.2.1.1. Overview
- 16.2.1.2. Products
- 16.2.1.3. SWOT Analysis
- 16.2.1.4. Recent Developments
- 16.2.1.5. Financials (Based on Availability)
- 16.2.2 Pars Compressor Company
- 16.2.2.1. Overview
- 16.2.2.2. Products
- 16.2.2.3. SWOT Analysis
- 16.2.2.4. Recent Developments
- 16.2.2.5. Financials (Based on Availability)
- 16.2.3 FTI Group Ltd
- 16.2.3.1. Overview
- 16.2.3.2. Products
- 16.2.3.3. SWOT Analysis
- 16.2.3.4. Recent Developments
- 16.2.3.5. Financials (Based on Availability)
- 16.2.4 Gilbarco Inc
- 16.2.4.1. Overview
- 16.2.4.2. Products
- 16.2.4.3. SWOT Analysis
- 16.2.4.4. Recent Developments
- 16.2.4.5. Financials (Based on Availability)
- 16.2.5 Censtar Science & Technolgy Corp Ltd
- 16.2.5.1. Overview
- 16.2.5.2. Products
- 16.2.5.3. SWOT Analysis
- 16.2.5.4. Recent Developments
- 16.2.5.5. Financials (Based on Availability)
- 16.2.6 Compressor Sazi Tabriz
- 16.2.6.1. Overview
- 16.2.6.2. Products
- 16.2.6.3. SWOT Analysis
- 16.2.6.4. Recent Developments
- 16.2.6.5. Financials (Based on Availability)
- 16.2.7 Galileo Technologies SA
- 16.2.7.1. Overview
- 16.2.7.2. Products
- 16.2.7.3. SWOT Analysis
- 16.2.7.4. Recent Developments
- 16.2.7.5. Financials (Based on Availability)
- 16.2.8 Dover Fuelling Solutions
- 16.2.8.1. Overview
- 16.2.8.2. Products
- 16.2.8.3. SWOT Analysis
- 16.2.8.4. Recent Developments
- 16.2.8.5. Financials (Based on Availability)
- 16.2.1 Parker Hannifin Corporation*List Not Exhaustive
List of Figures
- Figure 1: Global MEA Compressed Natural Gas Dispenser Market Revenue Breakdown (Million, %) by Region 2024 & 2032
- Figure 2: Global MEA Compressed Natural Gas Dispenser Market Volume Breakdown (K Unit, %) by Region 2024 & 2032
- Figure 3: North America MEA Compressed Natural Gas Dispenser Market Revenue (Million), by Country 2024 & 2032
- Figure 4: North America MEA Compressed Natural Gas Dispenser Market Volume (K Unit), by Country 2024 & 2032
- Figure 5: North America MEA Compressed Natural Gas Dispenser Market Revenue Share (%), by Country 2024 & 2032
- Figure 6: North America MEA Compressed Natural Gas Dispenser Market Volume Share (%), by Country 2024 & 2032
- Figure 7: Europe MEA Compressed Natural Gas Dispenser Market Revenue (Million), by Country 2024 & 2032
- Figure 8: Europe MEA Compressed Natural Gas Dispenser Market Volume (K Unit), by Country 2024 & 2032
- Figure 9: Europe MEA Compressed Natural Gas Dispenser Market Revenue Share (%), by Country 2024 & 2032
- Figure 10: Europe MEA Compressed Natural Gas Dispenser Market Volume Share (%), by Country 2024 & 2032
- Figure 11: Asia Pacific MEA Compressed Natural Gas Dispenser Market Revenue (Million), by Country 2024 & 2032
- Figure 12: Asia Pacific MEA Compressed Natural Gas Dispenser Market Volume (K Unit), by Country 2024 & 2032
- Figure 13: Asia Pacific MEA Compressed Natural Gas Dispenser Market Revenue Share (%), by Country 2024 & 2032
- Figure 14: Asia Pacific MEA Compressed Natural Gas Dispenser Market Volume Share (%), by Country 2024 & 2032
- Figure 15: South America MEA Compressed Natural Gas Dispenser Market Revenue (Million), by Country 2024 & 2032
- Figure 16: South America MEA Compressed Natural Gas Dispenser Market Volume (K Unit), by Country 2024 & 2032
- Figure 17: South America MEA Compressed Natural Gas Dispenser Market Revenue Share (%), by Country 2024 & 2032
- Figure 18: South America MEA Compressed Natural Gas Dispenser Market Volume Share (%), by Country 2024 & 2032
- Figure 19: MEA MEA Compressed Natural Gas Dispenser Market Revenue (Million), by Country 2024 & 2032
- Figure 20: MEA MEA Compressed Natural Gas Dispenser Market Volume (K Unit), by Country 2024 & 2032
- Figure 21: MEA MEA Compressed Natural Gas Dispenser Market Revenue Share (%), by Country 2024 & 2032
- Figure 22: MEA MEA Compressed Natural Gas Dispenser Market Volume Share (%), by Country 2024 & 2032
- Figure 23: United Arab Emirates MEA Compressed Natural Gas Dispenser Market Revenue (Million), by Geography 2024 & 2032
- Figure 24: United Arab Emirates MEA Compressed Natural Gas Dispenser Market Volume (K Unit), by Geography 2024 & 2032
- Figure 25: United Arab Emirates MEA Compressed Natural Gas Dispenser Market Revenue Share (%), by Geography 2024 & 2032
- Figure 26: United Arab Emirates MEA Compressed Natural Gas Dispenser Market Volume Share (%), by Geography 2024 & 2032
- Figure 27: United Arab Emirates MEA Compressed Natural Gas Dispenser Market Revenue (Million), by Country 2024 & 2032
- Figure 28: United Arab Emirates MEA Compressed Natural Gas Dispenser Market Volume (K Unit), by Country 2024 & 2032
- Figure 29: United Arab Emirates MEA Compressed Natural Gas Dispenser Market Revenue Share (%), by Country 2024 & 2032
- Figure 30: United Arab Emirates MEA Compressed Natural Gas Dispenser Market Volume Share (%), by Country 2024 & 2032
- Figure 31: Saudi Arabia MEA Compressed Natural Gas Dispenser Market Revenue (Million), by Geography 2024 & 2032
- Figure 32: Saudi Arabia MEA Compressed Natural Gas Dispenser Market Volume (K Unit), by Geography 2024 & 2032
- Figure 33: Saudi Arabia MEA Compressed Natural Gas Dispenser Market Revenue Share (%), by Geography 2024 & 2032
- Figure 34: Saudi Arabia MEA Compressed Natural Gas Dispenser Market Volume Share (%), by Geography 2024 & 2032
- Figure 35: Saudi Arabia MEA Compressed Natural Gas Dispenser Market Revenue (Million), by Country 2024 & 2032
- Figure 36: Saudi Arabia MEA Compressed Natural Gas Dispenser Market Volume (K Unit), by Country 2024 & 2032
- Figure 37: Saudi Arabia MEA Compressed Natural Gas Dispenser Market Revenue Share (%), by Country 2024 & 2032
- Figure 38: Saudi Arabia MEA Compressed Natural Gas Dispenser Market Volume Share (%), by Country 2024 & 2032
- Figure 39: Egypt MEA Compressed Natural Gas Dispenser Market Revenue (Million), by Geography 2024 & 2032
- Figure 40: Egypt MEA Compressed Natural Gas Dispenser Market Volume (K Unit), by Geography 2024 & 2032
- Figure 41: Egypt MEA Compressed Natural Gas Dispenser Market Revenue Share (%), by Geography 2024 & 2032
- Figure 42: Egypt MEA Compressed Natural Gas Dispenser Market Volume Share (%), by Geography 2024 & 2032
- Figure 43: Egypt MEA Compressed Natural Gas Dispenser Market Revenue (Million), by Country 2024 & 2032
- Figure 44: Egypt MEA Compressed Natural Gas Dispenser Market Volume (K Unit), by Country 2024 & 2032
- Figure 45: Egypt MEA Compressed Natural Gas Dispenser Market Revenue Share (%), by Country 2024 & 2032
- Figure 46: Egypt MEA Compressed Natural Gas Dispenser Market Volume Share (%), by Country 2024 & 2032
- Figure 47: Tanzania MEA Compressed Natural Gas Dispenser Market Revenue (Million), by Geography 2024 & 2032
- Figure 48: Tanzania MEA Compressed Natural Gas Dispenser Market Volume (K Unit), by Geography 2024 & 2032
- Figure 49: Tanzania MEA Compressed Natural Gas Dispenser Market Revenue Share (%), by Geography 2024 & 2032
- Figure 50: Tanzania MEA Compressed Natural Gas Dispenser Market Volume Share (%), by Geography 2024 & 2032
- Figure 51: Tanzania MEA Compressed Natural Gas Dispenser Market Revenue (Million), by Country 2024 & 2032
- Figure 52: Tanzania MEA Compressed Natural Gas Dispenser Market Volume (K Unit), by Country 2024 & 2032
- Figure 53: Tanzania MEA Compressed Natural Gas Dispenser Market Revenue Share (%), by Country 2024 & 2032
- Figure 54: Tanzania MEA Compressed Natural Gas Dispenser Market Volume Share (%), by Country 2024 & 2032
- Figure 55: Rest of Middle East and Africa MEA Compressed Natural Gas Dispenser Market Revenue (Million), by Geography 2024 & 2032
- Figure 56: Rest of Middle East and Africa MEA Compressed Natural Gas Dispenser Market Volume (K Unit), by Geography 2024 & 2032
- Figure 57: Rest of Middle East and Africa MEA Compressed Natural Gas Dispenser Market Revenue Share (%), by Geography 2024 & 2032
- Figure 58: Rest of Middle East and Africa MEA Compressed Natural Gas Dispenser Market Volume Share (%), by Geography 2024 & 2032
- Figure 59: Rest of Middle East and Africa MEA Compressed Natural Gas Dispenser Market Revenue (Million), by Country 2024 & 2032
- Figure 60: Rest of Middle East and Africa MEA Compressed Natural Gas Dispenser Market Volume (K Unit), by Country 2024 & 2032
- Figure 61: Rest of Middle East and Africa MEA Compressed Natural Gas Dispenser Market Revenue Share (%), by Country 2024 & 2032
- Figure 62: Rest of Middle East and Africa MEA Compressed Natural Gas Dispenser Market Volume Share (%), by Country 2024 & 2032
List of Tables
- Table 1: Global MEA Compressed Natural Gas Dispenser Market Revenue Million Forecast, by Region 2019 & 2032
- Table 2: Global MEA Compressed Natural Gas Dispenser Market Volume K Unit Forecast, by Region 2019 & 2032
- Table 3: Global MEA Compressed Natural Gas Dispenser Market Revenue Million Forecast, by Geography 2019 & 2032
- Table 4: Global MEA Compressed Natural Gas Dispenser Market Volume K Unit Forecast, by Geography 2019 & 2032
- Table 5: Global MEA Compressed Natural Gas Dispenser Market Revenue Million Forecast, by Region 2019 & 2032
- Table 6: Global MEA Compressed Natural Gas Dispenser Market Volume K Unit Forecast, by Region 2019 & 2032
- Table 7: Global MEA Compressed Natural Gas Dispenser Market Revenue Million Forecast, by Country 2019 & 2032
- Table 8: Global MEA Compressed Natural Gas Dispenser Market Volume K Unit Forecast, by Country 2019 & 2032
- Table 9: United States MEA Compressed Natural Gas Dispenser Market Revenue (Million) Forecast, by Application 2019 & 2032
- Table 10: United States MEA Compressed Natural Gas Dispenser Market Volume (K Unit) Forecast, by Application 2019 & 2032
- Table 11: Canada MEA Compressed Natural Gas Dispenser Market Revenue (Million) Forecast, by Application 2019 & 2032
- Table 12: Canada MEA Compressed Natural Gas Dispenser Market Volume (K Unit) Forecast, by Application 2019 & 2032
- Table 13: Mexico MEA Compressed Natural Gas Dispenser Market Revenue (Million) Forecast, by Application 2019 & 2032
- Table 14: Mexico MEA Compressed Natural Gas Dispenser Market Volume (K Unit) Forecast, by Application 2019 & 2032
- Table 15: Global MEA Compressed Natural Gas Dispenser Market Revenue Million Forecast, by Country 2019 & 2032
- Table 16: Global MEA Compressed Natural Gas Dispenser Market Volume K Unit Forecast, by Country 2019 & 2032
- Table 17: Germany MEA Compressed Natural Gas Dispenser Market Revenue (Million) Forecast, by Application 2019 & 2032
- Table 18: Germany MEA Compressed Natural Gas Dispenser Market Volume (K Unit) Forecast, by Application 2019 & 2032
- Table 19: United Kingdom MEA Compressed Natural Gas Dispenser Market Revenue (Million) Forecast, by Application 2019 & 2032
- Table 20: United Kingdom MEA Compressed Natural Gas Dispenser Market Volume (K Unit) Forecast, by Application 2019 & 2032
- Table 21: France MEA Compressed Natural Gas Dispenser Market Revenue (Million) Forecast, by Application 2019 & 2032
- Table 22: France MEA Compressed Natural Gas Dispenser Market Volume (K Unit) Forecast, by Application 2019 & 2032
- Table 23: Spain MEA Compressed Natural Gas Dispenser Market Revenue (Million) Forecast, by Application 2019 & 2032
- Table 24: Spain MEA Compressed Natural Gas Dispenser Market Volume (K Unit) Forecast, by Application 2019 & 2032
- Table 25: Italy MEA Compressed Natural Gas Dispenser Market Revenue (Million) Forecast, by Application 2019 & 2032
- Table 26: Italy MEA Compressed Natural Gas Dispenser Market Volume (K Unit) Forecast, by Application 2019 & 2032
- Table 27: Spain MEA Compressed Natural Gas Dispenser Market Revenue (Million) Forecast, by Application 2019 & 2032
- Table 28: Spain MEA Compressed Natural Gas Dispenser Market Volume (K Unit) Forecast, by Application 2019 & 2032
- Table 29: Belgium MEA Compressed Natural Gas Dispenser Market Revenue (Million) Forecast, by Application 2019 & 2032
- Table 30: Belgium MEA Compressed Natural Gas Dispenser Market Volume (K Unit) Forecast, by Application 2019 & 2032
- Table 31: Netherland MEA Compressed Natural Gas Dispenser Market Revenue (Million) Forecast, by Application 2019 & 2032
- Table 32: Netherland MEA Compressed Natural Gas Dispenser Market Volume (K Unit) Forecast, by Application 2019 & 2032
- Table 33: Nordics MEA Compressed Natural Gas Dispenser Market Revenue (Million) Forecast, by Application 2019 & 2032
- Table 34: Nordics MEA Compressed Natural Gas Dispenser Market Volume (K Unit) Forecast, by Application 2019 & 2032
- Table 35: Rest of Europe MEA Compressed Natural Gas Dispenser Market Revenue (Million) Forecast, by Application 2019 & 2032
- Table 36: Rest of Europe MEA Compressed Natural Gas Dispenser Market Volume (K Unit) Forecast, by Application 2019 & 2032
- Table 37: Global MEA Compressed Natural Gas Dispenser Market Revenue Million Forecast, by Country 2019 & 2032
- Table 38: Global MEA Compressed Natural Gas Dispenser Market Volume K Unit Forecast, by Country 2019 & 2032
- Table 39: China MEA Compressed Natural Gas Dispenser Market Revenue (Million) Forecast, by Application 2019 & 2032
- Table 40: China MEA Compressed Natural Gas Dispenser Market Volume (K Unit) Forecast, by Application 2019 & 2032
- Table 41: Japan MEA Compressed Natural Gas Dispenser Market Revenue (Million) Forecast, by Application 2019 & 2032
- Table 42: Japan MEA Compressed Natural Gas Dispenser Market Volume (K Unit) Forecast, by Application 2019 & 2032
- Table 43: India MEA Compressed Natural Gas Dispenser Market Revenue (Million) Forecast, by Application 2019 & 2032
- Table 44: India MEA Compressed Natural Gas Dispenser Market Volume (K Unit) Forecast, by Application 2019 & 2032
- Table 45: South Korea MEA Compressed Natural Gas Dispenser Market Revenue (Million) Forecast, by Application 2019 & 2032
- Table 46: South Korea MEA Compressed Natural Gas Dispenser Market Volume (K Unit) Forecast, by Application 2019 & 2032
- Table 47: Southeast Asia MEA Compressed Natural Gas Dispenser Market Revenue (Million) Forecast, by Application 2019 & 2032
- Table 48: Southeast Asia MEA Compressed Natural Gas Dispenser Market Volume (K Unit) Forecast, by Application 2019 & 2032
- Table 49: Australia MEA Compressed Natural Gas Dispenser Market Revenue (Million) Forecast, by Application 2019 & 2032
- Table 50: Australia MEA Compressed Natural Gas Dispenser Market Volume (K Unit) Forecast, by Application 2019 & 2032
- Table 51: Indonesia MEA Compressed Natural Gas Dispenser Market Revenue (Million) Forecast, by Application 2019 & 2032
- Table 52: Indonesia MEA Compressed Natural Gas Dispenser Market Volume (K Unit) Forecast, by Application 2019 & 2032
- Table 53: Phillipes MEA Compressed Natural Gas Dispenser Market Revenue (Million) Forecast, by Application 2019 & 2032
- Table 54: Phillipes MEA Compressed Natural Gas Dispenser Market Volume (K Unit) Forecast, by Application 2019 & 2032
- Table 55: Singapore MEA Compressed Natural Gas Dispenser Market Revenue (Million) Forecast, by Application 2019 & 2032
- Table 56: Singapore MEA Compressed Natural Gas Dispenser Market Volume (K Unit) Forecast, by Application 2019 & 2032
- Table 57: Thailandc MEA Compressed Natural Gas Dispenser Market Revenue (Million) Forecast, by Application 2019 & 2032
- Table 58: Thailandc MEA Compressed Natural Gas Dispenser Market Volume (K Unit) Forecast, by Application 2019 & 2032
- Table 59: Rest of Asia Pacific MEA Compressed Natural Gas Dispenser Market Revenue (Million) Forecast, by Application 2019 & 2032
- Table 60: Rest of Asia Pacific MEA Compressed Natural Gas Dispenser Market Volume (K Unit) Forecast, by Application 2019 & 2032
- Table 61: Global MEA Compressed Natural Gas Dispenser Market Revenue Million Forecast, by Country 2019 & 2032
- Table 62: Global MEA Compressed Natural Gas Dispenser Market Volume K Unit Forecast, by Country 2019 & 2032
- Table 63: Brazil MEA Compressed Natural Gas Dispenser Market Revenue (Million) Forecast, by Application 2019 & 2032
- Table 64: Brazil MEA Compressed Natural Gas Dispenser Market Volume (K Unit) Forecast, by Application 2019 & 2032
- Table 65: Argentina MEA Compressed Natural Gas Dispenser Market Revenue (Million) Forecast, by Application 2019 & 2032
- Table 66: Argentina MEA Compressed Natural Gas Dispenser Market Volume (K Unit) Forecast, by Application 2019 & 2032
- Table 67: Peru MEA Compressed Natural Gas Dispenser Market Revenue (Million) Forecast, by Application 2019 & 2032
- Table 68: Peru MEA Compressed Natural Gas Dispenser Market Volume (K Unit) Forecast, by Application 2019 & 2032
- Table 69: Chile MEA Compressed Natural Gas Dispenser Market Revenue (Million) Forecast, by Application 2019 & 2032
- Table 70: Chile MEA Compressed Natural Gas Dispenser Market Volume (K Unit) Forecast, by Application 2019 & 2032
- Table 71: Colombia MEA Compressed Natural Gas Dispenser Market Revenue (Million) Forecast, by Application 2019 & 2032
- Table 72: Colombia MEA Compressed Natural Gas Dispenser Market Volume (K Unit) Forecast, by Application 2019 & 2032
- Table 73: Ecuador MEA Compressed Natural Gas Dispenser Market Revenue (Million) Forecast, by Application 2019 & 2032
- Table 74: Ecuador MEA Compressed Natural Gas Dispenser Market Volume (K Unit) Forecast, by Application 2019 & 2032
- Table 75: Venezuela MEA Compressed Natural Gas Dispenser Market Revenue (Million) Forecast, by Application 2019 & 2032
- Table 76: Venezuela MEA Compressed Natural Gas Dispenser Market Volume (K Unit) Forecast, by Application 2019 & 2032
- Table 77: Rest of South America MEA Compressed Natural Gas Dispenser Market Revenue (Million) Forecast, by Application 2019 & 2032
- Table 78: Rest of South America MEA Compressed Natural Gas Dispenser Market Volume (K Unit) Forecast, by Application 2019 & 2032
- Table 79: Global MEA Compressed Natural Gas Dispenser Market Revenue Million Forecast, by Country 2019 & 2032
- Table 80: Global MEA Compressed Natural Gas Dispenser Market Volume K Unit Forecast, by Country 2019 & 2032
- Table 81: United Arab Emirates MEA Compressed Natural Gas Dispenser Market Revenue (Million) Forecast, by Application 2019 & 2032
- Table 82: United Arab Emirates MEA Compressed Natural Gas Dispenser Market Volume (K Unit) Forecast, by Application 2019 & 2032
- Table 83: Saudi Arabia MEA Compressed Natural Gas Dispenser Market Revenue (Million) Forecast, by Application 2019 & 2032
- Table 84: Saudi Arabia MEA Compressed Natural Gas Dispenser Market Volume (K Unit) Forecast, by Application 2019 & 2032
- Table 85: South Africa MEA Compressed Natural Gas Dispenser Market Revenue (Million) Forecast, by Application 2019 & 2032
- Table 86: South Africa MEA Compressed Natural Gas Dispenser Market Volume (K Unit) Forecast, by Application 2019 & 2032
- Table 87: Rest of Middle East and Africa MEA Compressed Natural Gas Dispenser Market Revenue (Million) Forecast, by Application 2019 & 2032
- Table 88: Rest of Middle East and Africa MEA Compressed Natural Gas Dispenser Market Volume (K Unit) Forecast, by Application 2019 & 2032
- Table 89: Global MEA Compressed Natural Gas Dispenser Market Revenue Million Forecast, by Geography 2019 & 2032
- Table 90: Global MEA Compressed Natural Gas Dispenser Market Volume K Unit Forecast, by Geography 2019 & 2032
- Table 91: Global MEA Compressed Natural Gas Dispenser Market Revenue Million Forecast, by Country 2019 & 2032
- Table 92: Global MEA Compressed Natural Gas Dispenser Market Volume K Unit Forecast, by Country 2019 & 2032
- Table 93: Global MEA Compressed Natural Gas Dispenser Market Revenue Million Forecast, by Geography 2019 & 2032
- Table 94: Global MEA Compressed Natural Gas Dispenser Market Volume K Unit Forecast, by Geography 2019 & 2032
- Table 95: Global MEA Compressed Natural Gas Dispenser Market Revenue Million Forecast, by Country 2019 & 2032
- Table 96: Global MEA Compressed Natural Gas Dispenser Market Volume K Unit Forecast, by Country 2019 & 2032
- Table 97: Global MEA Compressed Natural Gas Dispenser Market Revenue Million Forecast, by Geography 2019 & 2032
- Table 98: Global MEA Compressed Natural Gas Dispenser Market Volume K Unit Forecast, by Geography 2019 & 2032
- Table 99: Global MEA Compressed Natural Gas Dispenser Market Revenue Million Forecast, by Country 2019 & 2032
- Table 100: Global MEA Compressed Natural Gas Dispenser Market Volume K Unit Forecast, by Country 2019 & 2032
- Table 101: Global MEA Compressed Natural Gas Dispenser Market Revenue Million Forecast, by Geography 2019 & 2032
- Table 102: Global MEA Compressed Natural Gas Dispenser Market Volume K Unit Forecast, by Geography 2019 & 2032
- Table 103: Global MEA Compressed Natural Gas Dispenser Market Revenue Million Forecast, by Country 2019 & 2032
- Table 104: Global MEA Compressed Natural Gas Dispenser Market Volume K Unit Forecast, by Country 2019 & 2032
- Table 105: Global MEA Compressed Natural Gas Dispenser Market Revenue Million Forecast, by Geography 2019 & 2032
- Table 106: Global MEA Compressed Natural Gas Dispenser Market Volume K Unit Forecast, by Geography 2019 & 2032
- Table 107: Global MEA Compressed Natural Gas Dispenser Market Revenue Million Forecast, by Country 2019 & 2032
- Table 108: Global MEA Compressed Natural Gas Dispenser Market Volume K Unit Forecast, by Country 2019 & 2032
Frequently Asked Questions
1. What is the projected Compound Annual Growth Rate (CAGR) of the MEA Compressed Natural Gas Dispenser Market?
The projected CAGR is approximately > 3.00%.
2. Which companies are prominent players in the MEA Compressed Natural Gas Dispenser Market?
Key companies in the market include Parker Hannifin Corporation*List Not Exhaustive, Pars Compressor Company, FTI Group Ltd, Gilbarco Inc, Censtar Science & Technolgy Corp Ltd, Compressor Sazi Tabriz, Galileo Technologies SA, Dover Fuelling Solutions.
3. What are the main segments of the MEA Compressed Natural Gas Dispenser Market?
The market segments include Geography.
4. Can you provide details about the market size?
The market size is estimated to be USD XX Million as of 2022.
5. What are some drivers contributing to market growth?
Increasing Offshore Oil and Gas Exploration and Production Activities4.; Growing Demand for Energy.
6. What are the notable trends driving market growth?
Growing Demand of CNG vehicles Expected to Drive the Market.
7. Are there any restraints impacting market growth?
High Upfront Costs.
8. Can you provide examples of recent developments in the market?
July 2022: Dover Fuelling Solutions (DFS), the global provider of technologies and services for the fuel industry, announced the launch of a new technologically advanced four-nozzle Wayne Helix CNG dispenser and hydrogen dispenser for EMEA (Europe, Middle-East, and Africa) region.
9. What pricing options are available for accessing the report?
Pricing options include single-user, multi-user, and enterprise licenses priced at USD 4750, USD 5250, and USD 8750 respectively.
10. Is the market size provided in terms of value or volume?
The market size is provided in terms of value, measured in Million and volume, measured in K Unit.
11. Are there any specific market keywords associated with the report?
Yes, the market keyword associated with the report is "MEA Compressed Natural Gas Dispenser Market," which aids in identifying and referencing the specific market segment covered.
12. How do I determine which pricing option suits my needs best?
The pricing options vary based on user requirements and access needs. Individual users may opt for single-user licenses, while businesses requiring broader access may choose multi-user or enterprise licenses for cost-effective access to the report.
13. Are there any additional resources or data provided in the MEA Compressed Natural Gas Dispenser Market report?
While the report offers comprehensive insights, it's advisable to review the specific contents or supplementary materials provided to ascertain if additional resources or data are available.
14. How can I stay updated on further developments or reports in the MEA Compressed Natural Gas Dispenser Market?
To stay informed about further developments, trends, and reports in the MEA Compressed Natural Gas Dispenser Market, consider subscribing to industry newsletters, following relevant companies and organizations, or regularly checking reputable industry news sources and publications.
Methodology
Step 1 - Identification of Relevant Samples Size from Population Database


Step 2 - Approaches for Defining Global Market Size (Value, Volume* & Price*)

Note*: In applicable scenarios
Step 3 - Data Sources
Primary Research
- Web Analytics
- Survey Reports
- Research Institute
- Latest Research Reports
- Opinion Leaders
Secondary Research
- Annual Reports
- White Paper
- Latest Press Release
- Industry Association
- Paid Database
- Investor Presentations

Step 4 - Data Triangulation
Involves using different sources of information in order to increase the validity of a study
These sources are likely to be stakeholders in a program - participants, other researchers, program staff, other community members, and so on.
Then we put all data in single framework & apply various statistical tools to find out the dynamic on the market.
During the analysis stage, feedback from the stakeholder groups would be compared to determine areas of agreement as well as areas of divergence


