
Key Insights
The Middle East and Africa (MEA) jet fuel market is experiencing robust growth, driven by the region's expanding aviation sector, particularly in air travel and cargo transportation. The increasing number of airlines, rising passenger traffic, and the development of new airport infrastructure in key MEA nations like the UAE and Saudi Arabia are major contributors to this expansion. Furthermore, the burgeoning tourism sector and growing business travel within the region are fueling demand for jet fuel. While the global aviation industry faced significant challenges during the COVID-19 pandemic, the MEA market is demonstrating a strong recovery, surpassing pre-pandemic levels in many areas. The ongoing investments in sustainable aviation fuels (SAFs) present both an opportunity and a challenge. While SAFs offer a pathway to decarbonization, their current limited availability and higher cost compared to traditional jet fuel are restraining widespread adoption. The competitive landscape is characterized by a mix of international and regional players, each vying for market share through strategic partnerships, investments in infrastructure, and supply chain optimization. The market's growth is expected to continue, albeit at a potentially moderated pace due to fluctuating oil prices and global economic uncertainty. However, the long-term outlook remains positive, with the MEA region projected to become a significant consumer of jet fuel in the coming years. This growth will be significantly influenced by government policies promoting sustainable aviation and investments in airport infrastructure improvements.
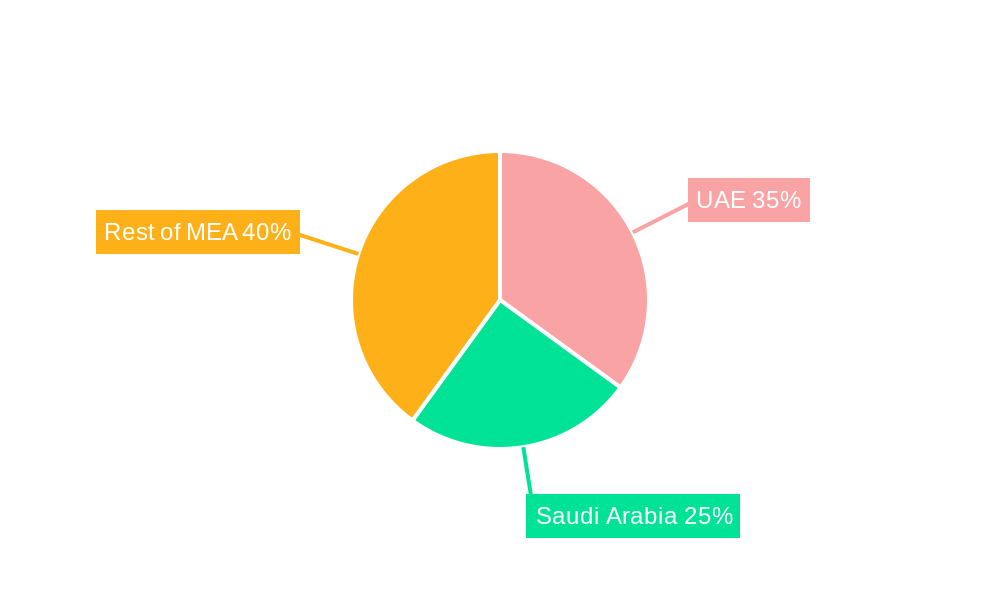
The segmentation within the MEA jet fuel market reflects the diversity of the aviation sector. Air turbine fuel (ATF) currently dominates the fuel type segment, but the share of aviation biofuels is expected to gradually increase, albeit from a small base, as technologies mature and regulatory frameworks supporting their use are strengthened. The commercial aviation segment is the largest application area, followed by defense and general aviation, each with its own unique growth trajectory. Regional variations exist, with high-growth areas such as the Gulf Cooperation Council (GCC) countries exhibiting significantly higher demand than other regions within MEA. This disparity underscores the need for tailored strategies by industry players to capitalize on specific regional opportunities while addressing the challenges inherent in each market. Analyzing the regional distribution reveals that the UAE and Saudi Arabia are leading consumers, driven by their substantial airline industries and thriving tourism sectors.
MEA Jet Fuel Industry: A Comprehensive Market Report (2019-2033)
This comprehensive report provides an in-depth analysis of the Middle East and Africa (MEA) jet fuel industry, offering invaluable insights for industry professionals, investors, and strategic decision-makers. Covering the period 2019-2033, with a focus on 2025, this report unravels market dynamics, growth drivers, challenges, and future opportunities within this crucial sector.
MEA Jet Fuel Industry Market Structure & Innovation Trends
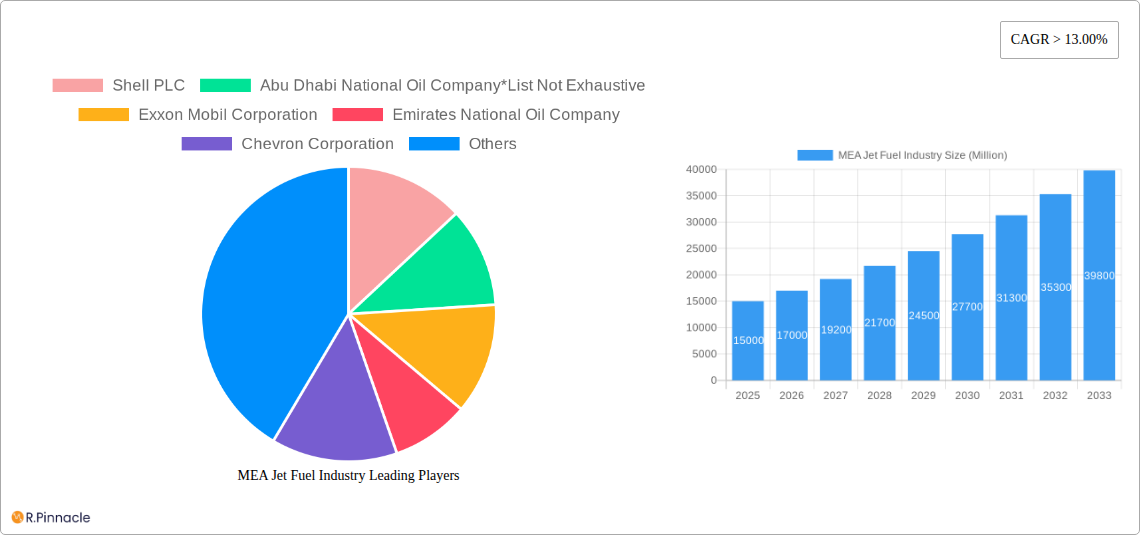
This section analyzes the MEA jet fuel market's competitive landscape, encompassing market concentration, innovation drivers, regulatory frameworks, product substitutes, end-user demographics, and mergers & acquisitions (M&A) activities. The analysis reveals a moderately concentrated market with key players such as Shell PLC, Abu Dhabi National Oil Company (ADNOC), Exxon Mobil Corporation, Emirates National Oil Company (ENOC), Chevron Corporation, TotalEnergies SE, BP PLC, and Repsol SA holding significant market share. The total market size in 2025 is estimated at $xx Million.
- Market Concentration: The top five players account for approximately xx% of the market share in 2025.
- Innovation Drivers: Stringent emission regulations and the growing demand for sustainable aviation fuel (SAF) are key innovation drivers.
- Regulatory Frameworks: Government policies promoting energy security and environmental sustainability significantly influence the market.
- Product Substitutes: The emergence of SAF and biofuels poses a competitive threat to traditional ATF.
- M&A Activities: The value of M&A deals in the MEA jet fuel sector between 2019 and 2024 totalled approximately $xx Million, driven by consolidation and expansion strategies.
MEA Jet Fuel Industry Market Dynamics & Trends
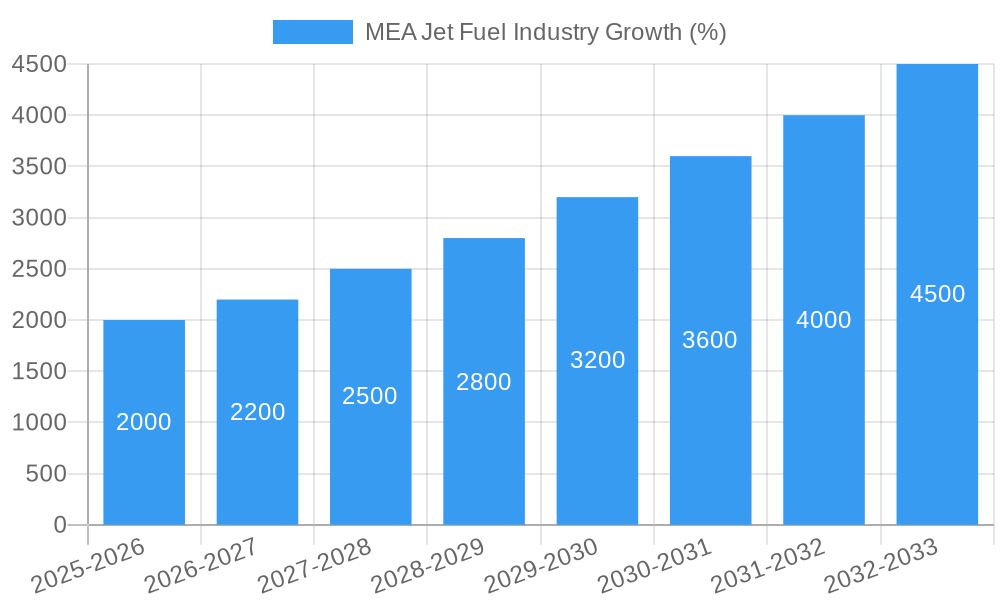
This section delves into the key market dynamics and trends shaping the MEA jet fuel industry. The market exhibits a Compound Annual Growth Rate (CAGR) of xx% during the forecast period (2025-2033), driven by factors such as the rising number of air passengers, expanding airline fleets, and increasing air freight volumes. Technological disruptions, such as the adoption of SAF, are reshaping the industry. Consumer preferences are shifting towards more sustainable and environmentally friendly aviation fuels. Competitive dynamics are intensified by the entry of new players and the strategic partnerships being forged. Market penetration of SAF is projected to reach xx% by 2033.
Dominant Regions & Segments in MEA Jet Fuel Industry
This section identifies the leading regions, countries, and segments within the MEA jet fuel market. The Commercial aviation segment dominates, driven by rapid growth in air travel within the region.
Key Drivers for the Commercial Aviation segment:
- Strong economic growth across several MEA nations.
- Expansion of airport infrastructure and increased flight connectivity.
- Growth of low-cost carriers (LCCs).
Dominant Region: The United Arab Emirates (UAE) and Saudi Arabia are leading markets due to their robust aviation sectors and significant investments in airport infrastructure.
Dominant Fuel Type: Air Turbine Fuel (ATF) remains the dominant fuel type, though the market share of Aviation Biofuel is expected to increase significantly over the forecast period.
MEA Jet Fuel Industry Product Innovations
The MEA jet fuel market is witnessing significant product innovations, primarily focused on the development and adoption of sustainable aviation fuels (SAF). These fuels, derived from renewable sources, offer significant environmental benefits and are becoming increasingly crucial for airlines aiming to reduce their carbon footprint. Technological advancements are enhancing the efficiency and cost-effectiveness of SAF production, paving the way for wider adoption. The market fit is strong due to growing regulatory pressure and consumer demand for environmentally responsible aviation.
Report Scope & Segmentation Analysis
This report provides a detailed segmentation analysis of the MEA jet fuel market based on application (Commercial, Defense, General Aviation) and fuel type (ATF, Aviation Biofuel, AVGAS).
Application: The commercial segment holds the largest market share, followed by the defense and general aviation segments. Growth projections for each segment vary depending on factors like economic growth, defense spending, and the popularity of private aviation.
Fuel Type: ATF dominates, although Aviation Biofuel is projected to witness significant growth driven by sustainability initiatives. AVGAS maintains a smaller market share. Competitive dynamics within each segment are shaped by pricing, technological advancements, and regulatory compliance.
Key Drivers of MEA Jet Fuel Industry Growth
The MEA jet fuel industry's growth is fueled by several factors, including the expansion of air travel, increasing demand for air freight, economic growth in several MEA countries, and ongoing investments in airport infrastructure. Furthermore, government initiatives promoting tourism and regional connectivity contribute to the growth trajectory. The increasing adoption of SAF is also a key driver, pushing the industry towards environmental sustainability.
Challenges in the MEA Jet Fuel Industry Sector
The MEA jet fuel industry faces several challenges, including volatile crude oil prices, geopolitical instability, stringent environmental regulations, and logistical complexities in supply chain management. These factors can lead to price fluctuations and supply disruptions, impacting profitability and market stability. The high cost of SAF poses a barrier to its widespread adoption.
Emerging Opportunities in MEA Jet Fuel Industry
The MEA jet fuel industry presents numerous opportunities, including the growing demand for SAF, the expansion of air travel within the region, and the development of new airport infrastructure. Investing in advanced biofuel technologies and collaborating on sustainability initiatives can yield significant returns. Exploring new market segments like drone delivery and regional air cargo presents further opportunities.
Leading Players in the MEA Jet Fuel Industry Market
- Shell PLC
- Abu Dhabi National Oil Company (ADNOC)
- Exxon Mobil Corporation
- Emirates National Oil Company (ENOC)
- Chevron Corporation
- TotalEnergies SE
- BP PLC
- Repsol SA
Key Developments in MEA Jet Fuel Industry
January 2022: Masdar, Siemens Energy, and TotalEnergies partnered to produce SAF using green hydrogen, signaling a significant push towards sustainable aviation.
January 2023: AviLease and SIRC signed an MoU to launch SAF production and distribution, expanding the availability of sustainable alternatives within the region.
Future Outlook for MEA Jet Fuel Industry Market
The MEA jet fuel market is poised for robust growth, driven by increasing air travel demand, infrastructure development, and the transition towards SAF. Strategic partnerships, technological advancements, and government support will further accelerate market expansion, creating lucrative opportunities for businesses operating within the sector. The focus on sustainability will continue to shape the industry's future trajectory.
MEA Jet Fuel Industry Segmentation
-
1. Fuel Type
- 1.1. Air Turbine Fuel (ATF)
- 1.2. Aviation Biofuel
- 1.3. AVGAS
-
2. Application
- 2.1. Commercial
- 2.2. Defense
- 2.3. General Aviation
-
3. Geography
- 3.1. United Arab Emirates
- 3.2. Saudi Arabia
- 3.3. Qatar
- 3.4. Egypt
- 3.5. South Africa
- 3.6. Rest of Middle-East and Africa
MEA Jet Fuel Industry Segmentation By Geography
- 1. United Arab Emirates
- 2. Saudi Arabia
- 3. Qatar
- 4. Egypt
- 5. South Africa
- 6. Rest of Middle East and Africa
MEA Jet Fuel Industry REPORT HIGHLIGHTS
| Aspects | Details |
|---|---|
| Study Period | 2019-2033 |
| Base Year | 2024 |
| Estimated Year | 2025 |
| Forecast Period | 2025-2033 |
| Historical Period | 2019-2024 |
| Growth Rate | CAGR of > 13.00% from 2019-2033 |
| Segmentation |
|
Table of Contents
- 1. Introduction
- 1.1. Research Scope
- 1.2. Market Segmentation
- 1.3. Research Methodology
- 1.4. Definitions and Assumptions
- 2. Executive Summary
- 2.1. Introduction
- 3. Market Dynamics
- 3.1. Introduction
- 3.2. Market Drivers
- 3.2.1. Increasing Renewables Capacity in Thailand4.; Rising Modernization of Existing Transmission and Distribution Infrastructure
- 3.3. Market Restrains
- 3.3.1. Huge Capital Expenditure Required for Carrying out Modernization of Existing Facilities
- 3.4. Market Trends
- 3.4.1. Commercial Sector to Dominate the Market
- 4. Market Factor Analysis
- 4.1. Porters Five Forces
- 4.2. Supply/Value Chain
- 4.3. PESTEL analysis
- 4.4. Market Entropy
- 4.5. Patent/Trademark Analysis
- 5. Global MEA Jet Fuel Industry Analysis, Insights and Forecast, 2019-2031
- 5.1. Market Analysis, Insights and Forecast - by Fuel Type
- 5.1.1. Air Turbine Fuel (ATF)
- 5.1.2. Aviation Biofuel
- 5.1.3. AVGAS
- 5.2. Market Analysis, Insights and Forecast - by Application
- 5.2.1. Commercial
- 5.2.2. Defense
- 5.2.3. General Aviation
- 5.3. Market Analysis, Insights and Forecast - by Geography
- 5.3.1. United Arab Emirates
- 5.3.2. Saudi Arabia
- 5.3.3. Qatar
- 5.3.4. Egypt
- 5.3.5. South Africa
- 5.3.6. Rest of Middle-East and Africa
- 5.4. Market Analysis, Insights and Forecast - by Region
- 5.4.1. United Arab Emirates
- 5.4.2. Saudi Arabia
- 5.4.3. Qatar
- 5.4.4. Egypt
- 5.4.5. South Africa
- 5.4.6. Rest of Middle East and Africa
- 5.1. Market Analysis, Insights and Forecast - by Fuel Type
- 6. United Arab Emirates MEA Jet Fuel Industry Analysis, Insights and Forecast, 2019-2031
- 6.1. Market Analysis, Insights and Forecast - by Fuel Type
- 6.1.1. Air Turbine Fuel (ATF)
- 6.1.2. Aviation Biofuel
- 6.1.3. AVGAS
- 6.2. Market Analysis, Insights and Forecast - by Application
- 6.2.1. Commercial
- 6.2.2. Defense
- 6.2.3. General Aviation
- 6.3. Market Analysis, Insights and Forecast - by Geography
- 6.3.1. United Arab Emirates
- 6.3.2. Saudi Arabia
- 6.3.3. Qatar
- 6.3.4. Egypt
- 6.3.5. South Africa
- 6.3.6. Rest of Middle-East and Africa
- 6.1. Market Analysis, Insights and Forecast - by Fuel Type
- 7. Saudi Arabia MEA Jet Fuel Industry Analysis, Insights and Forecast, 2019-2031
- 7.1. Market Analysis, Insights and Forecast - by Fuel Type
- 7.1.1. Air Turbine Fuel (ATF)
- 7.1.2. Aviation Biofuel
- 7.1.3. AVGAS
- 7.2. Market Analysis, Insights and Forecast - by Application
- 7.2.1. Commercial
- 7.2.2. Defense
- 7.2.3. General Aviation
- 7.3. Market Analysis, Insights and Forecast - by Geography
- 7.3.1. United Arab Emirates
- 7.3.2. Saudi Arabia
- 7.3.3. Qatar
- 7.3.4. Egypt
- 7.3.5. South Africa
- 7.3.6. Rest of Middle-East and Africa
- 7.1. Market Analysis, Insights and Forecast - by Fuel Type
- 8. Qatar MEA Jet Fuel Industry Analysis, Insights and Forecast, 2019-2031
- 8.1. Market Analysis, Insights and Forecast - by Fuel Type
- 8.1.1. Air Turbine Fuel (ATF)
- 8.1.2. Aviation Biofuel
- 8.1.3. AVGAS
- 8.2. Market Analysis, Insights and Forecast - by Application
- 8.2.1. Commercial
- 8.2.2. Defense
- 8.2.3. General Aviation
- 8.3. Market Analysis, Insights and Forecast - by Geography
- 8.3.1. United Arab Emirates
- 8.3.2. Saudi Arabia
- 8.3.3. Qatar
- 8.3.4. Egypt
- 8.3.5. South Africa
- 8.3.6. Rest of Middle-East and Africa
- 8.1. Market Analysis, Insights and Forecast - by Fuel Type
- 9. Egypt MEA Jet Fuel Industry Analysis, Insights and Forecast, 2019-2031
- 9.1. Market Analysis, Insights and Forecast - by Fuel Type
- 9.1.1. Air Turbine Fuel (ATF)
- 9.1.2. Aviation Biofuel
- 9.1.3. AVGAS
- 9.2. Market Analysis, Insights and Forecast - by Application
- 9.2.1. Commercial
- 9.2.2. Defense
- 9.2.3. General Aviation
- 9.3. Market Analysis, Insights and Forecast - by Geography
- 9.3.1. United Arab Emirates
- 9.3.2. Saudi Arabia
- 9.3.3. Qatar
- 9.3.4. Egypt
- 9.3.5. South Africa
- 9.3.6. Rest of Middle-East and Africa
- 9.1. Market Analysis, Insights and Forecast - by Fuel Type
- 10. South Africa MEA Jet Fuel Industry Analysis, Insights and Forecast, 2019-2031
- 10.1. Market Analysis, Insights and Forecast - by Fuel Type
- 10.1.1. Air Turbine Fuel (ATF)
- 10.1.2. Aviation Biofuel
- 10.1.3. AVGAS
- 10.2. Market Analysis, Insights and Forecast - by Application
- 10.2.1. Commercial
- 10.2.2. Defense
- 10.2.3. General Aviation
- 10.3. Market Analysis, Insights and Forecast - by Geography
- 10.3.1. United Arab Emirates
- 10.3.2. Saudi Arabia
- 10.3.3. Qatar
- 10.3.4. Egypt
- 10.3.5. South Africa
- 10.3.6. Rest of Middle-East and Africa
- 10.1. Market Analysis, Insights and Forecast - by Fuel Type
- 11. Rest of Middle East and Africa MEA Jet Fuel Industry Analysis, Insights and Forecast, 2019-2031
- 11.1. Market Analysis, Insights and Forecast - by Fuel Type
- 11.1.1. Air Turbine Fuel (ATF)
- 11.1.2. Aviation Biofuel
- 11.1.3. AVGAS
- 11.2. Market Analysis, Insights and Forecast - by Application
- 11.2.1. Commercial
- 11.2.2. Defense
- 11.2.3. General Aviation
- 11.3. Market Analysis, Insights and Forecast - by Geography
- 11.3.1. United Arab Emirates
- 11.3.2. Saudi Arabia
- 11.3.3. Qatar
- 11.3.4. Egypt
- 11.3.5. South Africa
- 11.3.6. Rest of Middle-East and Africa
- 11.1. Market Analysis, Insights and Forecast - by Fuel Type
- 12. North America MEA Jet Fuel Industry Analysis, Insights and Forecast, 2019-2031
- 12.1. Market Analysis, Insights and Forecast - By Country/Sub-region
- 12.1.1 United States
- 12.1.2 Canada
- 12.1.3 Mexico
- 13. Europe MEA Jet Fuel Industry Analysis, Insights and Forecast, 2019-2031
- 13.1. Market Analysis, Insights and Forecast - By Country/Sub-region
- 13.1.1 Germany
- 13.1.2 United Kingdom
- 13.1.3 France
- 13.1.4 Spain
- 13.1.5 Italy
- 13.1.6 Spain
- 13.1.7 Belgium
- 13.1.8 Netherland
- 13.1.9 Nordics
- 13.1.10 Rest of Europe
- 14. Asia Pacific MEA Jet Fuel Industry Analysis, Insights and Forecast, 2019-2031
- 14.1. Market Analysis, Insights and Forecast - By Country/Sub-region
- 14.1.1 China
- 14.1.2 Japan
- 14.1.3 India
- 14.1.4 South Korea
- 14.1.5 Southeast Asia
- 14.1.6 Australia
- 14.1.7 Indonesia
- 14.1.8 Phillipes
- 14.1.9 Singapore
- 14.1.10 Thailandc
- 14.1.11 Rest of Asia Pacific
- 15. South America MEA Jet Fuel Industry Analysis, Insights and Forecast, 2019-2031
- 15.1. Market Analysis, Insights and Forecast - By Country/Sub-region
- 15.1.1 Brazil
- 15.1.2 Argentina
- 15.1.3 Peru
- 15.1.4 Chile
- 15.1.5 Colombia
- 15.1.6 Ecuador
- 15.1.7 Venezuela
- 15.1.8 Rest of South America
- 16. North America MEA Jet Fuel Industry Analysis, Insights and Forecast, 2019-2031
- 16.1. Market Analysis, Insights and Forecast - By Country/Sub-region
- 16.1.1 United States
- 16.1.2 Canada
- 16.1.3 Mexico
- 17. MEA MEA Jet Fuel Industry Analysis, Insights and Forecast, 2019-2031
- 17.1. Market Analysis, Insights and Forecast - By Country/Sub-region
- 17.1.1 United Arab Emirates
- 17.1.2 Saudi Arabia
- 17.1.3 South Africa
- 17.1.4 Rest of Middle East and Africa
- 18. Competitive Analysis
- 18.1. Global Market Share Analysis 2024
- 18.2. Company Profiles
- 18.2.1 Shell PLC
- 18.2.1.1. Overview
- 18.2.1.2. Products
- 18.2.1.3. SWOT Analysis
- 18.2.1.4. Recent Developments
- 18.2.1.5. Financials (Based on Availability)
- 18.2.2 Abu Dhabi National Oil Company*List Not Exhaustive
- 18.2.2.1. Overview
- 18.2.2.2. Products
- 18.2.2.3. SWOT Analysis
- 18.2.2.4. Recent Developments
- 18.2.2.5. Financials (Based on Availability)
- 18.2.3 Exxon Mobil Corporation
- 18.2.3.1. Overview
- 18.2.3.2. Products
- 18.2.3.3. SWOT Analysis
- 18.2.3.4. Recent Developments
- 18.2.3.5. Financials (Based on Availability)
- 18.2.4 Emirates National Oil Company
- 18.2.4.1. Overview
- 18.2.4.2. Products
- 18.2.4.3. SWOT Analysis
- 18.2.4.4. Recent Developments
- 18.2.4.5. Financials (Based on Availability)
- 18.2.5 Chevron Corporation
- 18.2.5.1. Overview
- 18.2.5.2. Products
- 18.2.5.3. SWOT Analysis
- 18.2.5.4. Recent Developments
- 18.2.5.5. Financials (Based on Availability)
- 18.2.6 TotalENergies SE
- 18.2.6.1. Overview
- 18.2.6.2. Products
- 18.2.6.3. SWOT Analysis
- 18.2.6.4. Recent Developments
- 18.2.6.5. Financials (Based on Availability)
- 18.2.7 BP PLC
- 18.2.7.1. Overview
- 18.2.7.2. Products
- 18.2.7.3. SWOT Analysis
- 18.2.7.4. Recent Developments
- 18.2.7.5. Financials (Based on Availability)
- 18.2.8 Repsol SA
- 18.2.8.1. Overview
- 18.2.8.2. Products
- 18.2.8.3. SWOT Analysis
- 18.2.8.4. Recent Developments
- 18.2.8.5. Financials (Based on Availability)
- 18.2.1 Shell PLC
List of Figures
- Figure 1: Global MEA Jet Fuel Industry Revenue Breakdown (Million, %) by Region 2024 & 2032
- Figure 2: Global MEA Jet Fuel Industry Volume Breakdown (Litre, %) by Region 2024 & 2032
- Figure 3: North America MEA Jet Fuel Industry Revenue (Million), by Country 2024 & 2032
- Figure 4: North America MEA Jet Fuel Industry Volume (Litre), by Country 2024 & 2032
- Figure 5: North America MEA Jet Fuel Industry Revenue Share (%), by Country 2024 & 2032
- Figure 6: North America MEA Jet Fuel Industry Volume Share (%), by Country 2024 & 2032
- Figure 7: Europe MEA Jet Fuel Industry Revenue (Million), by Country 2024 & 2032
- Figure 8: Europe MEA Jet Fuel Industry Volume (Litre), by Country 2024 & 2032
- Figure 9: Europe MEA Jet Fuel Industry Revenue Share (%), by Country 2024 & 2032
- Figure 10: Europe MEA Jet Fuel Industry Volume Share (%), by Country 2024 & 2032
- Figure 11: Asia Pacific MEA Jet Fuel Industry Revenue (Million), by Country 2024 & 2032
- Figure 12: Asia Pacific MEA Jet Fuel Industry Volume (Litre), by Country 2024 & 2032
- Figure 13: Asia Pacific MEA Jet Fuel Industry Revenue Share (%), by Country 2024 & 2032
- Figure 14: Asia Pacific MEA Jet Fuel Industry Volume Share (%), by Country 2024 & 2032
- Figure 15: South America MEA Jet Fuel Industry Revenue (Million), by Country 2024 & 2032
- Figure 16: South America MEA Jet Fuel Industry Volume (Litre), by Country 2024 & 2032
- Figure 17: South America MEA Jet Fuel Industry Revenue Share (%), by Country 2024 & 2032
- Figure 18: South America MEA Jet Fuel Industry Volume Share (%), by Country 2024 & 2032
- Figure 19: North America MEA Jet Fuel Industry Revenue (Million), by Country 2024 & 2032
- Figure 20: North America MEA Jet Fuel Industry Volume (Litre), by Country 2024 & 2032
- Figure 21: North America MEA Jet Fuel Industry Revenue Share (%), by Country 2024 & 2032
- Figure 22: North America MEA Jet Fuel Industry Volume Share (%), by Country 2024 & 2032
- Figure 23: MEA MEA Jet Fuel Industry Revenue (Million), by Country 2024 & 2032
- Figure 24: MEA MEA Jet Fuel Industry Volume (Litre), by Country 2024 & 2032
- Figure 25: MEA MEA Jet Fuel Industry Revenue Share (%), by Country 2024 & 2032
- Figure 26: MEA MEA Jet Fuel Industry Volume Share (%), by Country 2024 & 2032
- Figure 27: United Arab Emirates MEA Jet Fuel Industry Revenue (Million), by Fuel Type 2024 & 2032
- Figure 28: United Arab Emirates MEA Jet Fuel Industry Volume (Litre), by Fuel Type 2024 & 2032
- Figure 29: United Arab Emirates MEA Jet Fuel Industry Revenue Share (%), by Fuel Type 2024 & 2032
- Figure 30: United Arab Emirates MEA Jet Fuel Industry Volume Share (%), by Fuel Type 2024 & 2032
- Figure 31: United Arab Emirates MEA Jet Fuel Industry Revenue (Million), by Application 2024 & 2032
- Figure 32: United Arab Emirates MEA Jet Fuel Industry Volume (Litre), by Application 2024 & 2032
- Figure 33: United Arab Emirates MEA Jet Fuel Industry Revenue Share (%), by Application 2024 & 2032
- Figure 34: United Arab Emirates MEA Jet Fuel Industry Volume Share (%), by Application 2024 & 2032
- Figure 35: United Arab Emirates MEA Jet Fuel Industry Revenue (Million), by Geography 2024 & 2032
- Figure 36: United Arab Emirates MEA Jet Fuel Industry Volume (Litre), by Geography 2024 & 2032
- Figure 37: United Arab Emirates MEA Jet Fuel Industry Revenue Share (%), by Geography 2024 & 2032
- Figure 38: United Arab Emirates MEA Jet Fuel Industry Volume Share (%), by Geography 2024 & 2032
- Figure 39: United Arab Emirates MEA Jet Fuel Industry Revenue (Million), by Country 2024 & 2032
- Figure 40: United Arab Emirates MEA Jet Fuel Industry Volume (Litre), by Country 2024 & 2032
- Figure 41: United Arab Emirates MEA Jet Fuel Industry Revenue Share (%), by Country 2024 & 2032
- Figure 42: United Arab Emirates MEA Jet Fuel Industry Volume Share (%), by Country 2024 & 2032
- Figure 43: Saudi Arabia MEA Jet Fuel Industry Revenue (Million), by Fuel Type 2024 & 2032
- Figure 44: Saudi Arabia MEA Jet Fuel Industry Volume (Litre), by Fuel Type 2024 & 2032
- Figure 45: Saudi Arabia MEA Jet Fuel Industry Revenue Share (%), by Fuel Type 2024 & 2032
- Figure 46: Saudi Arabia MEA Jet Fuel Industry Volume Share (%), by Fuel Type 2024 & 2032
- Figure 47: Saudi Arabia MEA Jet Fuel Industry Revenue (Million), by Application 2024 & 2032
- Figure 48: Saudi Arabia MEA Jet Fuel Industry Volume (Litre), by Application 2024 & 2032
- Figure 49: Saudi Arabia MEA Jet Fuel Industry Revenue Share (%), by Application 2024 & 2032
- Figure 50: Saudi Arabia MEA Jet Fuel Industry Volume Share (%), by Application 2024 & 2032
- Figure 51: Saudi Arabia MEA Jet Fuel Industry Revenue (Million), by Geography 2024 & 2032
- Figure 52: Saudi Arabia MEA Jet Fuel Industry Volume (Litre), by Geography 2024 & 2032
- Figure 53: Saudi Arabia MEA Jet Fuel Industry Revenue Share (%), by Geography 2024 & 2032
- Figure 54: Saudi Arabia MEA Jet Fuel Industry Volume Share (%), by Geography 2024 & 2032
- Figure 55: Saudi Arabia MEA Jet Fuel Industry Revenue (Million), by Country 2024 & 2032
- Figure 56: Saudi Arabia MEA Jet Fuel Industry Volume (Litre), by Country 2024 & 2032
- Figure 57: Saudi Arabia MEA Jet Fuel Industry Revenue Share (%), by Country 2024 & 2032
- Figure 58: Saudi Arabia MEA Jet Fuel Industry Volume Share (%), by Country 2024 & 2032
- Figure 59: Qatar MEA Jet Fuel Industry Revenue (Million), by Fuel Type 2024 & 2032
- Figure 60: Qatar MEA Jet Fuel Industry Volume (Litre), by Fuel Type 2024 & 2032
- Figure 61: Qatar MEA Jet Fuel Industry Revenue Share (%), by Fuel Type 2024 & 2032
- Figure 62: Qatar MEA Jet Fuel Industry Volume Share (%), by Fuel Type 2024 & 2032
- Figure 63: Qatar MEA Jet Fuel Industry Revenue (Million), by Application 2024 & 2032
- Figure 64: Qatar MEA Jet Fuel Industry Volume (Litre), by Application 2024 & 2032
- Figure 65: Qatar MEA Jet Fuel Industry Revenue Share (%), by Application 2024 & 2032
- Figure 66: Qatar MEA Jet Fuel Industry Volume Share (%), by Application 2024 & 2032
- Figure 67: Qatar MEA Jet Fuel Industry Revenue (Million), by Geography 2024 & 2032
- Figure 68: Qatar MEA Jet Fuel Industry Volume (Litre), by Geography 2024 & 2032
- Figure 69: Qatar MEA Jet Fuel Industry Revenue Share (%), by Geography 2024 & 2032
- Figure 70: Qatar MEA Jet Fuel Industry Volume Share (%), by Geography 2024 & 2032
- Figure 71: Qatar MEA Jet Fuel Industry Revenue (Million), by Country 2024 & 2032
- Figure 72: Qatar MEA Jet Fuel Industry Volume (Litre), by Country 2024 & 2032
- Figure 73: Qatar MEA Jet Fuel Industry Revenue Share (%), by Country 2024 & 2032
- Figure 74: Qatar MEA Jet Fuel Industry Volume Share (%), by Country 2024 & 2032
- Figure 75: Egypt MEA Jet Fuel Industry Revenue (Million), by Fuel Type 2024 & 2032
- Figure 76: Egypt MEA Jet Fuel Industry Volume (Litre), by Fuel Type 2024 & 2032
- Figure 77: Egypt MEA Jet Fuel Industry Revenue Share (%), by Fuel Type 2024 & 2032
- Figure 78: Egypt MEA Jet Fuel Industry Volume Share (%), by Fuel Type 2024 & 2032
- Figure 79: Egypt MEA Jet Fuel Industry Revenue (Million), by Application 2024 & 2032
- Figure 80: Egypt MEA Jet Fuel Industry Volume (Litre), by Application 2024 & 2032
- Figure 81: Egypt MEA Jet Fuel Industry Revenue Share (%), by Application 2024 & 2032
- Figure 82: Egypt MEA Jet Fuel Industry Volume Share (%), by Application 2024 & 2032
- Figure 83: Egypt MEA Jet Fuel Industry Revenue (Million), by Geography 2024 & 2032
- Figure 84: Egypt MEA Jet Fuel Industry Volume (Litre), by Geography 2024 & 2032
- Figure 85: Egypt MEA Jet Fuel Industry Revenue Share (%), by Geography 2024 & 2032
- Figure 86: Egypt MEA Jet Fuel Industry Volume Share (%), by Geography 2024 & 2032
- Figure 87: Egypt MEA Jet Fuel Industry Revenue (Million), by Country 2024 & 2032
- Figure 88: Egypt MEA Jet Fuel Industry Volume (Litre), by Country 2024 & 2032
- Figure 89: Egypt MEA Jet Fuel Industry Revenue Share (%), by Country 2024 & 2032
- Figure 90: Egypt MEA Jet Fuel Industry Volume Share (%), by Country 2024 & 2032
- Figure 91: South Africa MEA Jet Fuel Industry Revenue (Million), by Fuel Type 2024 & 2032
- Figure 92: South Africa MEA Jet Fuel Industry Volume (Litre), by Fuel Type 2024 & 2032
- Figure 93: South Africa MEA Jet Fuel Industry Revenue Share (%), by Fuel Type 2024 & 2032
- Figure 94: South Africa MEA Jet Fuel Industry Volume Share (%), by Fuel Type 2024 & 2032
- Figure 95: South Africa MEA Jet Fuel Industry Revenue (Million), by Application 2024 & 2032
- Figure 96: South Africa MEA Jet Fuel Industry Volume (Litre), by Application 2024 & 2032
- Figure 97: South Africa MEA Jet Fuel Industry Revenue Share (%), by Application 2024 & 2032
- Figure 98: South Africa MEA Jet Fuel Industry Volume Share (%), by Application 2024 & 2032
- Figure 99: South Africa MEA Jet Fuel Industry Revenue (Million), by Geography 2024 & 2032
- Figure 100: South Africa MEA Jet Fuel Industry Volume (Litre), by Geography 2024 & 2032
- Figure 101: South Africa MEA Jet Fuel Industry Revenue Share (%), by Geography 2024 & 2032
- Figure 102: South Africa MEA Jet Fuel Industry Volume Share (%), by Geography 2024 & 2032
- Figure 103: South Africa MEA Jet Fuel Industry Revenue (Million), by Country 2024 & 2032
- Figure 104: South Africa MEA Jet Fuel Industry Volume (Litre), by Country 2024 & 2032
- Figure 105: South Africa MEA Jet Fuel Industry Revenue Share (%), by Country 2024 & 2032
- Figure 106: South Africa MEA Jet Fuel Industry Volume Share (%), by Country 2024 & 2032
- Figure 107: Rest of Middle East and Africa MEA Jet Fuel Industry Revenue (Million), by Fuel Type 2024 & 2032
- Figure 108: Rest of Middle East and Africa MEA Jet Fuel Industry Volume (Litre), by Fuel Type 2024 & 2032
- Figure 109: Rest of Middle East and Africa MEA Jet Fuel Industry Revenue Share (%), by Fuel Type 2024 & 2032
- Figure 110: Rest of Middle East and Africa MEA Jet Fuel Industry Volume Share (%), by Fuel Type 2024 & 2032
- Figure 111: Rest of Middle East and Africa MEA Jet Fuel Industry Revenue (Million), by Application 2024 & 2032
- Figure 112: Rest of Middle East and Africa MEA Jet Fuel Industry Volume (Litre), by Application 2024 & 2032
- Figure 113: Rest of Middle East and Africa MEA Jet Fuel Industry Revenue Share (%), by Application 2024 & 2032
- Figure 114: Rest of Middle East and Africa MEA Jet Fuel Industry Volume Share (%), by Application 2024 & 2032
- Figure 115: Rest of Middle East and Africa MEA Jet Fuel Industry Revenue (Million), by Geography 2024 & 2032
- Figure 116: Rest of Middle East and Africa MEA Jet Fuel Industry Volume (Litre), by Geography 2024 & 2032
- Figure 117: Rest of Middle East and Africa MEA Jet Fuel Industry Revenue Share (%), by Geography 2024 & 2032
- Figure 118: Rest of Middle East and Africa MEA Jet Fuel Industry Volume Share (%), by Geography 2024 & 2032
- Figure 119: Rest of Middle East and Africa MEA Jet Fuel Industry Revenue (Million), by Country 2024 & 2032
- Figure 120: Rest of Middle East and Africa MEA Jet Fuel Industry Volume (Litre), by Country 2024 & 2032
- Figure 121: Rest of Middle East and Africa MEA Jet Fuel Industry Revenue Share (%), by Country 2024 & 2032
- Figure 122: Rest of Middle East and Africa MEA Jet Fuel Industry Volume Share (%), by Country 2024 & 2032
List of Tables
- Table 1: Global MEA Jet Fuel Industry Revenue Million Forecast, by Region 2019 & 2032
- Table 2: Global MEA Jet Fuel Industry Volume Litre Forecast, by Region 2019 & 2032
- Table 3: Global MEA Jet Fuel Industry Revenue Million Forecast, by Fuel Type 2019 & 2032
- Table 4: Global MEA Jet Fuel Industry Volume Litre Forecast, by Fuel Type 2019 & 2032
- Table 5: Global MEA Jet Fuel Industry Revenue Million Forecast, by Application 2019 & 2032
- Table 6: Global MEA Jet Fuel Industry Volume Litre Forecast, by Application 2019 & 2032
- Table 7: Global MEA Jet Fuel Industry Revenue Million Forecast, by Geography 2019 & 2032
- Table 8: Global MEA Jet Fuel Industry Volume Litre Forecast, by Geography 2019 & 2032
- Table 9: Global MEA Jet Fuel Industry Revenue Million Forecast, by Region 2019 & 2032
- Table 10: Global MEA Jet Fuel Industry Volume Litre Forecast, by Region 2019 & 2032
- Table 11: Global MEA Jet Fuel Industry Revenue Million Forecast, by Country 2019 & 2032
- Table 12: Global MEA Jet Fuel Industry Volume Litre Forecast, by Country 2019 & 2032
- Table 13: United States MEA Jet Fuel Industry Revenue (Million) Forecast, by Application 2019 & 2032
- Table 14: United States MEA Jet Fuel Industry Volume (Litre) Forecast, by Application 2019 & 2032
- Table 15: Canada MEA Jet Fuel Industry Revenue (Million) Forecast, by Application 2019 & 2032
- Table 16: Canada MEA Jet Fuel Industry Volume (Litre) Forecast, by Application 2019 & 2032
- Table 17: Mexico MEA Jet Fuel Industry Revenue (Million) Forecast, by Application 2019 & 2032
- Table 18: Mexico MEA Jet Fuel Industry Volume (Litre) Forecast, by Application 2019 & 2032
- Table 19: Global MEA Jet Fuel Industry Revenue Million Forecast, by Country 2019 & 2032
- Table 20: Global MEA Jet Fuel Industry Volume Litre Forecast, by Country 2019 & 2032
- Table 21: Germany MEA Jet Fuel Industry Revenue (Million) Forecast, by Application 2019 & 2032
- Table 22: Germany MEA Jet Fuel Industry Volume (Litre) Forecast, by Application 2019 & 2032
- Table 23: United Kingdom MEA Jet Fuel Industry Revenue (Million) Forecast, by Application 2019 & 2032
- Table 24: United Kingdom MEA Jet Fuel Industry Volume (Litre) Forecast, by Application 2019 & 2032
- Table 25: France MEA Jet Fuel Industry Revenue (Million) Forecast, by Application 2019 & 2032
- Table 26: France MEA Jet Fuel Industry Volume (Litre) Forecast, by Application 2019 & 2032
- Table 27: Spain MEA Jet Fuel Industry Revenue (Million) Forecast, by Application 2019 & 2032
- Table 28: Spain MEA Jet Fuel Industry Volume (Litre) Forecast, by Application 2019 & 2032
- Table 29: Italy MEA Jet Fuel Industry Revenue (Million) Forecast, by Application 2019 & 2032
- Table 30: Italy MEA Jet Fuel Industry Volume (Litre) Forecast, by Application 2019 & 2032
- Table 31: Spain MEA Jet Fuel Industry Revenue (Million) Forecast, by Application 2019 & 2032
- Table 32: Spain MEA Jet Fuel Industry Volume (Litre) Forecast, by Application 2019 & 2032
- Table 33: Belgium MEA Jet Fuel Industry Revenue (Million) Forecast, by Application 2019 & 2032
- Table 34: Belgium MEA Jet Fuel Industry Volume (Litre) Forecast, by Application 2019 & 2032
- Table 35: Netherland MEA Jet Fuel Industry Revenue (Million) Forecast, by Application 2019 & 2032
- Table 36: Netherland MEA Jet Fuel Industry Volume (Litre) Forecast, by Application 2019 & 2032
- Table 37: Nordics MEA Jet Fuel Industry Revenue (Million) Forecast, by Application 2019 & 2032
- Table 38: Nordics MEA Jet Fuel Industry Volume (Litre) Forecast, by Application 2019 & 2032
- Table 39: Rest of Europe MEA Jet Fuel Industry Revenue (Million) Forecast, by Application 2019 & 2032
- Table 40: Rest of Europe MEA Jet Fuel Industry Volume (Litre) Forecast, by Application 2019 & 2032
- Table 41: Global MEA Jet Fuel Industry Revenue Million Forecast, by Country 2019 & 2032
- Table 42: Global MEA Jet Fuel Industry Volume Litre Forecast, by Country 2019 & 2032
- Table 43: China MEA Jet Fuel Industry Revenue (Million) Forecast, by Application 2019 & 2032
- Table 44: China MEA Jet Fuel Industry Volume (Litre) Forecast, by Application 2019 & 2032
- Table 45: Japan MEA Jet Fuel Industry Revenue (Million) Forecast, by Application 2019 & 2032
- Table 46: Japan MEA Jet Fuel Industry Volume (Litre) Forecast, by Application 2019 & 2032
- Table 47: India MEA Jet Fuel Industry Revenue (Million) Forecast, by Application 2019 & 2032
- Table 48: India MEA Jet Fuel Industry Volume (Litre) Forecast, by Application 2019 & 2032
- Table 49: South Korea MEA Jet Fuel Industry Revenue (Million) Forecast, by Application 2019 & 2032
- Table 50: South Korea MEA Jet Fuel Industry Volume (Litre) Forecast, by Application 2019 & 2032
- Table 51: Southeast Asia MEA Jet Fuel Industry Revenue (Million) Forecast, by Application 2019 & 2032
- Table 52: Southeast Asia MEA Jet Fuel Industry Volume (Litre) Forecast, by Application 2019 & 2032
- Table 53: Australia MEA Jet Fuel Industry Revenue (Million) Forecast, by Application 2019 & 2032
- Table 54: Australia MEA Jet Fuel Industry Volume (Litre) Forecast, by Application 2019 & 2032
- Table 55: Indonesia MEA Jet Fuel Industry Revenue (Million) Forecast, by Application 2019 & 2032
- Table 56: Indonesia MEA Jet Fuel Industry Volume (Litre) Forecast, by Application 2019 & 2032
- Table 57: Phillipes MEA Jet Fuel Industry Revenue (Million) Forecast, by Application 2019 & 2032
- Table 58: Phillipes MEA Jet Fuel Industry Volume (Litre) Forecast, by Application 2019 & 2032
- Table 59: Singapore MEA Jet Fuel Industry Revenue (Million) Forecast, by Application 2019 & 2032
- Table 60: Singapore MEA Jet Fuel Industry Volume (Litre) Forecast, by Application 2019 & 2032
- Table 61: Thailandc MEA Jet Fuel Industry Revenue (Million) Forecast, by Application 2019 & 2032
- Table 62: Thailandc MEA Jet Fuel Industry Volume (Litre) Forecast, by Application 2019 & 2032
- Table 63: Rest of Asia Pacific MEA Jet Fuel Industry Revenue (Million) Forecast, by Application 2019 & 2032
- Table 64: Rest of Asia Pacific MEA Jet Fuel Industry Volume (Litre) Forecast, by Application 2019 & 2032
- Table 65: Global MEA Jet Fuel Industry Revenue Million Forecast, by Country 2019 & 2032
- Table 66: Global MEA Jet Fuel Industry Volume Litre Forecast, by Country 2019 & 2032
- Table 67: Brazil MEA Jet Fuel Industry Revenue (Million) Forecast, by Application 2019 & 2032
- Table 68: Brazil MEA Jet Fuel Industry Volume (Litre) Forecast, by Application 2019 & 2032
- Table 69: Argentina MEA Jet Fuel Industry Revenue (Million) Forecast, by Application 2019 & 2032
- Table 70: Argentina MEA Jet Fuel Industry Volume (Litre) Forecast, by Application 2019 & 2032
- Table 71: Peru MEA Jet Fuel Industry Revenue (Million) Forecast, by Application 2019 & 2032
- Table 72: Peru MEA Jet Fuel Industry Volume (Litre) Forecast, by Application 2019 & 2032
- Table 73: Chile MEA Jet Fuel Industry Revenue (Million) Forecast, by Application 2019 & 2032
- Table 74: Chile MEA Jet Fuel Industry Volume (Litre) Forecast, by Application 2019 & 2032
- Table 75: Colombia MEA Jet Fuel Industry Revenue (Million) Forecast, by Application 2019 & 2032
- Table 76: Colombia MEA Jet Fuel Industry Volume (Litre) Forecast, by Application 2019 & 2032
- Table 77: Ecuador MEA Jet Fuel Industry Revenue (Million) Forecast, by Application 2019 & 2032
- Table 78: Ecuador MEA Jet Fuel Industry Volume (Litre) Forecast, by Application 2019 & 2032
- Table 79: Venezuela MEA Jet Fuel Industry Revenue (Million) Forecast, by Application 2019 & 2032
- Table 80: Venezuela MEA Jet Fuel Industry Volume (Litre) Forecast, by Application 2019 & 2032
- Table 81: Rest of South America MEA Jet Fuel Industry Revenue (Million) Forecast, by Application 2019 & 2032
- Table 82: Rest of South America MEA Jet Fuel Industry Volume (Litre) Forecast, by Application 2019 & 2032
- Table 83: Global MEA Jet Fuel Industry Revenue Million Forecast, by Country 2019 & 2032
- Table 84: Global MEA Jet Fuel Industry Volume Litre Forecast, by Country 2019 & 2032
- Table 85: United States MEA Jet Fuel Industry Revenue (Million) Forecast, by Application 2019 & 2032
- Table 86: United States MEA Jet Fuel Industry Volume (Litre) Forecast, by Application 2019 & 2032
- Table 87: Canada MEA Jet Fuel Industry Revenue (Million) Forecast, by Application 2019 & 2032
- Table 88: Canada MEA Jet Fuel Industry Volume (Litre) Forecast, by Application 2019 & 2032
- Table 89: Mexico MEA Jet Fuel Industry Revenue (Million) Forecast, by Application 2019 & 2032
- Table 90: Mexico MEA Jet Fuel Industry Volume (Litre) Forecast, by Application 2019 & 2032
- Table 91: Global MEA Jet Fuel Industry Revenue Million Forecast, by Country 2019 & 2032
- Table 92: Global MEA Jet Fuel Industry Volume Litre Forecast, by Country 2019 & 2032
- Table 93: United Arab Emirates MEA Jet Fuel Industry Revenue (Million) Forecast, by Application 2019 & 2032
- Table 94: United Arab Emirates MEA Jet Fuel Industry Volume (Litre) Forecast, by Application 2019 & 2032
- Table 95: Saudi Arabia MEA Jet Fuel Industry Revenue (Million) Forecast, by Application 2019 & 2032
- Table 96: Saudi Arabia MEA Jet Fuel Industry Volume (Litre) Forecast, by Application 2019 & 2032
- Table 97: South Africa MEA Jet Fuel Industry Revenue (Million) Forecast, by Application 2019 & 2032
- Table 98: South Africa MEA Jet Fuel Industry Volume (Litre) Forecast, by Application 2019 & 2032
- Table 99: Rest of Middle East and Africa MEA Jet Fuel Industry Revenue (Million) Forecast, by Application 2019 & 2032
- Table 100: Rest of Middle East and Africa MEA Jet Fuel Industry Volume (Litre) Forecast, by Application 2019 & 2032
- Table 101: Global MEA Jet Fuel Industry Revenue Million Forecast, by Fuel Type 2019 & 2032
- Table 102: Global MEA Jet Fuel Industry Volume Litre Forecast, by Fuel Type 2019 & 2032
- Table 103: Global MEA Jet Fuel Industry Revenue Million Forecast, by Application 2019 & 2032
- Table 104: Global MEA Jet Fuel Industry Volume Litre Forecast, by Application 2019 & 2032
- Table 105: Global MEA Jet Fuel Industry Revenue Million Forecast, by Geography 2019 & 2032
- Table 106: Global MEA Jet Fuel Industry Volume Litre Forecast, by Geography 2019 & 2032
- Table 107: Global MEA Jet Fuel Industry Revenue Million Forecast, by Country 2019 & 2032
- Table 108: Global MEA Jet Fuel Industry Volume Litre Forecast, by Country 2019 & 2032
- Table 109: Global MEA Jet Fuel Industry Revenue Million Forecast, by Fuel Type 2019 & 2032
- Table 110: Global MEA Jet Fuel Industry Volume Litre Forecast, by Fuel Type 2019 & 2032
- Table 111: Global MEA Jet Fuel Industry Revenue Million Forecast, by Application 2019 & 2032
- Table 112: Global MEA Jet Fuel Industry Volume Litre Forecast, by Application 2019 & 2032
- Table 113: Global MEA Jet Fuel Industry Revenue Million Forecast, by Geography 2019 & 2032
- Table 114: Global MEA Jet Fuel Industry Volume Litre Forecast, by Geography 2019 & 2032
- Table 115: Global MEA Jet Fuel Industry Revenue Million Forecast, by Country 2019 & 2032
- Table 116: Global MEA Jet Fuel Industry Volume Litre Forecast, by Country 2019 & 2032
- Table 117: Global MEA Jet Fuel Industry Revenue Million Forecast, by Fuel Type 2019 & 2032
- Table 118: Global MEA Jet Fuel Industry Volume Litre Forecast, by Fuel Type 2019 & 2032
- Table 119: Global MEA Jet Fuel Industry Revenue Million Forecast, by Application 2019 & 2032
- Table 120: Global MEA Jet Fuel Industry Volume Litre Forecast, by Application 2019 & 2032
- Table 121: Global MEA Jet Fuel Industry Revenue Million Forecast, by Geography 2019 & 2032
- Table 122: Global MEA Jet Fuel Industry Volume Litre Forecast, by Geography 2019 & 2032
- Table 123: Global MEA Jet Fuel Industry Revenue Million Forecast, by Country 2019 & 2032
- Table 124: Global MEA Jet Fuel Industry Volume Litre Forecast, by Country 2019 & 2032
- Table 125: Global MEA Jet Fuel Industry Revenue Million Forecast, by Fuel Type 2019 & 2032
- Table 126: Global MEA Jet Fuel Industry Volume Litre Forecast, by Fuel Type 2019 & 2032
- Table 127: Global MEA Jet Fuel Industry Revenue Million Forecast, by Application 2019 & 2032
- Table 128: Global MEA Jet Fuel Industry Volume Litre Forecast, by Application 2019 & 2032
- Table 129: Global MEA Jet Fuel Industry Revenue Million Forecast, by Geography 2019 & 2032
- Table 130: Global MEA Jet Fuel Industry Volume Litre Forecast, by Geography 2019 & 2032
- Table 131: Global MEA Jet Fuel Industry Revenue Million Forecast, by Country 2019 & 2032
- Table 132: Global MEA Jet Fuel Industry Volume Litre Forecast, by Country 2019 & 2032
- Table 133: Global MEA Jet Fuel Industry Revenue Million Forecast, by Fuel Type 2019 & 2032
- Table 134: Global MEA Jet Fuel Industry Volume Litre Forecast, by Fuel Type 2019 & 2032
- Table 135: Global MEA Jet Fuel Industry Revenue Million Forecast, by Application 2019 & 2032
- Table 136: Global MEA Jet Fuel Industry Volume Litre Forecast, by Application 2019 & 2032
- Table 137: Global MEA Jet Fuel Industry Revenue Million Forecast, by Geography 2019 & 2032
- Table 138: Global MEA Jet Fuel Industry Volume Litre Forecast, by Geography 2019 & 2032
- Table 139: Global MEA Jet Fuel Industry Revenue Million Forecast, by Country 2019 & 2032
- Table 140: Global MEA Jet Fuel Industry Volume Litre Forecast, by Country 2019 & 2032
- Table 141: Global MEA Jet Fuel Industry Revenue Million Forecast, by Fuel Type 2019 & 2032
- Table 142: Global MEA Jet Fuel Industry Volume Litre Forecast, by Fuel Type 2019 & 2032
- Table 143: Global MEA Jet Fuel Industry Revenue Million Forecast, by Application 2019 & 2032
- Table 144: Global MEA Jet Fuel Industry Volume Litre Forecast, by Application 2019 & 2032
- Table 145: Global MEA Jet Fuel Industry Revenue Million Forecast, by Geography 2019 & 2032
- Table 146: Global MEA Jet Fuel Industry Volume Litre Forecast, by Geography 2019 & 2032
- Table 147: Global MEA Jet Fuel Industry Revenue Million Forecast, by Country 2019 & 2032
- Table 148: Global MEA Jet Fuel Industry Volume Litre Forecast, by Country 2019 & 2032
Frequently Asked Questions
1. What is the projected Compound Annual Growth Rate (CAGR) of the MEA Jet Fuel Industry?
The projected CAGR is approximately > 13.00%.
2. Which companies are prominent players in the MEA Jet Fuel Industry?
Key companies in the market include Shell PLC, Abu Dhabi National Oil Company*List Not Exhaustive, Exxon Mobil Corporation, Emirates National Oil Company, Chevron Corporation, TotalENergies SE, BP PLC, Repsol SA.
3. What are the main segments of the MEA Jet Fuel Industry?
The market segments include Fuel Type, Application, Geography.
4. Can you provide details about the market size?
The market size is estimated to be USD XX Million as of 2022.
5. What are some drivers contributing to market growth?
Increasing Renewables Capacity in Thailand4.; Rising Modernization of Existing Transmission and Distribution Infrastructure.
6. What are the notable trends driving market growth?
Commercial Sector to Dominate the Market.
7. Are there any restraints impacting market growth?
Huge Capital Expenditure Required for Carrying out Modernization of Existing Facilities.
8. Can you provide examples of recent developments in the market?
January 2022: Masdar, Siemens Energy, and TotalEnergies signed a partnership agreement focused on green hydrogen to produce sustainable aviation fuel (SAF).
9. What pricing options are available for accessing the report?
Pricing options include single-user, multi-user, and enterprise licenses priced at USD 4750, USD 5250, and USD 8750 respectively.
10. Is the market size provided in terms of value or volume?
The market size is provided in terms of value, measured in Million and volume, measured in Litre.
11. Are there any specific market keywords associated with the report?
Yes, the market keyword associated with the report is "MEA Jet Fuel Industry," which aids in identifying and referencing the specific market segment covered.
12. How do I determine which pricing option suits my needs best?
The pricing options vary based on user requirements and access needs. Individual users may opt for single-user licenses, while businesses requiring broader access may choose multi-user or enterprise licenses for cost-effective access to the report.
13. Are there any additional resources or data provided in the MEA Jet Fuel Industry report?
While the report offers comprehensive insights, it's advisable to review the specific contents or supplementary materials provided to ascertain if additional resources or data are available.
14. How can I stay updated on further developments or reports in the MEA Jet Fuel Industry?
To stay informed about further developments, trends, and reports in the MEA Jet Fuel Industry, consider subscribing to industry newsletters, following relevant companies and organizations, or regularly checking reputable industry news sources and publications.
Methodology
Step 1 - Identification of Relevant Samples Size from Population Database


Step 2 - Approaches for Defining Global Market Size (Value, Volume* & Price*)

Note*: In applicable scenarios
Step 3 - Data Sources
Primary Research
- Web Analytics
- Survey Reports
- Research Institute
- Latest Research Reports
- Opinion Leaders
Secondary Research
- Annual Reports
- White Paper
- Latest Press Release
- Industry Association
- Paid Database
- Investor Presentations

Step 4 - Data Triangulation
Involves using different sources of information in order to increase the validity of a study
These sources are likely to be stakeholders in a program - participants, other researchers, program staff, other community members, and so on.
Then we put all data in single framework & apply various statistical tools to find out the dynamic on the market.
During the analysis stage, feedback from the stakeholder groups would be compared to determine areas of agreement as well as areas of divergence


