
Key Insights
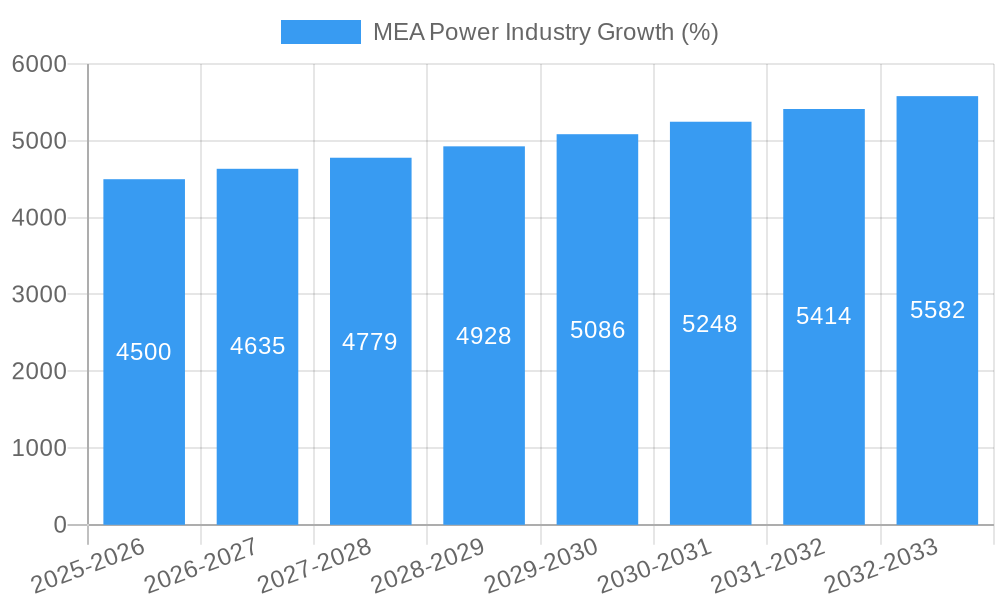
The Middle East and Africa (MEA) power industry is experiencing robust growth, driven by increasing energy demands fueled by population growth, urbanization, and industrialization. A compound annual growth rate (CAGR) exceeding 3% indicates a significant expansion in market size, projected to reach substantial value in the coming years. This growth is propelled by several key factors, including government initiatives promoting renewable energy sources to diversify energy portfolios and reduce carbon emissions. The UAE, Saudi Arabia, and Egypt are leading the charge, investing heavily in solar, wind, and other renewable energy projects. Furthermore, the region's substantial hydrocarbon reserves continue to play a crucial role, although the transition towards cleaner energy sources is accelerating. This shift is attracting significant foreign direct investment and fostering innovation within the sector. Challenges remain, however, including the high initial capital costs associated with renewable energy infrastructure development and the need for robust grid infrastructure to support the integration of intermittent renewable sources. Addressing these challenges requires strategic planning, technological advancements, and strong public-private partnerships.
Despite these challenges, the long-term outlook for the MEA power industry remains positive. The continued expansion of the regional economy, coupled with ongoing efforts to diversify energy sources and enhance energy efficiency, will sustain high demand for power generation and distribution services. The diversification of the generation mix, with a greater emphasis on renewable sources, will also create new opportunities for technology providers, project developers, and investors. The regional focus on sustainable development goals and ambitious net-zero targets will continue to fuel this growth, positioning the MEA power sector as a significant player in the global energy transition. Specific segments like solar power are expected to experience particularly strong growth due to abundant sunshine and government support.
MEA Power Industry Market Report: 2019-2033 Forecast
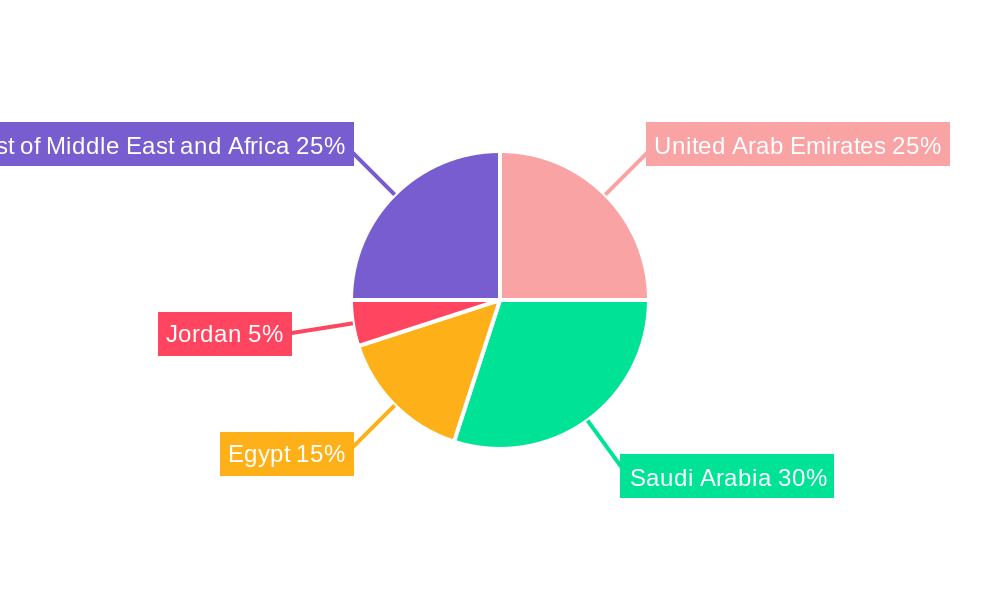
This comprehensive report provides an in-depth analysis of the Middle East and Africa (MEA) power industry, offering invaluable insights for industry professionals, investors, and strategic decision-makers. Covering the period from 2019 to 2033, with a base year of 2025 and a forecast period of 2025-2033, this report dissects market dynamics, identifies key players, and predicts future trends. The study includes detailed segmentations by generation source (Thermal, Renewable, Hydro, Others) and geography (United Arab Emirates, Saudi Arabia, Egypt, Jordan, Rest of Middle East and Africa). Expect detailed analysis of market size (in Millions), CAGR, and market share, along with identification of key growth drivers and challenges.
MEA Power Industry Market Structure & Innovation Trends
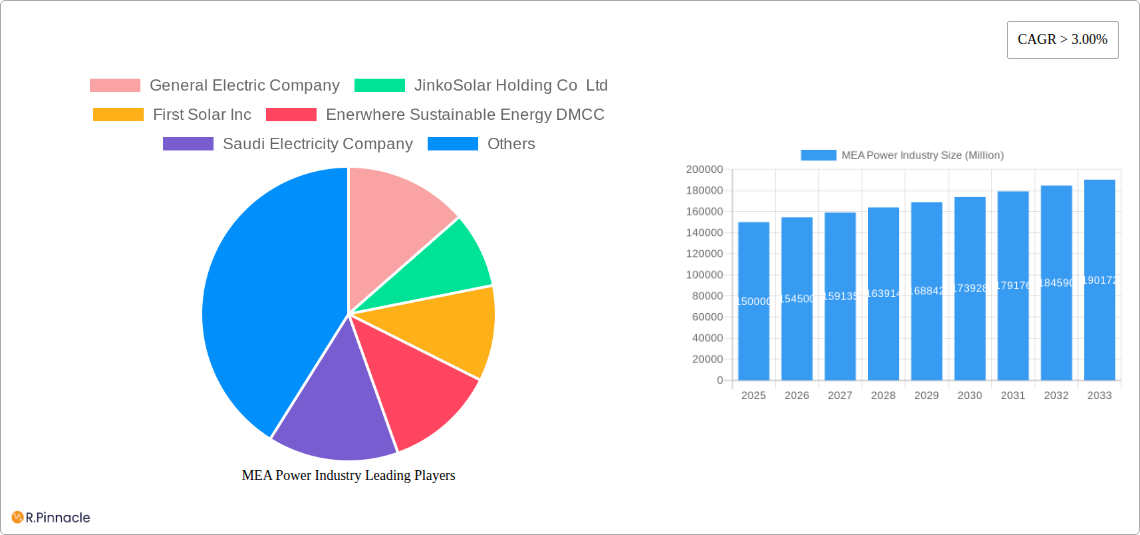
This section analyzes the MEA power industry's competitive landscape, encompassing market concentration, innovation drivers, regulatory frameworks, and M&A activities. We delve into the market share held by key players like General Electric Company, JinkoSolar Holding Co Ltd, First Solar Inc, and others. The report assesses the impact of regulatory changes and technological advancements on market structure. Furthermore, we analyze the value and impact of significant M&A deals within the industry, estimating a total M&A deal value of approximately $XX Million during the historical period (2019-2024).
- Market Concentration: Analysis of market share distribution among leading players. xx% market share is predicted for the top 5 players in 2025.
- Innovation Drivers: Examination of factors driving innovation, such as government incentives and the increasing demand for renewable energy.
- Regulatory Frameworks: Assessment of the impact of existing and upcoming regulations on industry growth.
- Product Substitutes: Evaluation of the threat from alternative power generation technologies.
- End-User Demographics: Analysis of the distribution of power consumption across various sectors.
MEA Power Industry Market Dynamics & Trends
This section explores the key market dynamics shaping the MEA power industry's trajectory. We analyze market growth drivers, technological disruptions, consumer preferences, and competitive dynamics. Our analysis reveals a projected CAGR of XX% for the forecast period (2025-2033), driven by factors such as increasing energy demand, government investments in renewable energy infrastructure, and technological advancements in energy storage solutions. The market penetration of renewable energy sources is expected to reach XX% by 2033.
Dominant Regions & Segments in MEA Power Industry
This section identifies the leading regions and segments within the MEA power industry. The United Arab Emirates and Saudi Arabia are expected to remain dominant due to their significant investments in renewable energy projects and robust economic growth. The renewable energy segment is poised for the highest growth due to government support for renewable energy initiatives and declining costs of renewable technologies.
- Key Drivers for UAE & Saudi Arabia:
- Massive investments in renewable energy infrastructure.
- Supportive government policies and economic diversification strategies.
- Abundant solar resources.
- Key Drivers for Renewable Segment:
- Decreasing costs of solar and wind power.
- Government incentives and subsidies for renewable energy projects.
- Growing environmental awareness.
- Egypt and Jordan Growth: These countries also show significant growth potential due to increasing energy demand and governmental initiatives to increase energy independence. However, limitations like financial resources and technical expertise hinder rapid expansion compared to the UAE and Saudi Arabia.
MEA Power Industry Product Innovations
The MEA power industry witnesses continuous product innovation, with a focus on enhancing efficiency, reliability, and sustainability. Key developments include advancements in solar photovoltaic (PV) technology, smart grid solutions, and energy storage systems. These innovations aim to address the region's increasing energy demand while minimizing environmental impact. The market is witnessing an increasing adoption of hybrid energy solutions integrating renewable and conventional sources.
Report Scope & Segmentation Analysis
This report comprehensively segments the MEA power industry by generation source (Thermal, Renewable, Hydro, Others) and geography (United Arab Emirates, Saudi Arabia, Egypt, Jordan, Rest of Middle East and Africa). Each segment's growth projections, market sizes, and competitive dynamics are analyzed. For instance, the renewable segment exhibits a high growth trajectory driven by increasing solar and wind energy capacity additions, while the thermal segment maintains a significant share due to its established infrastructure, but growth is expected to slow.
Key Drivers of MEA Power Industry Growth
Several key factors propel the growth of the MEA power industry. These include increasing energy demand fueled by economic growth and population expansion, supportive government policies promoting renewable energy adoption, and continuous technological advancements leading to cost reductions in renewable energy technologies. Furthermore, large-scale infrastructure projects across the region create significant opportunities for power generation and distribution companies.
Challenges in the MEA Power Industry Sector
Despite significant growth opportunities, the MEA power industry faces considerable challenges. These include the high initial investment costs associated with renewable energy projects, the limited availability of skilled labor in some regions, and potential grid integration challenges for integrating renewable energy sources into existing power grids. Moreover, the political and regulatory environments can impact investment decisions and project timelines. The total impact of these challenges is estimated to reduce overall market growth by approximately xx% by 2033.
Emerging Opportunities in MEA Power Industry
The MEA power industry presents several promising opportunities. The increasing adoption of smart grid technologies, the growing demand for energy storage solutions, and the exploration of innovative financing models for renewable energy projects are key trends. Furthermore, the development of cross-border energy trade within the region and the expansion of decentralized power generation offer significant prospects for growth and diversification.
Leading Players in the MEA Power Industry Market
- General Electric Company
- JinkoSolar Holding Co Ltd
- First Solar Inc
- Enerwhere Sustainable Energy DMCC
- Saudi Electricity Company
- Juwi Solar Inc
- Eskom Holdings SOC Ltd
- Wuxi Suntech Power Co Ltd
- Dubai Electricity & Water Authority
- ACWA POWER BARKA SAOG
- Siemens AG
- Canadian Solar Inc
- AGE Technologies JHB (Pty) Limited
Key Developments in MEA Power Industry
- January 2023: Saudi Arabia announces a significant investment in a large-scale solar power project.
- June 2022: The UAE launches a national strategy for energy efficiency.
- October 2021: A major merger between two power generation companies in Egypt is completed.
- March 2020: Several new renewable energy projects come online across multiple MEA countries.
Future Outlook for MEA Power Industry Market
The MEA power industry is poised for robust growth, driven by continued investments in renewable energy, supportive government policies, and increasing energy demand. The market is expected to witness significant growth in the renewable energy sector, along with advancements in energy storage and smart grid technologies. This will create substantial opportunities for both established and new players, leading to a more diversified and sustainable power sector in the region. The overall market size is projected to reach $XX Million by 2033.
MEA Power Industry Segmentation
-
1. Generation - Source
- 1.1. Thermal
- 1.2. Renewable
- 1.3. Hydro
- 1.4. Others
- 2. Transmission and Distribution
-
3. Geogrpahy
- 3.1. United Arab Emirates
- 3.2. Saudi Arabia
- 3.3. Egypt
- 3.4. Jordan
- 3.5. Rest of Middle-East and Africa
MEA Power Industry Segmentation By Geography
-
1. North America
- 1.1. United States
- 1.2. Canada
- 1.3. Mexico
-
2. South America
- 2.1. Brazil
- 2.2. Argentina
- 2.3. Rest of South America
-
3. Europe
- 3.1. United Kingdom
- 3.2. Germany
- 3.3. France
- 3.4. Italy
- 3.5. Spain
- 3.6. Russia
- 3.7. Benelux
- 3.8. Nordics
- 3.9. Rest of Europe
-
4. Middle East & Africa
- 4.1. Turkey
- 4.2. Israel
- 4.3. GCC
- 4.4. North Africa
- 4.5. South Africa
- 4.6. Rest of Middle East & Africa
-
5. Asia Pacific
- 5.1. China
- 5.2. India
- 5.3. Japan
- 5.4. South Korea
- 5.5. ASEAN
- 5.6. Oceania
- 5.7. Rest of Asia Pacific
MEA Power Industry REPORT HIGHLIGHTS
| Aspects | Details |
|---|---|
| Study Period | 2019-2033 |
| Base Year | 2024 |
| Estimated Year | 2025 |
| Forecast Period | 2025-2033 |
| Historical Period | 2019-2024 |
| Growth Rate | CAGR of > 3.00% from 2019-2033 |
| Segmentation |
|
Table of Contents
- 1. Introduction
- 1.1. Research Scope
- 1.2. Market Segmentation
- 1.3. Research Methodology
- 1.4. Definitions and Assumptions
- 2. Executive Summary
- 2.1. Introduction
- 3. Market Dynamics
- 3.1. Introduction
- 3.2. Market Drivers
- 3.2.1. 4.; Demand for Solar Photovoltaic Installations4.; Growing Investments
- 3.3. Market Restrains
- 3.3.1. 4.; Increasing Wind Energy Installations
- 3.4. Market Trends
- 3.4.1. Thermal Sources to Dominate the Market
- 4. Market Factor Analysis
- 4.1. Porters Five Forces
- 4.2. Supply/Value Chain
- 4.3. PESTEL analysis
- 4.4. Market Entropy
- 4.5. Patent/Trademark Analysis
- 5. Global MEA Power Industry Analysis, Insights and Forecast, 2019-2031
- 5.1. Market Analysis, Insights and Forecast - by Generation - Source
- 5.1.1. Thermal
- 5.1.2. Renewable
- 5.1.3. Hydro
- 5.1.4. Others
- 5.2. Market Analysis, Insights and Forecast - by Transmission and Distribution
- 5.3. Market Analysis, Insights and Forecast - by Geogrpahy
- 5.3.1. United Arab Emirates
- 5.3.2. Saudi Arabia
- 5.3.3. Egypt
- 5.3.4. Jordan
- 5.3.5. Rest of Middle-East and Africa
- 5.4. Market Analysis, Insights and Forecast - by Region
- 5.4.1. North America
- 5.4.2. South America
- 5.4.3. Europe
- 5.4.4. Middle East & Africa
- 5.4.5. Asia Pacific
- 5.1. Market Analysis, Insights and Forecast - by Generation - Source
- 6. North America MEA Power Industry Analysis, Insights and Forecast, 2019-2031
- 6.1. Market Analysis, Insights and Forecast - by Generation - Source
- 6.1.1. Thermal
- 6.1.2. Renewable
- 6.1.3. Hydro
- 6.1.4. Others
- 6.2. Market Analysis, Insights and Forecast - by Transmission and Distribution
- 6.3. Market Analysis, Insights and Forecast - by Geogrpahy
- 6.3.1. United Arab Emirates
- 6.3.2. Saudi Arabia
- 6.3.3. Egypt
- 6.3.4. Jordan
- 6.3.5. Rest of Middle-East and Africa
- 6.1. Market Analysis, Insights and Forecast - by Generation - Source
- 7. South America MEA Power Industry Analysis, Insights and Forecast, 2019-2031
- 7.1. Market Analysis, Insights and Forecast - by Generation - Source
- 7.1.1. Thermal
- 7.1.2. Renewable
- 7.1.3. Hydro
- 7.1.4. Others
- 7.2. Market Analysis, Insights and Forecast - by Transmission and Distribution
- 7.3. Market Analysis, Insights and Forecast - by Geogrpahy
- 7.3.1. United Arab Emirates
- 7.3.2. Saudi Arabia
- 7.3.3. Egypt
- 7.3.4. Jordan
- 7.3.5. Rest of Middle-East and Africa
- 7.1. Market Analysis, Insights and Forecast - by Generation - Source
- 8. Europe MEA Power Industry Analysis, Insights and Forecast, 2019-2031
- 8.1. Market Analysis, Insights and Forecast - by Generation - Source
- 8.1.1. Thermal
- 8.1.2. Renewable
- 8.1.3. Hydro
- 8.1.4. Others
- 8.2. Market Analysis, Insights and Forecast - by Transmission and Distribution
- 8.3. Market Analysis, Insights and Forecast - by Geogrpahy
- 8.3.1. United Arab Emirates
- 8.3.2. Saudi Arabia
- 8.3.3. Egypt
- 8.3.4. Jordan
- 8.3.5. Rest of Middle-East and Africa
- 8.1. Market Analysis, Insights and Forecast - by Generation - Source
- 9. Middle East & Africa MEA Power Industry Analysis, Insights and Forecast, 2019-2031
- 9.1. Market Analysis, Insights and Forecast - by Generation - Source
- 9.1.1. Thermal
- 9.1.2. Renewable
- 9.1.3. Hydro
- 9.1.4. Others
- 9.2. Market Analysis, Insights and Forecast - by Transmission and Distribution
- 9.3. Market Analysis, Insights and Forecast - by Geogrpahy
- 9.3.1. United Arab Emirates
- 9.3.2. Saudi Arabia
- 9.3.3. Egypt
- 9.3.4. Jordan
- 9.3.5. Rest of Middle-East and Africa
- 9.1. Market Analysis, Insights and Forecast - by Generation - Source
- 10. Asia Pacific MEA Power Industry Analysis, Insights and Forecast, 2019-2031
- 10.1. Market Analysis, Insights and Forecast - by Generation - Source
- 10.1.1. Thermal
- 10.1.2. Renewable
- 10.1.3. Hydro
- 10.1.4. Others
- 10.2. Market Analysis, Insights and Forecast - by Transmission and Distribution
- 10.3. Market Analysis, Insights and Forecast - by Geogrpahy
- 10.3.1. United Arab Emirates
- 10.3.2. Saudi Arabia
- 10.3.3. Egypt
- 10.3.4. Jordan
- 10.3.5. Rest of Middle-East and Africa
- 10.1. Market Analysis, Insights and Forecast - by Generation - Source
- 11. North America MEA Power Industry Analysis, Insights and Forecast, 2019-2031
- 11.1. Market Analysis, Insights and Forecast - By Country/Sub-region
- 11.1.1 United States
- 11.1.2 Canada
- 11.1.3 Mexico
- 12. Europe MEA Power Industry Analysis, Insights and Forecast, 2019-2031
- 12.1. Market Analysis, Insights and Forecast - By Country/Sub-region
- 12.1.1 Germany
- 12.1.2 United Kingdom
- 12.1.3 France
- 12.1.4 Spain
- 12.1.5 Italy
- 12.1.6 Spain
- 12.1.7 Belgium
- 12.1.8 Netherland
- 12.1.9 Nordics
- 12.1.10 Rest of Europe
- 13. Asia Pacific MEA Power Industry Analysis, Insights and Forecast, 2019-2031
- 13.1. Market Analysis, Insights and Forecast - By Country/Sub-region
- 13.1.1 China
- 13.1.2 Japan
- 13.1.3 India
- 13.1.4 South Korea
- 13.1.5 Southeast Asia
- 13.1.6 Australia
- 13.1.7 Indonesia
- 13.1.8 Phillipes
- 13.1.9 Singapore
- 13.1.10 Thailandc
- 13.1.11 Rest of Asia Pacific
- 14. South America MEA Power Industry Analysis, Insights and Forecast, 2019-2031
- 14.1. Market Analysis, Insights and Forecast - By Country/Sub-region
- 14.1.1 Brazil
- 14.1.2 Argentina
- 14.1.3 Peru
- 14.1.4 Chile
- 14.1.5 Colombia
- 14.1.6 Ecuador
- 14.1.7 Venezuela
- 14.1.8 Rest of South America
- 15. MEA MEA Power Industry Analysis, Insights and Forecast, 2019-2031
- 15.1. Market Analysis, Insights and Forecast - By Country/Sub-region
- 15.1.1 United Arab Emirates
- 15.1.2 Saudi Arabia
- 15.1.3 South Africa
- 15.1.4 Rest of Middle East and Africa
- 16. Competitive Analysis
- 16.1. Global Market Share Analysis 2024
- 16.2. Company Profiles
- 16.2.1 General Electric Company
- 16.2.1.1. Overview
- 16.2.1.2. Products
- 16.2.1.3. SWOT Analysis
- 16.2.1.4. Recent Developments
- 16.2.1.5. Financials (Based on Availability)
- 16.2.2 JinkoSolar Holding Co Ltd
- 16.2.2.1. Overview
- 16.2.2.2. Products
- 16.2.2.3. SWOT Analysis
- 16.2.2.4. Recent Developments
- 16.2.2.5. Financials (Based on Availability)
- 16.2.3 First Solar Inc
- 16.2.3.1. Overview
- 16.2.3.2. Products
- 16.2.3.3. SWOT Analysis
- 16.2.3.4. Recent Developments
- 16.2.3.5. Financials (Based on Availability)
- 16.2.4 Enerwhere Sustainable Energy DMCC
- 16.2.4.1. Overview
- 16.2.4.2. Products
- 16.2.4.3. SWOT Analysis
- 16.2.4.4. Recent Developments
- 16.2.4.5. Financials (Based on Availability)
- 16.2.5 Saudi Electricity Company
- 16.2.5.1. Overview
- 16.2.5.2. Products
- 16.2.5.3. SWOT Analysis
- 16.2.5.4. Recent Developments
- 16.2.5.5. Financials (Based on Availability)
- 16.2.6 Juwi Solar Inc
- 16.2.6.1. Overview
- 16.2.6.2. Products
- 16.2.6.3. SWOT Analysis
- 16.2.6.4. Recent Developments
- 16.2.6.5. Financials (Based on Availability)
- 16.2.7 Eskom Holdings SOC Ltd
- 16.2.7.1. Overview
- 16.2.7.2. Products
- 16.2.7.3. SWOT Analysis
- 16.2.7.4. Recent Developments
- 16.2.7.5. Financials (Based on Availability)
- 16.2.8 Wuxi Suntech Power Co Ltd
- 16.2.8.1. Overview
- 16.2.8.2. Products
- 16.2.8.3. SWOT Analysis
- 16.2.8.4. Recent Developments
- 16.2.8.5. Financials (Based on Availability)
- 16.2.9 Dubai Electricity & Water Authority
- 16.2.9.1. Overview
- 16.2.9.2. Products
- 16.2.9.3. SWOT Analysis
- 16.2.9.4. Recent Developments
- 16.2.9.5. Financials (Based on Availability)
- 16.2.10 ACWA POWER BARKA SAOG
- 16.2.10.1. Overview
- 16.2.10.2. Products
- 16.2.10.3. SWOT Analysis
- 16.2.10.4. Recent Developments
- 16.2.10.5. Financials (Based on Availability)
- 16.2.11 Siemens AG
- 16.2.11.1. Overview
- 16.2.11.2. Products
- 16.2.11.3. SWOT Analysis
- 16.2.11.4. Recent Developments
- 16.2.11.5. Financials (Based on Availability)
- 16.2.12 Canadian Solar Inc
- 16.2.12.1. Overview
- 16.2.12.2. Products
- 16.2.12.3. SWOT Analysis
- 16.2.12.4. Recent Developments
- 16.2.12.5. Financials (Based on Availability)
- 16.2.13 AGE Technologies JHB (Pty) Limited
- 16.2.13.1. Overview
- 16.2.13.2. Products
- 16.2.13.3. SWOT Analysis
- 16.2.13.4. Recent Developments
- 16.2.13.5. Financials (Based on Availability)
- 16.2.1 General Electric Company
List of Figures
- Figure 1: Global MEA Power Industry Revenue Breakdown (Million, %) by Region 2024 & 2032
- Figure 2: Global MEA Power Industry Volume Breakdown (Gigawatte, %) by Region 2024 & 2032
- Figure 3: North America MEA Power Industry Revenue (Million), by Country 2024 & 2032
- Figure 4: North America MEA Power Industry Volume (Gigawatte), by Country 2024 & 2032
- Figure 5: North America MEA Power Industry Revenue Share (%), by Country 2024 & 2032
- Figure 6: North America MEA Power Industry Volume Share (%), by Country 2024 & 2032
- Figure 7: Europe MEA Power Industry Revenue (Million), by Country 2024 & 2032
- Figure 8: Europe MEA Power Industry Volume (Gigawatte), by Country 2024 & 2032
- Figure 9: Europe MEA Power Industry Revenue Share (%), by Country 2024 & 2032
- Figure 10: Europe MEA Power Industry Volume Share (%), by Country 2024 & 2032
- Figure 11: Asia Pacific MEA Power Industry Revenue (Million), by Country 2024 & 2032
- Figure 12: Asia Pacific MEA Power Industry Volume (Gigawatte), by Country 2024 & 2032
- Figure 13: Asia Pacific MEA Power Industry Revenue Share (%), by Country 2024 & 2032
- Figure 14: Asia Pacific MEA Power Industry Volume Share (%), by Country 2024 & 2032
- Figure 15: South America MEA Power Industry Revenue (Million), by Country 2024 & 2032
- Figure 16: South America MEA Power Industry Volume (Gigawatte), by Country 2024 & 2032
- Figure 17: South America MEA Power Industry Revenue Share (%), by Country 2024 & 2032
- Figure 18: South America MEA Power Industry Volume Share (%), by Country 2024 & 2032
- Figure 19: MEA MEA Power Industry Revenue (Million), by Country 2024 & 2032
- Figure 20: MEA MEA Power Industry Volume (Gigawatte), by Country 2024 & 2032
- Figure 21: MEA MEA Power Industry Revenue Share (%), by Country 2024 & 2032
- Figure 22: MEA MEA Power Industry Volume Share (%), by Country 2024 & 2032
- Figure 23: North America MEA Power Industry Revenue (Million), by Generation - Source 2024 & 2032
- Figure 24: North America MEA Power Industry Volume (Gigawatte), by Generation - Source 2024 & 2032
- Figure 25: North America MEA Power Industry Revenue Share (%), by Generation - Source 2024 & 2032
- Figure 26: North America MEA Power Industry Volume Share (%), by Generation - Source 2024 & 2032
- Figure 27: North America MEA Power Industry Revenue (Million), by Transmission and Distribution 2024 & 2032
- Figure 28: North America MEA Power Industry Volume (Gigawatte), by Transmission and Distribution 2024 & 2032
- Figure 29: North America MEA Power Industry Revenue Share (%), by Transmission and Distribution 2024 & 2032
- Figure 30: North America MEA Power Industry Volume Share (%), by Transmission and Distribution 2024 & 2032
- Figure 31: North America MEA Power Industry Revenue (Million), by Geogrpahy 2024 & 2032
- Figure 32: North America MEA Power Industry Volume (Gigawatte), by Geogrpahy 2024 & 2032
- Figure 33: North America MEA Power Industry Revenue Share (%), by Geogrpahy 2024 & 2032
- Figure 34: North America MEA Power Industry Volume Share (%), by Geogrpahy 2024 & 2032
- Figure 35: North America MEA Power Industry Revenue (Million), by Country 2024 & 2032
- Figure 36: North America MEA Power Industry Volume (Gigawatte), by Country 2024 & 2032
- Figure 37: North America MEA Power Industry Revenue Share (%), by Country 2024 & 2032
- Figure 38: North America MEA Power Industry Volume Share (%), by Country 2024 & 2032
- Figure 39: South America MEA Power Industry Revenue (Million), by Generation - Source 2024 & 2032
- Figure 40: South America MEA Power Industry Volume (Gigawatte), by Generation - Source 2024 & 2032
- Figure 41: South America MEA Power Industry Revenue Share (%), by Generation - Source 2024 & 2032
- Figure 42: South America MEA Power Industry Volume Share (%), by Generation - Source 2024 & 2032
- Figure 43: South America MEA Power Industry Revenue (Million), by Transmission and Distribution 2024 & 2032
- Figure 44: South America MEA Power Industry Volume (Gigawatte), by Transmission and Distribution 2024 & 2032
- Figure 45: South America MEA Power Industry Revenue Share (%), by Transmission and Distribution 2024 & 2032
- Figure 46: South America MEA Power Industry Volume Share (%), by Transmission and Distribution 2024 & 2032
- Figure 47: South America MEA Power Industry Revenue (Million), by Geogrpahy 2024 & 2032
- Figure 48: South America MEA Power Industry Volume (Gigawatte), by Geogrpahy 2024 & 2032
- Figure 49: South America MEA Power Industry Revenue Share (%), by Geogrpahy 2024 & 2032
- Figure 50: South America MEA Power Industry Volume Share (%), by Geogrpahy 2024 & 2032
- Figure 51: South America MEA Power Industry Revenue (Million), by Country 2024 & 2032
- Figure 52: South America MEA Power Industry Volume (Gigawatte), by Country 2024 & 2032
- Figure 53: South America MEA Power Industry Revenue Share (%), by Country 2024 & 2032
- Figure 54: South America MEA Power Industry Volume Share (%), by Country 2024 & 2032
- Figure 55: Europe MEA Power Industry Revenue (Million), by Generation - Source 2024 & 2032
- Figure 56: Europe MEA Power Industry Volume (Gigawatte), by Generation - Source 2024 & 2032
- Figure 57: Europe MEA Power Industry Revenue Share (%), by Generation - Source 2024 & 2032
- Figure 58: Europe MEA Power Industry Volume Share (%), by Generation - Source 2024 & 2032
- Figure 59: Europe MEA Power Industry Revenue (Million), by Transmission and Distribution 2024 & 2032
- Figure 60: Europe MEA Power Industry Volume (Gigawatte), by Transmission and Distribution 2024 & 2032
- Figure 61: Europe MEA Power Industry Revenue Share (%), by Transmission and Distribution 2024 & 2032
- Figure 62: Europe MEA Power Industry Volume Share (%), by Transmission and Distribution 2024 & 2032
- Figure 63: Europe MEA Power Industry Revenue (Million), by Geogrpahy 2024 & 2032
- Figure 64: Europe MEA Power Industry Volume (Gigawatte), by Geogrpahy 2024 & 2032
- Figure 65: Europe MEA Power Industry Revenue Share (%), by Geogrpahy 2024 & 2032
- Figure 66: Europe MEA Power Industry Volume Share (%), by Geogrpahy 2024 & 2032
- Figure 67: Europe MEA Power Industry Revenue (Million), by Country 2024 & 2032
- Figure 68: Europe MEA Power Industry Volume (Gigawatte), by Country 2024 & 2032
- Figure 69: Europe MEA Power Industry Revenue Share (%), by Country 2024 & 2032
- Figure 70: Europe MEA Power Industry Volume Share (%), by Country 2024 & 2032
- Figure 71: Middle East & Africa MEA Power Industry Revenue (Million), by Generation - Source 2024 & 2032
- Figure 72: Middle East & Africa MEA Power Industry Volume (Gigawatte), by Generation - Source 2024 & 2032
- Figure 73: Middle East & Africa MEA Power Industry Revenue Share (%), by Generation - Source 2024 & 2032
- Figure 74: Middle East & Africa MEA Power Industry Volume Share (%), by Generation - Source 2024 & 2032
- Figure 75: Middle East & Africa MEA Power Industry Revenue (Million), by Transmission and Distribution 2024 & 2032
- Figure 76: Middle East & Africa MEA Power Industry Volume (Gigawatte), by Transmission and Distribution 2024 & 2032
- Figure 77: Middle East & Africa MEA Power Industry Revenue Share (%), by Transmission and Distribution 2024 & 2032
- Figure 78: Middle East & Africa MEA Power Industry Volume Share (%), by Transmission and Distribution 2024 & 2032
- Figure 79: Middle East & Africa MEA Power Industry Revenue (Million), by Geogrpahy 2024 & 2032
- Figure 80: Middle East & Africa MEA Power Industry Volume (Gigawatte), by Geogrpahy 2024 & 2032
- Figure 81: Middle East & Africa MEA Power Industry Revenue Share (%), by Geogrpahy 2024 & 2032
- Figure 82: Middle East & Africa MEA Power Industry Volume Share (%), by Geogrpahy 2024 & 2032
- Figure 83: Middle East & Africa MEA Power Industry Revenue (Million), by Country 2024 & 2032
- Figure 84: Middle East & Africa MEA Power Industry Volume (Gigawatte), by Country 2024 & 2032
- Figure 85: Middle East & Africa MEA Power Industry Revenue Share (%), by Country 2024 & 2032
- Figure 86: Middle East & Africa MEA Power Industry Volume Share (%), by Country 2024 & 2032
- Figure 87: Asia Pacific MEA Power Industry Revenue (Million), by Generation - Source 2024 & 2032
- Figure 88: Asia Pacific MEA Power Industry Volume (Gigawatte), by Generation - Source 2024 & 2032
- Figure 89: Asia Pacific MEA Power Industry Revenue Share (%), by Generation - Source 2024 & 2032
- Figure 90: Asia Pacific MEA Power Industry Volume Share (%), by Generation - Source 2024 & 2032
- Figure 91: Asia Pacific MEA Power Industry Revenue (Million), by Transmission and Distribution 2024 & 2032
- Figure 92: Asia Pacific MEA Power Industry Volume (Gigawatte), by Transmission and Distribution 2024 & 2032
- Figure 93: Asia Pacific MEA Power Industry Revenue Share (%), by Transmission and Distribution 2024 & 2032
- Figure 94: Asia Pacific MEA Power Industry Volume Share (%), by Transmission and Distribution 2024 & 2032
- Figure 95: Asia Pacific MEA Power Industry Revenue (Million), by Geogrpahy 2024 & 2032
- Figure 96: Asia Pacific MEA Power Industry Volume (Gigawatte), by Geogrpahy 2024 & 2032
- Figure 97: Asia Pacific MEA Power Industry Revenue Share (%), by Geogrpahy 2024 & 2032
- Figure 98: Asia Pacific MEA Power Industry Volume Share (%), by Geogrpahy 2024 & 2032
- Figure 99: Asia Pacific MEA Power Industry Revenue (Million), by Country 2024 & 2032
- Figure 100: Asia Pacific MEA Power Industry Volume (Gigawatte), by Country 2024 & 2032
- Figure 101: Asia Pacific MEA Power Industry Revenue Share (%), by Country 2024 & 2032
- Figure 102: Asia Pacific MEA Power Industry Volume Share (%), by Country 2024 & 2032
List of Tables
- Table 1: Global MEA Power Industry Revenue Million Forecast, by Region 2019 & 2032
- Table 2: Global MEA Power Industry Volume Gigawatte Forecast, by Region 2019 & 2032
- Table 3: Global MEA Power Industry Revenue Million Forecast, by Generation - Source 2019 & 2032
- Table 4: Global MEA Power Industry Volume Gigawatte Forecast, by Generation - Source 2019 & 2032
- Table 5: Global MEA Power Industry Revenue Million Forecast, by Transmission and Distribution 2019 & 2032
- Table 6: Global MEA Power Industry Volume Gigawatte Forecast, by Transmission and Distribution 2019 & 2032
- Table 7: Global MEA Power Industry Revenue Million Forecast, by Geogrpahy 2019 & 2032
- Table 8: Global MEA Power Industry Volume Gigawatte Forecast, by Geogrpahy 2019 & 2032
- Table 9: Global MEA Power Industry Revenue Million Forecast, by Region 2019 & 2032
- Table 10: Global MEA Power Industry Volume Gigawatte Forecast, by Region 2019 & 2032
- Table 11: Global MEA Power Industry Revenue Million Forecast, by Country 2019 & 2032
- Table 12: Global MEA Power Industry Volume Gigawatte Forecast, by Country 2019 & 2032
- Table 13: United States MEA Power Industry Revenue (Million) Forecast, by Application 2019 & 2032
- Table 14: United States MEA Power Industry Volume (Gigawatte) Forecast, by Application 2019 & 2032
- Table 15: Canada MEA Power Industry Revenue (Million) Forecast, by Application 2019 & 2032
- Table 16: Canada MEA Power Industry Volume (Gigawatte) Forecast, by Application 2019 & 2032
- Table 17: Mexico MEA Power Industry Revenue (Million) Forecast, by Application 2019 & 2032
- Table 18: Mexico MEA Power Industry Volume (Gigawatte) Forecast, by Application 2019 & 2032
- Table 19: Global MEA Power Industry Revenue Million Forecast, by Country 2019 & 2032
- Table 20: Global MEA Power Industry Volume Gigawatte Forecast, by Country 2019 & 2032
- Table 21: Germany MEA Power Industry Revenue (Million) Forecast, by Application 2019 & 2032
- Table 22: Germany MEA Power Industry Volume (Gigawatte) Forecast, by Application 2019 & 2032
- Table 23: United Kingdom MEA Power Industry Revenue (Million) Forecast, by Application 2019 & 2032
- Table 24: United Kingdom MEA Power Industry Volume (Gigawatte) Forecast, by Application 2019 & 2032
- Table 25: France MEA Power Industry Revenue (Million) Forecast, by Application 2019 & 2032
- Table 26: France MEA Power Industry Volume (Gigawatte) Forecast, by Application 2019 & 2032
- Table 27: Spain MEA Power Industry Revenue (Million) Forecast, by Application 2019 & 2032
- Table 28: Spain MEA Power Industry Volume (Gigawatte) Forecast, by Application 2019 & 2032
- Table 29: Italy MEA Power Industry Revenue (Million) Forecast, by Application 2019 & 2032
- Table 30: Italy MEA Power Industry Volume (Gigawatte) Forecast, by Application 2019 & 2032
- Table 31: Spain MEA Power Industry Revenue (Million) Forecast, by Application 2019 & 2032
- Table 32: Spain MEA Power Industry Volume (Gigawatte) Forecast, by Application 2019 & 2032
- Table 33: Belgium MEA Power Industry Revenue (Million) Forecast, by Application 2019 & 2032
- Table 34: Belgium MEA Power Industry Volume (Gigawatte) Forecast, by Application 2019 & 2032
- Table 35: Netherland MEA Power Industry Revenue (Million) Forecast, by Application 2019 & 2032
- Table 36: Netherland MEA Power Industry Volume (Gigawatte) Forecast, by Application 2019 & 2032
- Table 37: Nordics MEA Power Industry Revenue (Million) Forecast, by Application 2019 & 2032
- Table 38: Nordics MEA Power Industry Volume (Gigawatte) Forecast, by Application 2019 & 2032
- Table 39: Rest of Europe MEA Power Industry Revenue (Million) Forecast, by Application 2019 & 2032
- Table 40: Rest of Europe MEA Power Industry Volume (Gigawatte) Forecast, by Application 2019 & 2032
- Table 41: Global MEA Power Industry Revenue Million Forecast, by Country 2019 & 2032
- Table 42: Global MEA Power Industry Volume Gigawatte Forecast, by Country 2019 & 2032
- Table 43: China MEA Power Industry Revenue (Million) Forecast, by Application 2019 & 2032
- Table 44: China MEA Power Industry Volume (Gigawatte) Forecast, by Application 2019 & 2032
- Table 45: Japan MEA Power Industry Revenue (Million) Forecast, by Application 2019 & 2032
- Table 46: Japan MEA Power Industry Volume (Gigawatte) Forecast, by Application 2019 & 2032
- Table 47: India MEA Power Industry Revenue (Million) Forecast, by Application 2019 & 2032
- Table 48: India MEA Power Industry Volume (Gigawatte) Forecast, by Application 2019 & 2032
- Table 49: South Korea MEA Power Industry Revenue (Million) Forecast, by Application 2019 & 2032
- Table 50: South Korea MEA Power Industry Volume (Gigawatte) Forecast, by Application 2019 & 2032
- Table 51: Southeast Asia MEA Power Industry Revenue (Million) Forecast, by Application 2019 & 2032
- Table 52: Southeast Asia MEA Power Industry Volume (Gigawatte) Forecast, by Application 2019 & 2032
- Table 53: Australia MEA Power Industry Revenue (Million) Forecast, by Application 2019 & 2032
- Table 54: Australia MEA Power Industry Volume (Gigawatte) Forecast, by Application 2019 & 2032
- Table 55: Indonesia MEA Power Industry Revenue (Million) Forecast, by Application 2019 & 2032
- Table 56: Indonesia MEA Power Industry Volume (Gigawatte) Forecast, by Application 2019 & 2032
- Table 57: Phillipes MEA Power Industry Revenue (Million) Forecast, by Application 2019 & 2032
- Table 58: Phillipes MEA Power Industry Volume (Gigawatte) Forecast, by Application 2019 & 2032
- Table 59: Singapore MEA Power Industry Revenue (Million) Forecast, by Application 2019 & 2032
- Table 60: Singapore MEA Power Industry Volume (Gigawatte) Forecast, by Application 2019 & 2032
- Table 61: Thailandc MEA Power Industry Revenue (Million) Forecast, by Application 2019 & 2032
- Table 62: Thailandc MEA Power Industry Volume (Gigawatte) Forecast, by Application 2019 & 2032
- Table 63: Rest of Asia Pacific MEA Power Industry Revenue (Million) Forecast, by Application 2019 & 2032
- Table 64: Rest of Asia Pacific MEA Power Industry Volume (Gigawatte) Forecast, by Application 2019 & 2032
- Table 65: Global MEA Power Industry Revenue Million Forecast, by Country 2019 & 2032
- Table 66: Global MEA Power Industry Volume Gigawatte Forecast, by Country 2019 & 2032
- Table 67: Brazil MEA Power Industry Revenue (Million) Forecast, by Application 2019 & 2032
- Table 68: Brazil MEA Power Industry Volume (Gigawatte) Forecast, by Application 2019 & 2032
- Table 69: Argentina MEA Power Industry Revenue (Million) Forecast, by Application 2019 & 2032
- Table 70: Argentina MEA Power Industry Volume (Gigawatte) Forecast, by Application 2019 & 2032
- Table 71: Peru MEA Power Industry Revenue (Million) Forecast, by Application 2019 & 2032
- Table 72: Peru MEA Power Industry Volume (Gigawatte) Forecast, by Application 2019 & 2032
- Table 73: Chile MEA Power Industry Revenue (Million) Forecast, by Application 2019 & 2032
- Table 74: Chile MEA Power Industry Volume (Gigawatte) Forecast, by Application 2019 & 2032
- Table 75: Colombia MEA Power Industry Revenue (Million) Forecast, by Application 2019 & 2032
- Table 76: Colombia MEA Power Industry Volume (Gigawatte) Forecast, by Application 2019 & 2032
- Table 77: Ecuador MEA Power Industry Revenue (Million) Forecast, by Application 2019 & 2032
- Table 78: Ecuador MEA Power Industry Volume (Gigawatte) Forecast, by Application 2019 & 2032
- Table 79: Venezuela MEA Power Industry Revenue (Million) Forecast, by Application 2019 & 2032
- Table 80: Venezuela MEA Power Industry Volume (Gigawatte) Forecast, by Application 2019 & 2032
- Table 81: Rest of South America MEA Power Industry Revenue (Million) Forecast, by Application 2019 & 2032
- Table 82: Rest of South America MEA Power Industry Volume (Gigawatte) Forecast, by Application 2019 & 2032
- Table 83: Global MEA Power Industry Revenue Million Forecast, by Country 2019 & 2032
- Table 84: Global MEA Power Industry Volume Gigawatte Forecast, by Country 2019 & 2032
- Table 85: United Arab Emirates MEA Power Industry Revenue (Million) Forecast, by Application 2019 & 2032
- Table 86: United Arab Emirates MEA Power Industry Volume (Gigawatte) Forecast, by Application 2019 & 2032
- Table 87: Saudi Arabia MEA Power Industry Revenue (Million) Forecast, by Application 2019 & 2032
- Table 88: Saudi Arabia MEA Power Industry Volume (Gigawatte) Forecast, by Application 2019 & 2032
- Table 89: South Africa MEA Power Industry Revenue (Million) Forecast, by Application 2019 & 2032
- Table 90: South Africa MEA Power Industry Volume (Gigawatte) Forecast, by Application 2019 & 2032
- Table 91: Rest of Middle East and Africa MEA Power Industry Revenue (Million) Forecast, by Application 2019 & 2032
- Table 92: Rest of Middle East and Africa MEA Power Industry Volume (Gigawatte) Forecast, by Application 2019 & 2032
- Table 93: Global MEA Power Industry Revenue Million Forecast, by Generation - Source 2019 & 2032
- Table 94: Global MEA Power Industry Volume Gigawatte Forecast, by Generation - Source 2019 & 2032
- Table 95: Global MEA Power Industry Revenue Million Forecast, by Transmission and Distribution 2019 & 2032
- Table 96: Global MEA Power Industry Volume Gigawatte Forecast, by Transmission and Distribution 2019 & 2032
- Table 97: Global MEA Power Industry Revenue Million Forecast, by Geogrpahy 2019 & 2032
- Table 98: Global MEA Power Industry Volume Gigawatte Forecast, by Geogrpahy 2019 & 2032
- Table 99: Global MEA Power Industry Revenue Million Forecast, by Country 2019 & 2032
- Table 100: Global MEA Power Industry Volume Gigawatte Forecast, by Country 2019 & 2032
- Table 101: United States MEA Power Industry Revenue (Million) Forecast, by Application 2019 & 2032
- Table 102: United States MEA Power Industry Volume (Gigawatte) Forecast, by Application 2019 & 2032
- Table 103: Canada MEA Power Industry Revenue (Million) Forecast, by Application 2019 & 2032
- Table 104: Canada MEA Power Industry Volume (Gigawatte) Forecast, by Application 2019 & 2032
- Table 105: Mexico MEA Power Industry Revenue (Million) Forecast, by Application 2019 & 2032
- Table 106: Mexico MEA Power Industry Volume (Gigawatte) Forecast, by Application 2019 & 2032
- Table 107: Global MEA Power Industry Revenue Million Forecast, by Generation - Source 2019 & 2032
- Table 108: Global MEA Power Industry Volume Gigawatte Forecast, by Generation - Source 2019 & 2032
- Table 109: Global MEA Power Industry Revenue Million Forecast, by Transmission and Distribution 2019 & 2032
- Table 110: Global MEA Power Industry Volume Gigawatte Forecast, by Transmission and Distribution 2019 & 2032
- Table 111: Global MEA Power Industry Revenue Million Forecast, by Geogrpahy 2019 & 2032
- Table 112: Global MEA Power Industry Volume Gigawatte Forecast, by Geogrpahy 2019 & 2032
- Table 113: Global MEA Power Industry Revenue Million Forecast, by Country 2019 & 2032
- Table 114: Global MEA Power Industry Volume Gigawatte Forecast, by Country 2019 & 2032
- Table 115: Brazil MEA Power Industry Revenue (Million) Forecast, by Application 2019 & 2032
- Table 116: Brazil MEA Power Industry Volume (Gigawatte) Forecast, by Application 2019 & 2032
- Table 117: Argentina MEA Power Industry Revenue (Million) Forecast, by Application 2019 & 2032
- Table 118: Argentina MEA Power Industry Volume (Gigawatte) Forecast, by Application 2019 & 2032
- Table 119: Rest of South America MEA Power Industry Revenue (Million) Forecast, by Application 2019 & 2032
- Table 120: Rest of South America MEA Power Industry Volume (Gigawatte) Forecast, by Application 2019 & 2032
- Table 121: Global MEA Power Industry Revenue Million Forecast, by Generation - Source 2019 & 2032
- Table 122: Global MEA Power Industry Volume Gigawatte Forecast, by Generation - Source 2019 & 2032
- Table 123: Global MEA Power Industry Revenue Million Forecast, by Transmission and Distribution 2019 & 2032
- Table 124: Global MEA Power Industry Volume Gigawatte Forecast, by Transmission and Distribution 2019 & 2032
- Table 125: Global MEA Power Industry Revenue Million Forecast, by Geogrpahy 2019 & 2032
- Table 126: Global MEA Power Industry Volume Gigawatte Forecast, by Geogrpahy 2019 & 2032
- Table 127: Global MEA Power Industry Revenue Million Forecast, by Country 2019 & 2032
- Table 128: Global MEA Power Industry Volume Gigawatte Forecast, by Country 2019 & 2032
- Table 129: United Kingdom MEA Power Industry Revenue (Million) Forecast, by Application 2019 & 2032
- Table 130: United Kingdom MEA Power Industry Volume (Gigawatte) Forecast, by Application 2019 & 2032
- Table 131: Germany MEA Power Industry Revenue (Million) Forecast, by Application 2019 & 2032
- Table 132: Germany MEA Power Industry Volume (Gigawatte) Forecast, by Application 2019 & 2032
- Table 133: France MEA Power Industry Revenue (Million) Forecast, by Application 2019 & 2032
- Table 134: France MEA Power Industry Volume (Gigawatte) Forecast, by Application 2019 & 2032
- Table 135: Italy MEA Power Industry Revenue (Million) Forecast, by Application 2019 & 2032
- Table 136: Italy MEA Power Industry Volume (Gigawatte) Forecast, by Application 2019 & 2032
- Table 137: Spain MEA Power Industry Revenue (Million) Forecast, by Application 2019 & 2032
- Table 138: Spain MEA Power Industry Volume (Gigawatte) Forecast, by Application 2019 & 2032
- Table 139: Russia MEA Power Industry Revenue (Million) Forecast, by Application 2019 & 2032
- Table 140: Russia MEA Power Industry Volume (Gigawatte) Forecast, by Application 2019 & 2032
- Table 141: Benelux MEA Power Industry Revenue (Million) Forecast, by Application 2019 & 2032
- Table 142: Benelux MEA Power Industry Volume (Gigawatte) Forecast, by Application 2019 & 2032
- Table 143: Nordics MEA Power Industry Revenue (Million) Forecast, by Application 2019 & 2032
- Table 144: Nordics MEA Power Industry Volume (Gigawatte) Forecast, by Application 2019 & 2032
- Table 145: Rest of Europe MEA Power Industry Revenue (Million) Forecast, by Application 2019 & 2032
- Table 146: Rest of Europe MEA Power Industry Volume (Gigawatte) Forecast, by Application 2019 & 2032
- Table 147: Global MEA Power Industry Revenue Million Forecast, by Generation - Source 2019 & 2032
- Table 148: Global MEA Power Industry Volume Gigawatte Forecast, by Generation - Source 2019 & 2032
- Table 149: Global MEA Power Industry Revenue Million Forecast, by Transmission and Distribution 2019 & 2032
- Table 150: Global MEA Power Industry Volume Gigawatte Forecast, by Transmission and Distribution 2019 & 2032
- Table 151: Global MEA Power Industry Revenue Million Forecast, by Geogrpahy 2019 & 2032
- Table 152: Global MEA Power Industry Volume Gigawatte Forecast, by Geogrpahy 2019 & 2032
- Table 153: Global MEA Power Industry Revenue Million Forecast, by Country 2019 & 2032
- Table 154: Global MEA Power Industry Volume Gigawatte Forecast, by Country 2019 & 2032
- Table 155: Turkey MEA Power Industry Revenue (Million) Forecast, by Application 2019 & 2032
- Table 156: Turkey MEA Power Industry Volume (Gigawatte) Forecast, by Application 2019 & 2032
- Table 157: Israel MEA Power Industry Revenue (Million) Forecast, by Application 2019 & 2032
- Table 158: Israel MEA Power Industry Volume (Gigawatte) Forecast, by Application 2019 & 2032
- Table 159: GCC MEA Power Industry Revenue (Million) Forecast, by Application 2019 & 2032
- Table 160: GCC MEA Power Industry Volume (Gigawatte) Forecast, by Application 2019 & 2032
- Table 161: North Africa MEA Power Industry Revenue (Million) Forecast, by Application 2019 & 2032
- Table 162: North Africa MEA Power Industry Volume (Gigawatte) Forecast, by Application 2019 & 2032
- Table 163: South Africa MEA Power Industry Revenue (Million) Forecast, by Application 2019 & 2032
- Table 164: South Africa MEA Power Industry Volume (Gigawatte) Forecast, by Application 2019 & 2032
- Table 165: Rest of Middle East & Africa MEA Power Industry Revenue (Million) Forecast, by Application 2019 & 2032
- Table 166: Rest of Middle East & Africa MEA Power Industry Volume (Gigawatte) Forecast, by Application 2019 & 2032
- Table 167: Global MEA Power Industry Revenue Million Forecast, by Generation - Source 2019 & 2032
- Table 168: Global MEA Power Industry Volume Gigawatte Forecast, by Generation - Source 2019 & 2032
- Table 169: Global MEA Power Industry Revenue Million Forecast, by Transmission and Distribution 2019 & 2032
- Table 170: Global MEA Power Industry Volume Gigawatte Forecast, by Transmission and Distribution 2019 & 2032
- Table 171: Global MEA Power Industry Revenue Million Forecast, by Geogrpahy 2019 & 2032
- Table 172: Global MEA Power Industry Volume Gigawatte Forecast, by Geogrpahy 2019 & 2032
- Table 173: Global MEA Power Industry Revenue Million Forecast, by Country 2019 & 2032
- Table 174: Global MEA Power Industry Volume Gigawatte Forecast, by Country 2019 & 2032
- Table 175: China MEA Power Industry Revenue (Million) Forecast, by Application 2019 & 2032
- Table 176: China MEA Power Industry Volume (Gigawatte) Forecast, by Application 2019 & 2032
- Table 177: India MEA Power Industry Revenue (Million) Forecast, by Application 2019 & 2032
- Table 178: India MEA Power Industry Volume (Gigawatte) Forecast, by Application 2019 & 2032
- Table 179: Japan MEA Power Industry Revenue (Million) Forecast, by Application 2019 & 2032
- Table 180: Japan MEA Power Industry Volume (Gigawatte) Forecast, by Application 2019 & 2032
- Table 181: South Korea MEA Power Industry Revenue (Million) Forecast, by Application 2019 & 2032
- Table 182: South Korea MEA Power Industry Volume (Gigawatte) Forecast, by Application 2019 & 2032
- Table 183: ASEAN MEA Power Industry Revenue (Million) Forecast, by Application 2019 & 2032
- Table 184: ASEAN MEA Power Industry Volume (Gigawatte) Forecast, by Application 2019 & 2032
- Table 185: Oceania MEA Power Industry Revenue (Million) Forecast, by Application 2019 & 2032
- Table 186: Oceania MEA Power Industry Volume (Gigawatte) Forecast, by Application 2019 & 2032
- Table 187: Rest of Asia Pacific MEA Power Industry Revenue (Million) Forecast, by Application 2019 & 2032
- Table 188: Rest of Asia Pacific MEA Power Industry Volume (Gigawatte) Forecast, by Application 2019 & 2032
Frequently Asked Questions
1. What is the projected Compound Annual Growth Rate (CAGR) of the MEA Power Industry?
The projected CAGR is approximately > 3.00%.
2. Which companies are prominent players in the MEA Power Industry?
Key companies in the market include General Electric Company, JinkoSolar Holding Co Ltd, First Solar Inc, Enerwhere Sustainable Energy DMCC, Saudi Electricity Company, Juwi Solar Inc, Eskom Holdings SOC Ltd, Wuxi Suntech Power Co Ltd, Dubai Electricity & Water Authority, ACWA POWER BARKA SAOG, Siemens AG, Canadian Solar Inc, AGE Technologies JHB (Pty) Limited.
3. What are the main segments of the MEA Power Industry?
The market segments include Generation - Source, Transmission and Distribution, Geogrpahy.
4. Can you provide details about the market size?
The market size is estimated to be USD XX Million as of 2022.
5. What are some drivers contributing to market growth?
4.; Demand for Solar Photovoltaic Installations4.; Growing Investments.
6. What are the notable trends driving market growth?
Thermal Sources to Dominate the Market.
7. Are there any restraints impacting market growth?
4.; Increasing Wind Energy Installations.
8. Can you provide examples of recent developments in the market?
N/A
9. What pricing options are available for accessing the report?
Pricing options include single-user, multi-user, and enterprise licenses priced at USD 4750, USD 5250, and USD 8750 respectively.
10. Is the market size provided in terms of value or volume?
The market size is provided in terms of value, measured in Million and volume, measured in Gigawatte.
11. Are there any specific market keywords associated with the report?
Yes, the market keyword associated with the report is "MEA Power Industry," which aids in identifying and referencing the specific market segment covered.
12. How do I determine which pricing option suits my needs best?
The pricing options vary based on user requirements and access needs. Individual users may opt for single-user licenses, while businesses requiring broader access may choose multi-user or enterprise licenses for cost-effective access to the report.
13. Are there any additional resources or data provided in the MEA Power Industry report?
While the report offers comprehensive insights, it's advisable to review the specific contents or supplementary materials provided to ascertain if additional resources or data are available.
14. How can I stay updated on further developments or reports in the MEA Power Industry?
To stay informed about further developments, trends, and reports in the MEA Power Industry, consider subscribing to industry newsletters, following relevant companies and organizations, or regularly checking reputable industry news sources and publications.
Methodology
Step 1 - Identification of Relevant Samples Size from Population Database


Step 2 - Approaches for Defining Global Market Size (Value, Volume* & Price*)

Note*: In applicable scenarios
Step 3 - Data Sources
Primary Research
- Web Analytics
- Survey Reports
- Research Institute
- Latest Research Reports
- Opinion Leaders
Secondary Research
- Annual Reports
- White Paper
- Latest Press Release
- Industry Association
- Paid Database
- Investor Presentations

Step 4 - Data Triangulation
Involves using different sources of information in order to increase the validity of a study
These sources are likely to be stakeholders in a program - participants, other researchers, program staff, other community members, and so on.
Then we put all data in single framework & apply various statistical tools to find out the dynamic on the market.
During the analysis stage, feedback from the stakeholder groups would be compared to determine areas of agreement as well as areas of divergence


