
Key Insights
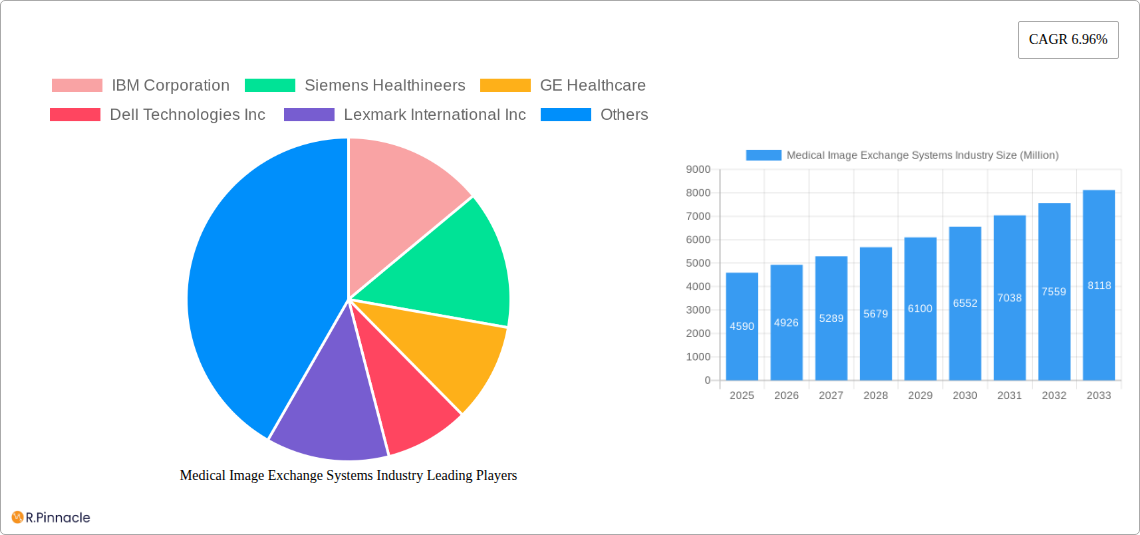
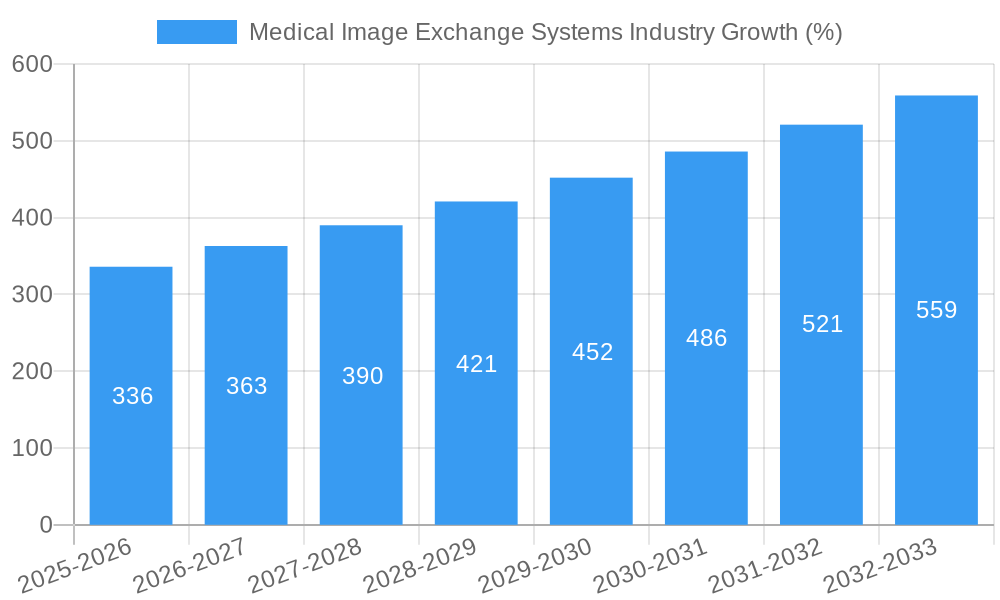
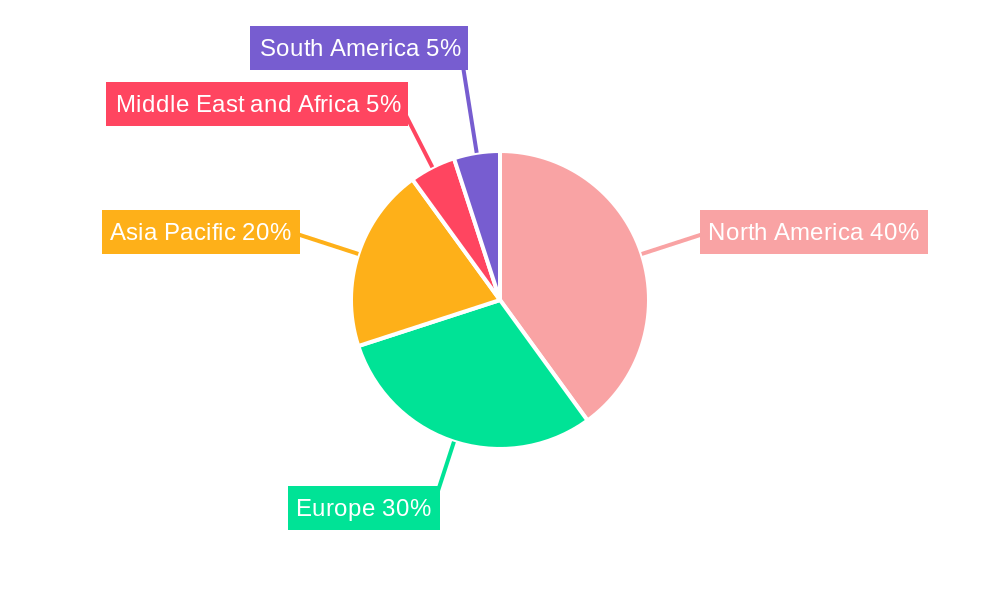
The Medical Image Exchange Systems (MIES) market is experiencing robust growth, projected to reach \$4.59 billion in 2025 and exhibiting a Compound Annual Growth Rate (CAGR) of 6.96% from 2025 to 2033. This expansion is fueled by several key drivers. The increasing prevalence of chronic diseases necessitates more sophisticated diagnostic imaging, driving demand for efficient image sharing and management systems. Furthermore, the rising adoption of telehealth and remote patient monitoring increases the need for seamless integration of medical images across geographically dispersed healthcare providers. Technological advancements, such as the development of cloud-based PACS systems and improved interoperability standards like DICOM, are streamlining image exchange and enhancing collaboration among healthcare professionals. The shift towards value-based care models also incentivizes efficient workflow optimization, making MIES crucial for cost-effectiveness and improved patient outcomes. Growth is further supported by the rising investment in healthcare infrastructure and the increasing digitization of healthcare records in both developed and developing nations. However, challenges remain, including data security and privacy concerns, the high initial investment cost of implementing MIES, and the need for continuous technical support and training for healthcare staff. The market is segmented by end-user (hospitals, diagnostic centers, ambulatory surgery centers) and system type (Vendor Neutral Archive, PACS, other systems). Leading vendors, including IBM, Siemens Healthineers, GE Healthcare, and others, are constantly innovating and expanding their offerings to cater to the evolving needs of the market. The North American region currently holds a significant market share, driven by strong technological adoption and robust healthcare infrastructure; however, the Asia-Pacific region is expected to show the fastest growth in the forecast period due to increasing healthcare spending and growing awareness of advanced diagnostic techniques.
The competitive landscape of the MIES market is characterized by both established players and emerging technology providers. The established players leverage their extensive market presence, established customer relationships, and strong research and development capabilities to maintain market leadership. However, emerging companies are aggressively entering the market, bringing innovative solutions and competitive pricing strategies. This dynamic competition drives innovation and ensures continuous improvement in the functionalities and affordability of MIES solutions. Future growth will likely be driven by the increasing adoption of artificial intelligence (AI) in medical imaging analysis, improving diagnostic accuracy and efficiency. Furthermore, the focus on interoperability and standardization of image exchange protocols will continue to be a major factor shaping the market landscape. The integration of MIES with other healthcare information systems is crucial for creating a comprehensive and interconnected healthcare ecosystem.
Medical Image Exchange Systems Industry Report: 2019-2033
This comprehensive report provides an in-depth analysis of the Medical Image Exchange Systems industry, offering invaluable insights for industry professionals, investors, and strategic decision-makers. With a study period spanning 2019-2033, a base year of 2025, and a forecast period of 2025-2033, this report delivers a clear and concise understanding of market dynamics, growth drivers, and future opportunities. The report analyzes key players like IBM Corporation, Siemens Healthineers, GE Healthcare, and more, providing crucial data points for informed strategic planning. The total market size is projected to reach xx Million by 2033.
Medical Image Exchange Systems Industry Market Structure & Innovation Trends
The Medical Image Exchange Systems market exhibits a moderately concentrated structure, with key players like IBM Corporation, Siemens Healthineers, and GE Healthcare holding significant market share. However, the presence of numerous smaller players and ongoing technological advancements foster a dynamic competitive landscape. The market share of the top 5 players is estimated to be around xx%. Innovation is driven by the increasing demand for efficient image management, improved diagnostic capabilities, and enhanced interoperability across healthcare systems. Regulatory frameworks, such as HIPAA and GDPR, significantly influence system design and data security protocols. Product substitutes, primarily legacy systems and manual processes, are gradually being replaced by more efficient and technologically advanced solutions. The end-user demographics are dominated by hospitals, followed by diagnostic centers and ambulatory surgery centers. M&A activity in the industry has been moderate in recent years, with deal values averaging approximately xx Million per transaction. Key M&A activities have focused on enhancing technology portfolios and expanding market reach.
Medical Image Exchange Systems Industry Market Dynamics & Trends
The Medical Image Exchange Systems market is experiencing robust growth, with a projected Compound Annual Growth Rate (CAGR) of xx% during the forecast period (2025-2033). This growth is primarily driven by the rising prevalence of chronic diseases, technological advancements such as AI-powered image analysis, and the increasing adoption of cloud-based solutions. Technological disruptions, particularly in artificial intelligence (AI) and machine learning (ML), are transforming image analysis and diagnosis, significantly impacting efficiency and accuracy. Consumer preferences are shifting toward user-friendly interfaces, seamless integration with Electronic Health Records (EHRs), and enhanced security features. Competitive dynamics are characterized by ongoing product development, strategic partnerships, and a growing focus on providing comprehensive, integrated solutions. Market penetration is estimated at xx% in 2025, expected to increase significantly by 2033.
Dominant Regions & Segments in Medical Image Exchange Systems Industry
- Leading Region: North America currently holds the largest market share due to high healthcare expenditure, advanced technological infrastructure, and early adoption of new technologies.
- Leading Country: The United States is the dominant country within North America, driven by a large number of hospitals, diagnostic centers, and a strong focus on improving healthcare efficiency.
- Leading End-User Segment: Hospitals represent the largest segment due to their significant image data volumes and need for efficient management systems.
- Leading System Segment: Picture Archiving and Communication Systems (PACS) currently dominates due to widespread adoption and established integration into existing hospital workflows.
Key drivers for regional dominance include favorable economic policies supporting healthcare infrastructure development and robust regulatory frameworks ensuring data security. Growth in emerging markets is projected to be strong due to increasing healthcare investments and rising adoption of digital healthcare technologies.
Medical Image Exchange Systems Industry Product Innovations
Recent product innovations focus on cloud-based solutions, AI-powered image analysis, and enhanced interoperability features. Cloud-based systems improve scalability, accessibility, and cost-effectiveness, while AI algorithms offer faster and more accurate diagnoses. Improved interoperability ensures seamless data exchange across different healthcare systems and devices. These advancements provide competitive advantages by improving workflow efficiency, reducing operational costs, and enhancing diagnostic accuracy.
Report Scope & Segmentation Analysis
This report segments the Medical Image Exchange Systems market by end-user (Hospitals, Diagnostic Centers, Ambulatory Surgery Centers) and by system (Vendor Neutral Archive, PACS, Other Systems). Each segment's growth projections, market sizes, and competitive dynamics are analyzed in detail. Hospitals are expected to show consistent growth, followed by diagnostic centers and ambulatory surgery centers. The Vendor Neutral Archive (VNA) segment exhibits rapid growth owing to increasing demand for unified image repositories. PACS remains a dominant segment with steady growth driven by continuous upgrades and integrations. The "Other Systems" segment represents specialized solutions that continue to evolve and offer niche capabilities.
Key Drivers of Medical Image Exchange Systems Industry Growth
Several factors drive market growth:
- Technological advancements: AI-powered image analysis, cloud computing, and improved interoperability significantly enhance efficiency and accuracy.
- Rising healthcare expenditure: Increased investment in healthcare infrastructure and IT systems fuels market expansion.
- Stringent regulatory frameworks: Regulations mandating improved data security and interoperability drive adoption of advanced solutions.
Challenges in the Medical Image Exchange Systems Industry Sector
The industry faces several challenges:
- High initial investment costs: Implementing new systems can require significant upfront investment, hindering adoption for smaller healthcare providers.
- Data security and privacy concerns: Safeguarding sensitive patient data remains paramount and necessitates robust security measures.
- Integration complexities: Seamlessly integrating new systems with existing IT infrastructure can be complex and time-consuming.
Emerging Opportunities in Medical Image Exchange Systems Industry
Emerging opportunities include:
- Expansion in emerging markets: Growing healthcare infrastructure in developing nations presents significant market potential.
- Integration of AI and ML: Advanced algorithms drive significant improvements in diagnostic accuracy and efficiency.
- Development of specialized solutions: Tailored solutions addressing specific needs within niche medical specialties are gaining traction.
Leading Players in the Medical Image Exchange Systems Industry Market
- IBM Corporation
- Siemens Healthineers
- GE Healthcare
- Dell Technologies Inc
- Lexmark International Inc
- BridgeHead Software
- Koninklijke Philips NV
- Carestream Health Inc (Onex Corporation)
- McKesson Corporation
- Novarad Corporation
- Agfa-Gevaert Group
- Fujifilm Holdings Corporation
Key Developments in Medical Image Exchange Systems Industry Industry
- March 2022: Intelerad Medical Systems launched its new Enterprise Imaging and Informatics Suite, enhancing data integration and creating a vendor-neutral information hub. This development significantly impacts market dynamics by promoting interoperability and improved data access.
- March 2022: Philips introduced cloud-enabled enterprise imaging informatics and analytics solutions (Philips Health Suite Interoperability), offering a fully integrated cloud platform improving workflow efficiency and scalability, impacting market competition through improved offerings.
Future Outlook for Medical Image Exchange Systems Industry Market
The Medical Image Exchange Systems market is poised for continued strong growth, driven by technological innovation, increasing healthcare spending, and a rising demand for efficient and secure image management solutions. Strategic opportunities lie in developing AI-powered diagnostic tools, expanding into emerging markets, and fostering collaborations to enhance system interoperability and integration. The market will continue to evolve towards a more interconnected and intelligent healthcare ecosystem, benefiting both healthcare providers and patients.
Medical Image Exchange Systems Industry Segmentation
-
1. System
- 1.1. Vendor Neutral Archive
- 1.2. Picture Archiving and Communications System (PACS)
- 1.3. Other Systems
-
2. End-User
- 2.1. Hospitals
- 2.2. Diagnostic Centers
- 2.3. Ambulatory Surgery Centers
Medical Image Exchange Systems Industry Segmentation By Geography
-
1. North America
- 1.1. United States
- 1.2. Canada
- 1.3. Mexico
-
2. Europe
- 2.1. Germany
- 2.2. United Kingdom
- 2.3. France
- 2.4. Italy
- 2.5. Spain
- 2.6. Rest of Europe
-
3. Asia Pacific
- 3.1. China
- 3.2. Japan
- 3.3. India
- 3.4. Australia
- 3.5. South Korea
- 3.6. Rest of Asia Pacific
-
4. Middle East and Africa
- 4.1. GCC
- 4.2. South Africa
- 4.3. Rest of Middle East and Africa
-
5. South America
- 5.1. Brazil
- 5.2. Argentina
- 5.3. Rest of South America
Medical Image Exchange Systems Industry REPORT HIGHLIGHTS
| Aspects | Details |
|---|---|
| Study Period | 2019-2033 |
| Base Year | 2024 |
| Estimated Year | 2025 |
| Forecast Period | 2025-2033 |
| Historical Period | 2019-2024 |
| Growth Rate | CAGR of 6.96% from 2019-2033 |
| Segmentation |
|
Table of Contents
- 1. Introduction
- 1.1. Research Scope
- 1.2. Market Segmentation
- 1.3. Research Methodology
- 1.4. Definitions and Assumptions
- 2. Executive Summary
- 2.1. Introduction
- 3. Market Dynamics
- 3.1. Introduction
- 3.2. Market Drivers
- 3.2.1. Technological Innovations in the Diagnostic Imaging and Image Management; Rising Prevalence of Chronic Diseases; Emergence of Big Data in Healthcare
- 3.3. Market Restrains
- 3.3.1. Cost Associated With Implementation of Medical Imaging Management Solutions; Decrease In the Supply of SPECT and PET Systems due to the Shortage of Radioisotopes
- 3.4. Market Trends
- 3.4.1. Picture Archiving and Communications Systems (PACS) is Expected to Record Notable CAGR in the Market During the Forecast Period
- 4. Market Factor Analysis
- 4.1. Porters Five Forces
- 4.2. Supply/Value Chain
- 4.3. PESTEL analysis
- 4.4. Market Entropy
- 4.5. Patent/Trademark Analysis
- 5. Global Medical Image Exchange Systems Industry Analysis, Insights and Forecast, 2019-2031
- 5.1. Market Analysis, Insights and Forecast - by System
- 5.1.1. Vendor Neutral Archive
- 5.1.2. Picture Archiving and Communications System (PACS)
- 5.1.3. Other Systems
- 5.2. Market Analysis, Insights and Forecast - by End-User
- 5.2.1. Hospitals
- 5.2.2. Diagnostic Centers
- 5.2.3. Ambulatory Surgery Centers
- 5.3. Market Analysis, Insights and Forecast - by Region
- 5.3.1. North America
- 5.3.2. Europe
- 5.3.3. Asia Pacific
- 5.3.4. Middle East and Africa
- 5.3.5. South America
- 5.1. Market Analysis, Insights and Forecast - by System
- 6. North America Medical Image Exchange Systems Industry Analysis, Insights and Forecast, 2019-2031
- 6.1. Market Analysis, Insights and Forecast - by System
- 6.1.1. Vendor Neutral Archive
- 6.1.2. Picture Archiving and Communications System (PACS)
- 6.1.3. Other Systems
- 6.2. Market Analysis, Insights and Forecast - by End-User
- 6.2.1. Hospitals
- 6.2.2. Diagnostic Centers
- 6.2.3. Ambulatory Surgery Centers
- 6.1. Market Analysis, Insights and Forecast - by System
- 7. Europe Medical Image Exchange Systems Industry Analysis, Insights and Forecast, 2019-2031
- 7.1. Market Analysis, Insights and Forecast - by System
- 7.1.1. Vendor Neutral Archive
- 7.1.2. Picture Archiving and Communications System (PACS)
- 7.1.3. Other Systems
- 7.2. Market Analysis, Insights and Forecast - by End-User
- 7.2.1. Hospitals
- 7.2.2. Diagnostic Centers
- 7.2.3. Ambulatory Surgery Centers
- 7.1. Market Analysis, Insights and Forecast - by System
- 8. Asia Pacific Medical Image Exchange Systems Industry Analysis, Insights and Forecast, 2019-2031
- 8.1. Market Analysis, Insights and Forecast - by System
- 8.1.1. Vendor Neutral Archive
- 8.1.2. Picture Archiving and Communications System (PACS)
- 8.1.3. Other Systems
- 8.2. Market Analysis, Insights and Forecast - by End-User
- 8.2.1. Hospitals
- 8.2.2. Diagnostic Centers
- 8.2.3. Ambulatory Surgery Centers
- 8.1. Market Analysis, Insights and Forecast - by System
- 9. Middle East and Africa Medical Image Exchange Systems Industry Analysis, Insights and Forecast, 2019-2031
- 9.1. Market Analysis, Insights and Forecast - by System
- 9.1.1. Vendor Neutral Archive
- 9.1.2. Picture Archiving and Communications System (PACS)
- 9.1.3. Other Systems
- 9.2. Market Analysis, Insights and Forecast - by End-User
- 9.2.1. Hospitals
- 9.2.2. Diagnostic Centers
- 9.2.3. Ambulatory Surgery Centers
- 9.1. Market Analysis, Insights and Forecast - by System
- 10. South America Medical Image Exchange Systems Industry Analysis, Insights and Forecast, 2019-2031
- 10.1. Market Analysis, Insights and Forecast - by System
- 10.1.1. Vendor Neutral Archive
- 10.1.2. Picture Archiving and Communications System (PACS)
- 10.1.3. Other Systems
- 10.2. Market Analysis, Insights and Forecast - by End-User
- 10.2.1. Hospitals
- 10.2.2. Diagnostic Centers
- 10.2.3. Ambulatory Surgery Centers
- 10.1. Market Analysis, Insights and Forecast - by System
- 11. North America Medical Image Exchange Systems Industry Analysis, Insights and Forecast, 2019-2031
- 11.1. Market Analysis, Insights and Forecast - By Country/Sub-region
- 11.1.1 United States
- 11.1.2 Canada
- 11.1.3 Mexico
- 12. Europe Medical Image Exchange Systems Industry Analysis, Insights and Forecast, 2019-2031
- 12.1. Market Analysis, Insights and Forecast - By Country/Sub-region
- 12.1.1 Germany
- 12.1.2 United Kingdom
- 12.1.3 France
- 12.1.4 Italy
- 12.1.5 Spain
- 12.1.6 Rest of Europe
- 13. Asia Pacific Medical Image Exchange Systems Industry Analysis, Insights and Forecast, 2019-2031
- 13.1. Market Analysis, Insights and Forecast - By Country/Sub-region
- 13.1.1 China
- 13.1.2 Japan
- 13.1.3 India
- 13.1.4 Australia
- 13.1.5 South Korea
- 13.1.6 Rest of Asia Pacific
- 14. Middle East and Africa Medical Image Exchange Systems Industry Analysis, Insights and Forecast, 2019-2031
- 14.1. Market Analysis, Insights and Forecast - By Country/Sub-region
- 14.1.1 GCC
- 14.1.2 South Africa
- 14.1.3 Rest of Middle East and Africa
- 15. South America Medical Image Exchange Systems Industry Analysis, Insights and Forecast, 2019-2031
- 15.1. Market Analysis, Insights and Forecast - By Country/Sub-region
- 15.1.1 Brazil
- 15.1.2 Argentina
- 15.1.3 Rest of South America
- 16. Competitive Analysis
- 16.1. Global Market Share Analysis 2024
- 16.2. Company Profiles
- 16.2.1 IBM Corporation
- 16.2.1.1. Overview
- 16.2.1.2. Products
- 16.2.1.3. SWOT Analysis
- 16.2.1.4. Recent Developments
- 16.2.1.5. Financials (Based on Availability)
- 16.2.2 Siemens Healthineers
- 16.2.2.1. Overview
- 16.2.2.2. Products
- 16.2.2.3. SWOT Analysis
- 16.2.2.4. Recent Developments
- 16.2.2.5. Financials (Based on Availability)
- 16.2.3 GE Healthcare
- 16.2.3.1. Overview
- 16.2.3.2. Products
- 16.2.3.3. SWOT Analysis
- 16.2.3.4. Recent Developments
- 16.2.3.5. Financials (Based on Availability)
- 16.2.4 Dell Technologies Inc
- 16.2.4.1. Overview
- 16.2.4.2. Products
- 16.2.4.3. SWOT Analysis
- 16.2.4.4. Recent Developments
- 16.2.4.5. Financials (Based on Availability)
- 16.2.5 Lexmark International Inc
- 16.2.5.1. Overview
- 16.2.5.2. Products
- 16.2.5.3. SWOT Analysis
- 16.2.5.4. Recent Developments
- 16.2.5.5. Financials (Based on Availability)
- 16.2.6 BridgeHead Software
- 16.2.6.1. Overview
- 16.2.6.2. Products
- 16.2.6.3. SWOT Analysis
- 16.2.6.4. Recent Developments
- 16.2.6.5. Financials (Based on Availability)
- 16.2.7 Koninklijke Philips NV
- 16.2.7.1. Overview
- 16.2.7.2. Products
- 16.2.7.3. SWOT Analysis
- 16.2.7.4. Recent Developments
- 16.2.7.5. Financials (Based on Availability)
- 16.2.8 Carestream Health Inc (Onex Corporation)
- 16.2.8.1. Overview
- 16.2.8.2. Products
- 16.2.8.3. SWOT Analysis
- 16.2.8.4. Recent Developments
- 16.2.8.5. Financials (Based on Availability)
- 16.2.9 McKesson Corporation
- 16.2.9.1. Overview
- 16.2.9.2. Products
- 16.2.9.3. SWOT Analysis
- 16.2.9.4. Recent Developments
- 16.2.9.5. Financials (Based on Availability)
- 16.2.10 Novarad Corporation
- 16.2.10.1. Overview
- 16.2.10.2. Products
- 16.2.10.3. SWOT Analysis
- 16.2.10.4. Recent Developments
- 16.2.10.5. Financials (Based on Availability)
- 16.2.11 Agfa-Gevaert Group
- 16.2.11.1. Overview
- 16.2.11.2. Products
- 16.2.11.3. SWOT Analysis
- 16.2.11.4. Recent Developments
- 16.2.11.5. Financials (Based on Availability)
- 16.2.12 Fujifilm Holdings Corporation
- 16.2.12.1. Overview
- 16.2.12.2. Products
- 16.2.12.3. SWOT Analysis
- 16.2.12.4. Recent Developments
- 16.2.12.5. Financials (Based on Availability)
- 16.2.1 IBM Corporation
List of Figures
- Figure 1: Global Medical Image Exchange Systems Industry Revenue Breakdown (Million, %) by Region 2024 & 2032
- Figure 2: Global Medical Image Exchange Systems Industry Volume Breakdown (K Unit, %) by Region 2024 & 2032
- Figure 3: North America Medical Image Exchange Systems Industry Revenue (Million), by Country 2024 & 2032
- Figure 4: North America Medical Image Exchange Systems Industry Volume (K Unit), by Country 2024 & 2032
- Figure 5: North America Medical Image Exchange Systems Industry Revenue Share (%), by Country 2024 & 2032
- Figure 6: North America Medical Image Exchange Systems Industry Volume Share (%), by Country 2024 & 2032
- Figure 7: Europe Medical Image Exchange Systems Industry Revenue (Million), by Country 2024 & 2032
- Figure 8: Europe Medical Image Exchange Systems Industry Volume (K Unit), by Country 2024 & 2032
- Figure 9: Europe Medical Image Exchange Systems Industry Revenue Share (%), by Country 2024 & 2032
- Figure 10: Europe Medical Image Exchange Systems Industry Volume Share (%), by Country 2024 & 2032
- Figure 11: Asia Pacific Medical Image Exchange Systems Industry Revenue (Million), by Country 2024 & 2032
- Figure 12: Asia Pacific Medical Image Exchange Systems Industry Volume (K Unit), by Country 2024 & 2032
- Figure 13: Asia Pacific Medical Image Exchange Systems Industry Revenue Share (%), by Country 2024 & 2032
- Figure 14: Asia Pacific Medical Image Exchange Systems Industry Volume Share (%), by Country 2024 & 2032
- Figure 15: Middle East and Africa Medical Image Exchange Systems Industry Revenue (Million), by Country 2024 & 2032
- Figure 16: Middle East and Africa Medical Image Exchange Systems Industry Volume (K Unit), by Country 2024 & 2032
- Figure 17: Middle East and Africa Medical Image Exchange Systems Industry Revenue Share (%), by Country 2024 & 2032
- Figure 18: Middle East and Africa Medical Image Exchange Systems Industry Volume Share (%), by Country 2024 & 2032
- Figure 19: South America Medical Image Exchange Systems Industry Revenue (Million), by Country 2024 & 2032
- Figure 20: South America Medical Image Exchange Systems Industry Volume (K Unit), by Country 2024 & 2032
- Figure 21: South America Medical Image Exchange Systems Industry Revenue Share (%), by Country 2024 & 2032
- Figure 22: South America Medical Image Exchange Systems Industry Volume Share (%), by Country 2024 & 2032
- Figure 23: North America Medical Image Exchange Systems Industry Revenue (Million), by System 2024 & 2032
- Figure 24: North America Medical Image Exchange Systems Industry Volume (K Unit), by System 2024 & 2032
- Figure 25: North America Medical Image Exchange Systems Industry Revenue Share (%), by System 2024 & 2032
- Figure 26: North America Medical Image Exchange Systems Industry Volume Share (%), by System 2024 & 2032
- Figure 27: North America Medical Image Exchange Systems Industry Revenue (Million), by End-User 2024 & 2032
- Figure 28: North America Medical Image Exchange Systems Industry Volume (K Unit), by End-User 2024 & 2032
- Figure 29: North America Medical Image Exchange Systems Industry Revenue Share (%), by End-User 2024 & 2032
- Figure 30: North America Medical Image Exchange Systems Industry Volume Share (%), by End-User 2024 & 2032
- Figure 31: North America Medical Image Exchange Systems Industry Revenue (Million), by Country 2024 & 2032
- Figure 32: North America Medical Image Exchange Systems Industry Volume (K Unit), by Country 2024 & 2032
- Figure 33: North America Medical Image Exchange Systems Industry Revenue Share (%), by Country 2024 & 2032
- Figure 34: North America Medical Image Exchange Systems Industry Volume Share (%), by Country 2024 & 2032
- Figure 35: Europe Medical Image Exchange Systems Industry Revenue (Million), by System 2024 & 2032
- Figure 36: Europe Medical Image Exchange Systems Industry Volume (K Unit), by System 2024 & 2032
- Figure 37: Europe Medical Image Exchange Systems Industry Revenue Share (%), by System 2024 & 2032
- Figure 38: Europe Medical Image Exchange Systems Industry Volume Share (%), by System 2024 & 2032
- Figure 39: Europe Medical Image Exchange Systems Industry Revenue (Million), by End-User 2024 & 2032
- Figure 40: Europe Medical Image Exchange Systems Industry Volume (K Unit), by End-User 2024 & 2032
- Figure 41: Europe Medical Image Exchange Systems Industry Revenue Share (%), by End-User 2024 & 2032
- Figure 42: Europe Medical Image Exchange Systems Industry Volume Share (%), by End-User 2024 & 2032
- Figure 43: Europe Medical Image Exchange Systems Industry Revenue (Million), by Country 2024 & 2032
- Figure 44: Europe Medical Image Exchange Systems Industry Volume (K Unit), by Country 2024 & 2032
- Figure 45: Europe Medical Image Exchange Systems Industry Revenue Share (%), by Country 2024 & 2032
- Figure 46: Europe Medical Image Exchange Systems Industry Volume Share (%), by Country 2024 & 2032
- Figure 47: Asia Pacific Medical Image Exchange Systems Industry Revenue (Million), by System 2024 & 2032
- Figure 48: Asia Pacific Medical Image Exchange Systems Industry Volume (K Unit), by System 2024 & 2032
- Figure 49: Asia Pacific Medical Image Exchange Systems Industry Revenue Share (%), by System 2024 & 2032
- Figure 50: Asia Pacific Medical Image Exchange Systems Industry Volume Share (%), by System 2024 & 2032
- Figure 51: Asia Pacific Medical Image Exchange Systems Industry Revenue (Million), by End-User 2024 & 2032
- Figure 52: Asia Pacific Medical Image Exchange Systems Industry Volume (K Unit), by End-User 2024 & 2032
- Figure 53: Asia Pacific Medical Image Exchange Systems Industry Revenue Share (%), by End-User 2024 & 2032
- Figure 54: Asia Pacific Medical Image Exchange Systems Industry Volume Share (%), by End-User 2024 & 2032
- Figure 55: Asia Pacific Medical Image Exchange Systems Industry Revenue (Million), by Country 2024 & 2032
- Figure 56: Asia Pacific Medical Image Exchange Systems Industry Volume (K Unit), by Country 2024 & 2032
- Figure 57: Asia Pacific Medical Image Exchange Systems Industry Revenue Share (%), by Country 2024 & 2032
- Figure 58: Asia Pacific Medical Image Exchange Systems Industry Volume Share (%), by Country 2024 & 2032
- Figure 59: Middle East and Africa Medical Image Exchange Systems Industry Revenue (Million), by System 2024 & 2032
- Figure 60: Middle East and Africa Medical Image Exchange Systems Industry Volume (K Unit), by System 2024 & 2032
- Figure 61: Middle East and Africa Medical Image Exchange Systems Industry Revenue Share (%), by System 2024 & 2032
- Figure 62: Middle East and Africa Medical Image Exchange Systems Industry Volume Share (%), by System 2024 & 2032
- Figure 63: Middle East and Africa Medical Image Exchange Systems Industry Revenue (Million), by End-User 2024 & 2032
- Figure 64: Middle East and Africa Medical Image Exchange Systems Industry Volume (K Unit), by End-User 2024 & 2032
- Figure 65: Middle East and Africa Medical Image Exchange Systems Industry Revenue Share (%), by End-User 2024 & 2032
- Figure 66: Middle East and Africa Medical Image Exchange Systems Industry Volume Share (%), by End-User 2024 & 2032
- Figure 67: Middle East and Africa Medical Image Exchange Systems Industry Revenue (Million), by Country 2024 & 2032
- Figure 68: Middle East and Africa Medical Image Exchange Systems Industry Volume (K Unit), by Country 2024 & 2032
- Figure 69: Middle East and Africa Medical Image Exchange Systems Industry Revenue Share (%), by Country 2024 & 2032
- Figure 70: Middle East and Africa Medical Image Exchange Systems Industry Volume Share (%), by Country 2024 & 2032
- Figure 71: South America Medical Image Exchange Systems Industry Revenue (Million), by System 2024 & 2032
- Figure 72: South America Medical Image Exchange Systems Industry Volume (K Unit), by System 2024 & 2032
- Figure 73: South America Medical Image Exchange Systems Industry Revenue Share (%), by System 2024 & 2032
- Figure 74: South America Medical Image Exchange Systems Industry Volume Share (%), by System 2024 & 2032
- Figure 75: South America Medical Image Exchange Systems Industry Revenue (Million), by End-User 2024 & 2032
- Figure 76: South America Medical Image Exchange Systems Industry Volume (K Unit), by End-User 2024 & 2032
- Figure 77: South America Medical Image Exchange Systems Industry Revenue Share (%), by End-User 2024 & 2032
- Figure 78: South America Medical Image Exchange Systems Industry Volume Share (%), by End-User 2024 & 2032
- Figure 79: South America Medical Image Exchange Systems Industry Revenue (Million), by Country 2024 & 2032
- Figure 80: South America Medical Image Exchange Systems Industry Volume (K Unit), by Country 2024 & 2032
- Figure 81: South America Medical Image Exchange Systems Industry Revenue Share (%), by Country 2024 & 2032
- Figure 82: South America Medical Image Exchange Systems Industry Volume Share (%), by Country 2024 & 2032
List of Tables
- Table 1: Global Medical Image Exchange Systems Industry Revenue Million Forecast, by Region 2019 & 2032
- Table 2: Global Medical Image Exchange Systems Industry Volume K Unit Forecast, by Region 2019 & 2032
- Table 3: Global Medical Image Exchange Systems Industry Revenue Million Forecast, by System 2019 & 2032
- Table 4: Global Medical Image Exchange Systems Industry Volume K Unit Forecast, by System 2019 & 2032
- Table 5: Global Medical Image Exchange Systems Industry Revenue Million Forecast, by End-User 2019 & 2032
- Table 6: Global Medical Image Exchange Systems Industry Volume K Unit Forecast, by End-User 2019 & 2032
- Table 7: Global Medical Image Exchange Systems Industry Revenue Million Forecast, by Region 2019 & 2032
- Table 8: Global Medical Image Exchange Systems Industry Volume K Unit Forecast, by Region 2019 & 2032
- Table 9: Global Medical Image Exchange Systems Industry Revenue Million Forecast, by Country 2019 & 2032
- Table 10: Global Medical Image Exchange Systems Industry Volume K Unit Forecast, by Country 2019 & 2032
- Table 11: United States Medical Image Exchange Systems Industry Revenue (Million) Forecast, by Application 2019 & 2032
- Table 12: United States Medical Image Exchange Systems Industry Volume (K Unit) Forecast, by Application 2019 & 2032
- Table 13: Canada Medical Image Exchange Systems Industry Revenue (Million) Forecast, by Application 2019 & 2032
- Table 14: Canada Medical Image Exchange Systems Industry Volume (K Unit) Forecast, by Application 2019 & 2032
- Table 15: Mexico Medical Image Exchange Systems Industry Revenue (Million) Forecast, by Application 2019 & 2032
- Table 16: Mexico Medical Image Exchange Systems Industry Volume (K Unit) Forecast, by Application 2019 & 2032
- Table 17: Global Medical Image Exchange Systems Industry Revenue Million Forecast, by Country 2019 & 2032
- Table 18: Global Medical Image Exchange Systems Industry Volume K Unit Forecast, by Country 2019 & 2032
- Table 19: Germany Medical Image Exchange Systems Industry Revenue (Million) Forecast, by Application 2019 & 2032
- Table 20: Germany Medical Image Exchange Systems Industry Volume (K Unit) Forecast, by Application 2019 & 2032
- Table 21: United Kingdom Medical Image Exchange Systems Industry Revenue (Million) Forecast, by Application 2019 & 2032
- Table 22: United Kingdom Medical Image Exchange Systems Industry Volume (K Unit) Forecast, by Application 2019 & 2032
- Table 23: France Medical Image Exchange Systems Industry Revenue (Million) Forecast, by Application 2019 & 2032
- Table 24: France Medical Image Exchange Systems Industry Volume (K Unit) Forecast, by Application 2019 & 2032
- Table 25: Italy Medical Image Exchange Systems Industry Revenue (Million) Forecast, by Application 2019 & 2032
- Table 26: Italy Medical Image Exchange Systems Industry Volume (K Unit) Forecast, by Application 2019 & 2032
- Table 27: Spain Medical Image Exchange Systems Industry Revenue (Million) Forecast, by Application 2019 & 2032
- Table 28: Spain Medical Image Exchange Systems Industry Volume (K Unit) Forecast, by Application 2019 & 2032
- Table 29: Rest of Europe Medical Image Exchange Systems Industry Revenue (Million) Forecast, by Application 2019 & 2032
- Table 30: Rest of Europe Medical Image Exchange Systems Industry Volume (K Unit) Forecast, by Application 2019 & 2032
- Table 31: Global Medical Image Exchange Systems Industry Revenue Million Forecast, by Country 2019 & 2032
- Table 32: Global Medical Image Exchange Systems Industry Volume K Unit Forecast, by Country 2019 & 2032
- Table 33: China Medical Image Exchange Systems Industry Revenue (Million) Forecast, by Application 2019 & 2032
- Table 34: China Medical Image Exchange Systems Industry Volume (K Unit) Forecast, by Application 2019 & 2032
- Table 35: Japan Medical Image Exchange Systems Industry Revenue (Million) Forecast, by Application 2019 & 2032
- Table 36: Japan Medical Image Exchange Systems Industry Volume (K Unit) Forecast, by Application 2019 & 2032
- Table 37: India Medical Image Exchange Systems Industry Revenue (Million) Forecast, by Application 2019 & 2032
- Table 38: India Medical Image Exchange Systems Industry Volume (K Unit) Forecast, by Application 2019 & 2032
- Table 39: Australia Medical Image Exchange Systems Industry Revenue (Million) Forecast, by Application 2019 & 2032
- Table 40: Australia Medical Image Exchange Systems Industry Volume (K Unit) Forecast, by Application 2019 & 2032
- Table 41: South Korea Medical Image Exchange Systems Industry Revenue (Million) Forecast, by Application 2019 & 2032
- Table 42: South Korea Medical Image Exchange Systems Industry Volume (K Unit) Forecast, by Application 2019 & 2032
- Table 43: Rest of Asia Pacific Medical Image Exchange Systems Industry Revenue (Million) Forecast, by Application 2019 & 2032
- Table 44: Rest of Asia Pacific Medical Image Exchange Systems Industry Volume (K Unit) Forecast, by Application 2019 & 2032
- Table 45: Global Medical Image Exchange Systems Industry Revenue Million Forecast, by Country 2019 & 2032
- Table 46: Global Medical Image Exchange Systems Industry Volume K Unit Forecast, by Country 2019 & 2032
- Table 47: GCC Medical Image Exchange Systems Industry Revenue (Million) Forecast, by Application 2019 & 2032
- Table 48: GCC Medical Image Exchange Systems Industry Volume (K Unit) Forecast, by Application 2019 & 2032
- Table 49: South Africa Medical Image Exchange Systems Industry Revenue (Million) Forecast, by Application 2019 & 2032
- Table 50: South Africa Medical Image Exchange Systems Industry Volume (K Unit) Forecast, by Application 2019 & 2032
- Table 51: Rest of Middle East and Africa Medical Image Exchange Systems Industry Revenue (Million) Forecast, by Application 2019 & 2032
- Table 52: Rest of Middle East and Africa Medical Image Exchange Systems Industry Volume (K Unit) Forecast, by Application 2019 & 2032
- Table 53: Global Medical Image Exchange Systems Industry Revenue Million Forecast, by Country 2019 & 2032
- Table 54: Global Medical Image Exchange Systems Industry Volume K Unit Forecast, by Country 2019 & 2032
- Table 55: Brazil Medical Image Exchange Systems Industry Revenue (Million) Forecast, by Application 2019 & 2032
- Table 56: Brazil Medical Image Exchange Systems Industry Volume (K Unit) Forecast, by Application 2019 & 2032
- Table 57: Argentina Medical Image Exchange Systems Industry Revenue (Million) Forecast, by Application 2019 & 2032
- Table 58: Argentina Medical Image Exchange Systems Industry Volume (K Unit) Forecast, by Application 2019 & 2032
- Table 59: Rest of South America Medical Image Exchange Systems Industry Revenue (Million) Forecast, by Application 2019 & 2032
- Table 60: Rest of South America Medical Image Exchange Systems Industry Volume (K Unit) Forecast, by Application 2019 & 2032
- Table 61: Global Medical Image Exchange Systems Industry Revenue Million Forecast, by System 2019 & 2032
- Table 62: Global Medical Image Exchange Systems Industry Volume K Unit Forecast, by System 2019 & 2032
- Table 63: Global Medical Image Exchange Systems Industry Revenue Million Forecast, by End-User 2019 & 2032
- Table 64: Global Medical Image Exchange Systems Industry Volume K Unit Forecast, by End-User 2019 & 2032
- Table 65: Global Medical Image Exchange Systems Industry Revenue Million Forecast, by Country 2019 & 2032
- Table 66: Global Medical Image Exchange Systems Industry Volume K Unit Forecast, by Country 2019 & 2032
- Table 67: United States Medical Image Exchange Systems Industry Revenue (Million) Forecast, by Application 2019 & 2032
- Table 68: United States Medical Image Exchange Systems Industry Volume (K Unit) Forecast, by Application 2019 & 2032
- Table 69: Canada Medical Image Exchange Systems Industry Revenue (Million) Forecast, by Application 2019 & 2032
- Table 70: Canada Medical Image Exchange Systems Industry Volume (K Unit) Forecast, by Application 2019 & 2032
- Table 71: Mexico Medical Image Exchange Systems Industry Revenue (Million) Forecast, by Application 2019 & 2032
- Table 72: Mexico Medical Image Exchange Systems Industry Volume (K Unit) Forecast, by Application 2019 & 2032
- Table 73: Global Medical Image Exchange Systems Industry Revenue Million Forecast, by System 2019 & 2032
- Table 74: Global Medical Image Exchange Systems Industry Volume K Unit Forecast, by System 2019 & 2032
- Table 75: Global Medical Image Exchange Systems Industry Revenue Million Forecast, by End-User 2019 & 2032
- Table 76: Global Medical Image Exchange Systems Industry Volume K Unit Forecast, by End-User 2019 & 2032
- Table 77: Global Medical Image Exchange Systems Industry Revenue Million Forecast, by Country 2019 & 2032
- Table 78: Global Medical Image Exchange Systems Industry Volume K Unit Forecast, by Country 2019 & 2032
- Table 79: Germany Medical Image Exchange Systems Industry Revenue (Million) Forecast, by Application 2019 & 2032
- Table 80: Germany Medical Image Exchange Systems Industry Volume (K Unit) Forecast, by Application 2019 & 2032
- Table 81: United Kingdom Medical Image Exchange Systems Industry Revenue (Million) Forecast, by Application 2019 & 2032
- Table 82: United Kingdom Medical Image Exchange Systems Industry Volume (K Unit) Forecast, by Application 2019 & 2032
- Table 83: France Medical Image Exchange Systems Industry Revenue (Million) Forecast, by Application 2019 & 2032
- Table 84: France Medical Image Exchange Systems Industry Volume (K Unit) Forecast, by Application 2019 & 2032
- Table 85: Italy Medical Image Exchange Systems Industry Revenue (Million) Forecast, by Application 2019 & 2032
- Table 86: Italy Medical Image Exchange Systems Industry Volume (K Unit) Forecast, by Application 2019 & 2032
- Table 87: Spain Medical Image Exchange Systems Industry Revenue (Million) Forecast, by Application 2019 & 2032
- Table 88: Spain Medical Image Exchange Systems Industry Volume (K Unit) Forecast, by Application 2019 & 2032
- Table 89: Rest of Europe Medical Image Exchange Systems Industry Revenue (Million) Forecast, by Application 2019 & 2032
- Table 90: Rest of Europe Medical Image Exchange Systems Industry Volume (K Unit) Forecast, by Application 2019 & 2032
- Table 91: Global Medical Image Exchange Systems Industry Revenue Million Forecast, by System 2019 & 2032
- Table 92: Global Medical Image Exchange Systems Industry Volume K Unit Forecast, by System 2019 & 2032
- Table 93: Global Medical Image Exchange Systems Industry Revenue Million Forecast, by End-User 2019 & 2032
- Table 94: Global Medical Image Exchange Systems Industry Volume K Unit Forecast, by End-User 2019 & 2032
- Table 95: Global Medical Image Exchange Systems Industry Revenue Million Forecast, by Country 2019 & 2032
- Table 96: Global Medical Image Exchange Systems Industry Volume K Unit Forecast, by Country 2019 & 2032
- Table 97: China Medical Image Exchange Systems Industry Revenue (Million) Forecast, by Application 2019 & 2032
- Table 98: China Medical Image Exchange Systems Industry Volume (K Unit) Forecast, by Application 2019 & 2032
- Table 99: Japan Medical Image Exchange Systems Industry Revenue (Million) Forecast, by Application 2019 & 2032
- Table 100: Japan Medical Image Exchange Systems Industry Volume (K Unit) Forecast, by Application 2019 & 2032
- Table 101: India Medical Image Exchange Systems Industry Revenue (Million) Forecast, by Application 2019 & 2032
- Table 102: India Medical Image Exchange Systems Industry Volume (K Unit) Forecast, by Application 2019 & 2032
- Table 103: Australia Medical Image Exchange Systems Industry Revenue (Million) Forecast, by Application 2019 & 2032
- Table 104: Australia Medical Image Exchange Systems Industry Volume (K Unit) Forecast, by Application 2019 & 2032
- Table 105: South Korea Medical Image Exchange Systems Industry Revenue (Million) Forecast, by Application 2019 & 2032
- Table 106: South Korea Medical Image Exchange Systems Industry Volume (K Unit) Forecast, by Application 2019 & 2032
- Table 107: Rest of Asia Pacific Medical Image Exchange Systems Industry Revenue (Million) Forecast, by Application 2019 & 2032
- Table 108: Rest of Asia Pacific Medical Image Exchange Systems Industry Volume (K Unit) Forecast, by Application 2019 & 2032
- Table 109: Global Medical Image Exchange Systems Industry Revenue Million Forecast, by System 2019 & 2032
- Table 110: Global Medical Image Exchange Systems Industry Volume K Unit Forecast, by System 2019 & 2032
- Table 111: Global Medical Image Exchange Systems Industry Revenue Million Forecast, by End-User 2019 & 2032
- Table 112: Global Medical Image Exchange Systems Industry Volume K Unit Forecast, by End-User 2019 & 2032
- Table 113: Global Medical Image Exchange Systems Industry Revenue Million Forecast, by Country 2019 & 2032
- Table 114: Global Medical Image Exchange Systems Industry Volume K Unit Forecast, by Country 2019 & 2032
- Table 115: GCC Medical Image Exchange Systems Industry Revenue (Million) Forecast, by Application 2019 & 2032
- Table 116: GCC Medical Image Exchange Systems Industry Volume (K Unit) Forecast, by Application 2019 & 2032
- Table 117: South Africa Medical Image Exchange Systems Industry Revenue (Million) Forecast, by Application 2019 & 2032
- Table 118: South Africa Medical Image Exchange Systems Industry Volume (K Unit) Forecast, by Application 2019 & 2032
- Table 119: Rest of Middle East and Africa Medical Image Exchange Systems Industry Revenue (Million) Forecast, by Application 2019 & 2032
- Table 120: Rest of Middle East and Africa Medical Image Exchange Systems Industry Volume (K Unit) Forecast, by Application 2019 & 2032
- Table 121: Global Medical Image Exchange Systems Industry Revenue Million Forecast, by System 2019 & 2032
- Table 122: Global Medical Image Exchange Systems Industry Volume K Unit Forecast, by System 2019 & 2032
- Table 123: Global Medical Image Exchange Systems Industry Revenue Million Forecast, by End-User 2019 & 2032
- Table 124: Global Medical Image Exchange Systems Industry Volume K Unit Forecast, by End-User 2019 & 2032
- Table 125: Global Medical Image Exchange Systems Industry Revenue Million Forecast, by Country 2019 & 2032
- Table 126: Global Medical Image Exchange Systems Industry Volume K Unit Forecast, by Country 2019 & 2032
- Table 127: Brazil Medical Image Exchange Systems Industry Revenue (Million) Forecast, by Application 2019 & 2032
- Table 128: Brazil Medical Image Exchange Systems Industry Volume (K Unit) Forecast, by Application 2019 & 2032
- Table 129: Argentina Medical Image Exchange Systems Industry Revenue (Million) Forecast, by Application 2019 & 2032
- Table 130: Argentina Medical Image Exchange Systems Industry Volume (K Unit) Forecast, by Application 2019 & 2032
- Table 131: Rest of South America Medical Image Exchange Systems Industry Revenue (Million) Forecast, by Application 2019 & 2032
- Table 132: Rest of South America Medical Image Exchange Systems Industry Volume (K Unit) Forecast, by Application 2019 & 2032
Frequently Asked Questions
1. What is the projected Compound Annual Growth Rate (CAGR) of the Medical Image Exchange Systems Industry?
The projected CAGR is approximately 6.96%.
2. Which companies are prominent players in the Medical Image Exchange Systems Industry?
Key companies in the market include IBM Corporation, Siemens Healthineers, GE Healthcare, Dell Technologies Inc , Lexmark International Inc, BridgeHead Software, Koninklijke Philips NV, Carestream Health Inc (Onex Corporation), McKesson Corporation, Novarad Corporation, Agfa-Gevaert Group, Fujifilm Holdings Corporation.
3. What are the main segments of the Medical Image Exchange Systems Industry?
The market segments include System, End-User.
4. Can you provide details about the market size?
The market size is estimated to be USD 4.59 Million as of 2022.
5. What are some drivers contributing to market growth?
Technological Innovations in the Diagnostic Imaging and Image Management; Rising Prevalence of Chronic Diseases; Emergence of Big Data in Healthcare.
6. What are the notable trends driving market growth?
Picture Archiving and Communications Systems (PACS) is Expected to Record Notable CAGR in the Market During the Forecast Period.
7. Are there any restraints impacting market growth?
Cost Associated With Implementation of Medical Imaging Management Solutions; Decrease In the Supply of SPECT and PET Systems due to the Shortage of Radioisotopes.
8. Can you provide examples of recent developments in the market?
March 2022: Intelerad Medical Systems launched its new Enterprise Imaging and Informatics Suite at the 2022 HIMSS Global Health Conference & Exhibition. Intelerad's suite empowers hospitals and health systems to break down siloed data and create a seamless, vendor-neutral information hub, integrating vital patient data across the entire healthcare ecosystem.
9. What pricing options are available for accessing the report?
Pricing options include single-user, multi-user, and enterprise licenses priced at USD 4750, USD 5250, and USD 8750 respectively.
10. Is the market size provided in terms of value or volume?
The market size is provided in terms of value, measured in Million and volume, measured in K Unit.
11. Are there any specific market keywords associated with the report?
Yes, the market keyword associated with the report is "Medical Image Exchange Systems Industry," which aids in identifying and referencing the specific market segment covered.
12. How do I determine which pricing option suits my needs best?
The pricing options vary based on user requirements and access needs. Individual users may opt for single-user licenses, while businesses requiring broader access may choose multi-user or enterprise licenses for cost-effective access to the report.
13. Are there any additional resources or data provided in the Medical Image Exchange Systems Industry report?
While the report offers comprehensive insights, it's advisable to review the specific contents or supplementary materials provided to ascertain if additional resources or data are available.
14. How can I stay updated on further developments or reports in the Medical Image Exchange Systems Industry?
To stay informed about further developments, trends, and reports in the Medical Image Exchange Systems Industry, consider subscribing to industry newsletters, following relevant companies and organizations, or regularly checking reputable industry news sources and publications.
Methodology
Step 1 - Identification of Relevant Samples Size from Population Database


Step 2 - Approaches for Defining Global Market Size (Value, Volume* & Price*)

Note*: In applicable scenarios
Step 3 - Data Sources
Primary Research
- Web Analytics
- Survey Reports
- Research Institute
- Latest Research Reports
- Opinion Leaders
Secondary Research
- Annual Reports
- White Paper
- Latest Press Release
- Industry Association
- Paid Database
- Investor Presentations

Step 4 - Data Triangulation
Involves using different sources of information in order to increase the validity of a study
These sources are likely to be stakeholders in a program - participants, other researchers, program staff, other community members, and so on.
Then we put all data in single framework & apply various statistical tools to find out the dynamic on the market.
During the analysis stage, feedback from the stakeholder groups would be compared to determine areas of agreement as well as areas of divergence


