

Key Insights
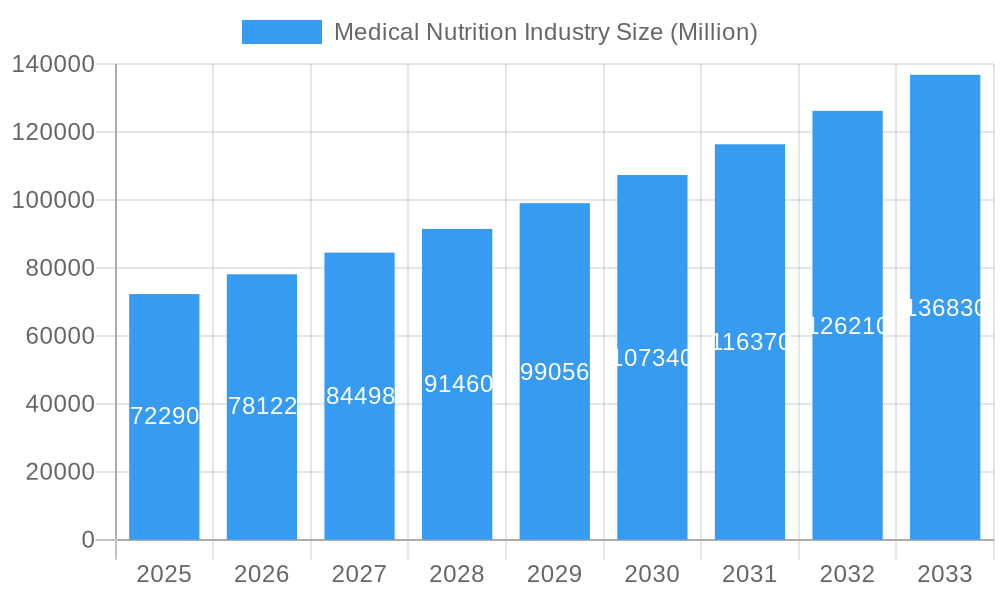
The global medical nutrition market, valued at $72.29 billion in 2025, is projected to experience robust growth, exhibiting a compound annual growth rate (CAGR) of 8.05% from 2025 to 2033. This expansion is fueled by several key drivers. Rising prevalence of chronic diseases like diabetes, cardiovascular ailments, and cancer necessitates specialized nutritional support, significantly boosting market demand. Advances in medical nutrition formulations, including those tailored to specific dietary needs and conditions, are contributing to improved patient outcomes and increased market acceptance. The aging global population, with its higher susceptibility to age-related health issues requiring nutritional intervention, presents a substantial growth opportunity. Furthermore, increasing healthcare expenditure and greater awareness regarding the importance of nutrition in disease management are further propelling market expansion. Growth is particularly strong in developing economies where rising disposable incomes and improved healthcare infrastructure are creating new market segments.
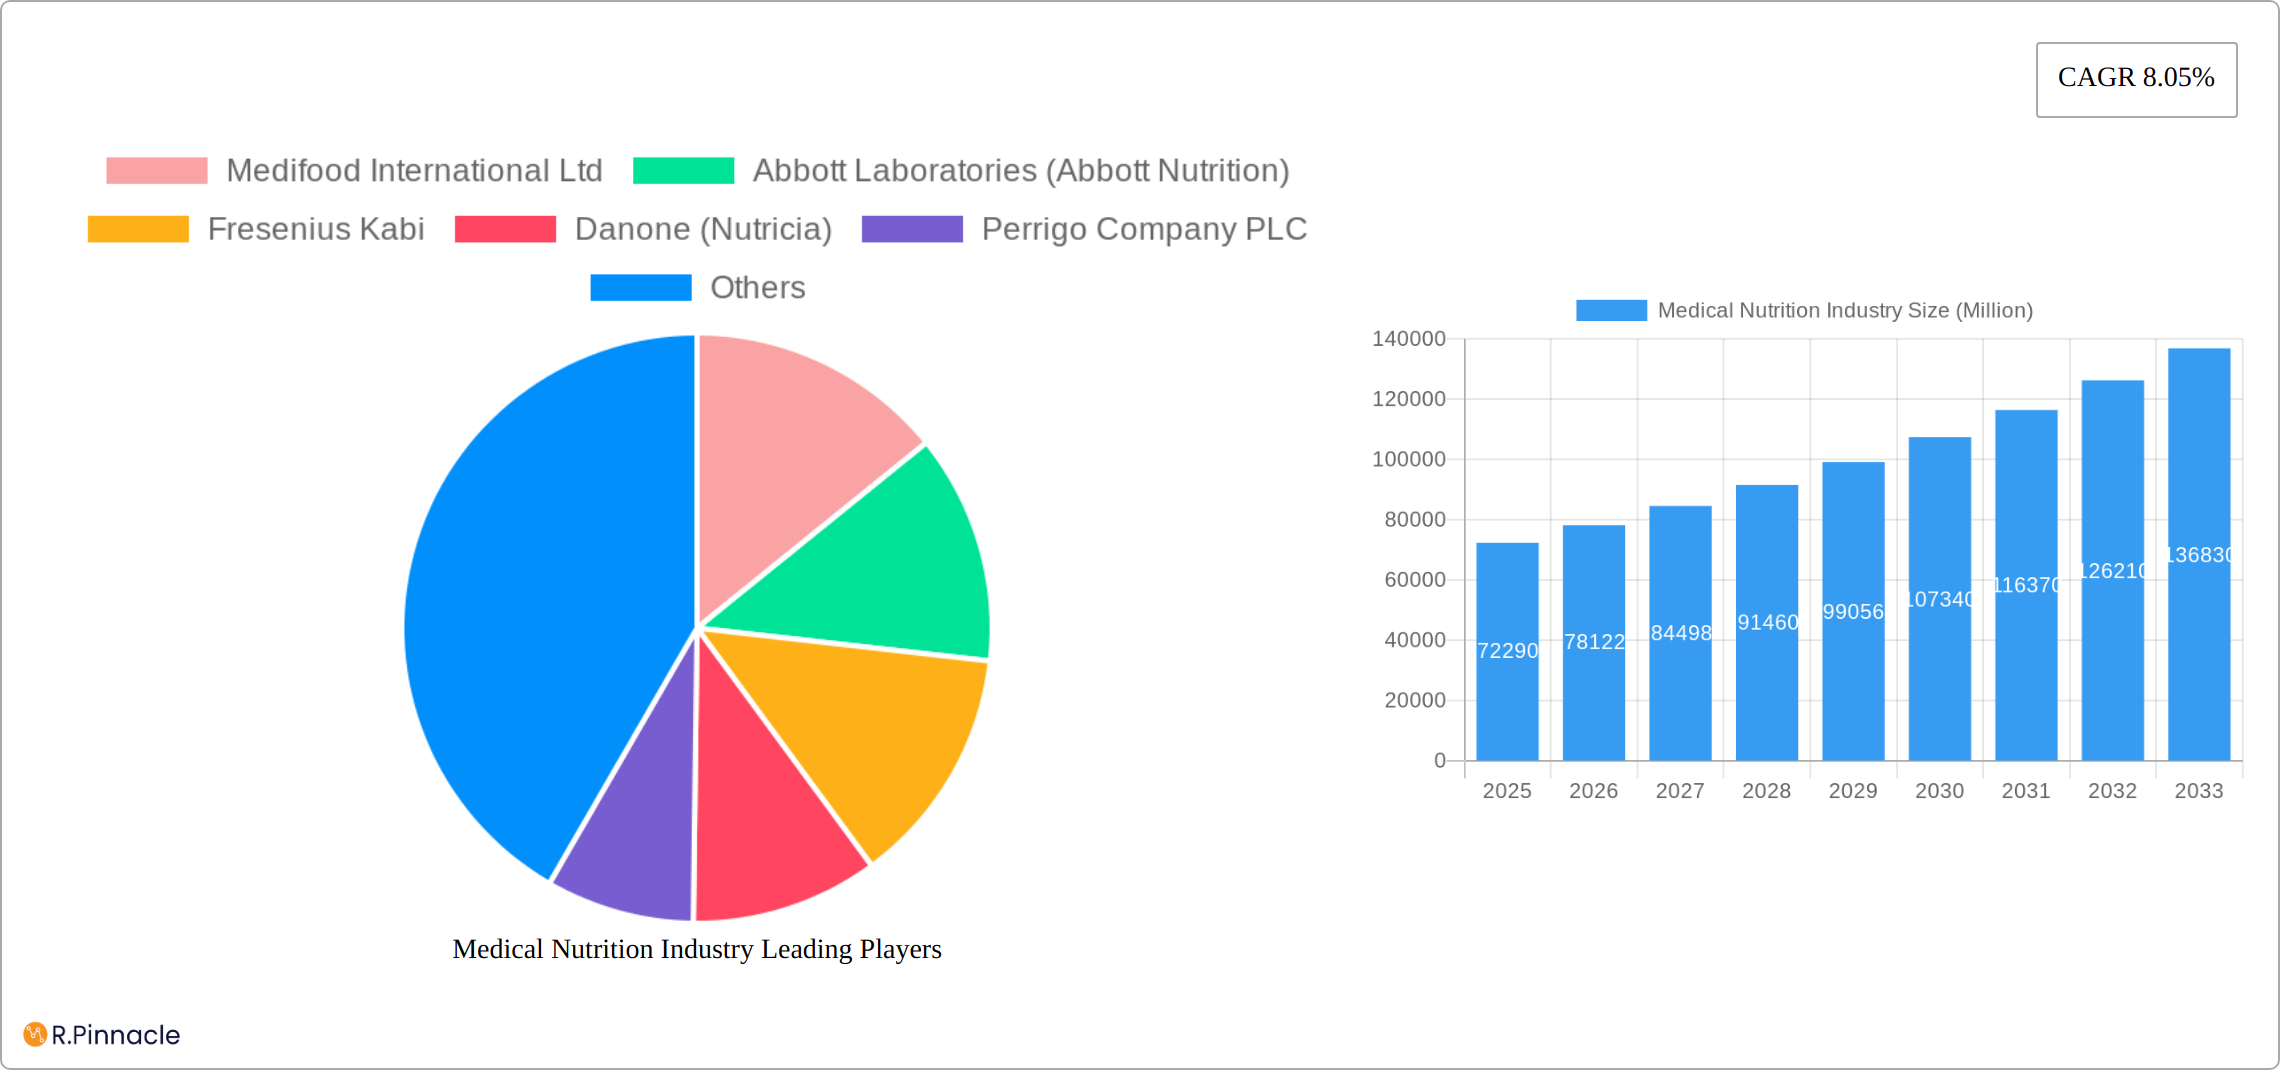
Medical Nutrition Industry Market Size (In Billion)
However, the market is not without challenges. High costs associated with specialized medical nutrition products can limit accessibility for certain patient populations, particularly in low-income countries. Stringent regulatory requirements and approvals for new products can also impede market entry and growth. Competition among established players and emerging companies is intense, placing pressure on pricing and profitability. Nevertheless, the long-term outlook for the medical nutrition industry remains positive, driven by the aforementioned factors and ongoing innovation within the sector. The market segmentation by application (nutritional support for malnutrition, metabolic disorders, gastrointestinal diseases, cancer, neurological diseases, and other diseases), end-user (pediatric and adult), and route of administration (oral and enteral, parenteral) provides opportunities for targeted product development and market penetration. Geographic expansion into emerging markets will also be critical for future growth.
Medical Nutrition Industry Company Market Share
Medical Nutrition Industry Market Report: 2019-2033
This comprehensive report provides a detailed analysis of the Medical Nutrition Industry, projecting a market valued at $XX Billion by 2033. The report covers the period 2019-2033, with a base year of 2025 and a forecast period of 2025-2033. It offers actionable insights for industry professionals, investors, and stakeholders seeking to navigate this dynamic market.
Medical Nutrition Industry Market Structure & Innovation Trends
The Medical Nutrition Industry is characterized by a moderately concentrated market structure, with prominent global players such as Abbott Laboratories (Abbott Nutrition), Fresenius Kabi, Danone (Nutricia), and Nestle Health Science commanding significant market share. While exact market share distributions are dynamic, our projections indicate that Abbott Laboratories (Abbott Nutrition) is poised to hold approximately 15% market share in 2025. The relentless rise in the prevalence of chronic diseases is a primary catalyst for innovation, necessitating the development of advanced and highly specialized nutritional solutions. Stringent regulatory frameworks, including guidelines from the FDA and EU regulations, exert considerable influence over product development cycles and market access strategies. Key product substitutes, such as home-prepared diets and over-the-counter supplements, exist but often fall short in terms of efficacy and safety compared to scientifically formulated medical nutrition products. The end-user demographic is exceptionally broad, encompassing both pediatric and adult populations across a wide spectrum of disease states. Merger and acquisition (M&A) activity has been robust, with deal values exceeding $XX Billion in the past five years. Notable transactions have involved leading entities like Nestle Health Science. We anticipate this trend of significant M&A activity to persist at a similar pace in the foreseeable future.
- Market Concentration: Moderately concentrated, with top-tier players dominating substantial market shares.
- Innovation Drivers: Escalating prevalence of chronic diseases, rapid technological advancements, and the growing demand for personalized nutrition.
- Regulatory Frameworks: Rigorous regulatory oversight significantly impacts product development and market entry processes.
- Product Substitutes: Home-prepared diets and over-the-counter supplements present competitive alternatives, though often with limited efficacy and safety profiles.
- M&A Activity: A notable surge in M&A activity, with transactions valued over $XX Billion recorded in recent years.
Medical Nutrition Industry Market Dynamics & Trends
The Medical Nutrition market is experiencing a period of robust and sustained growth. This expansion is primarily fueled by an aging global demographic, the increasing incidence of chronic conditions such as diabetes and cancer, and escalating healthcare expenditures worldwide. The market's Compound Annual Growth Rate (CAGR) is projected to be approximately XX% during the forecast period spanning from 2025 to 2033. Transformative technological advancements are reshaping the industry, including the development of sophisticated personalized nutrition solutions and the enhancement of product delivery systems, such as innovative enteral feeding tubes and advanced parenteral nutrition formulations. Consumer preferences are evolving towards products that are not only convenient and palatable but also demonstrably effective and precisely tailored to individual dietary requirements. The competitive landscape is characterized by intense rivalry, prompting companies to prioritize continuous product innovation, forge strategic partnerships, and pursue aggressive market expansion initiatives. While market penetration is currently highest in developed economies, developing markets represent a significant and largely untapped frontier for future growth opportunities.
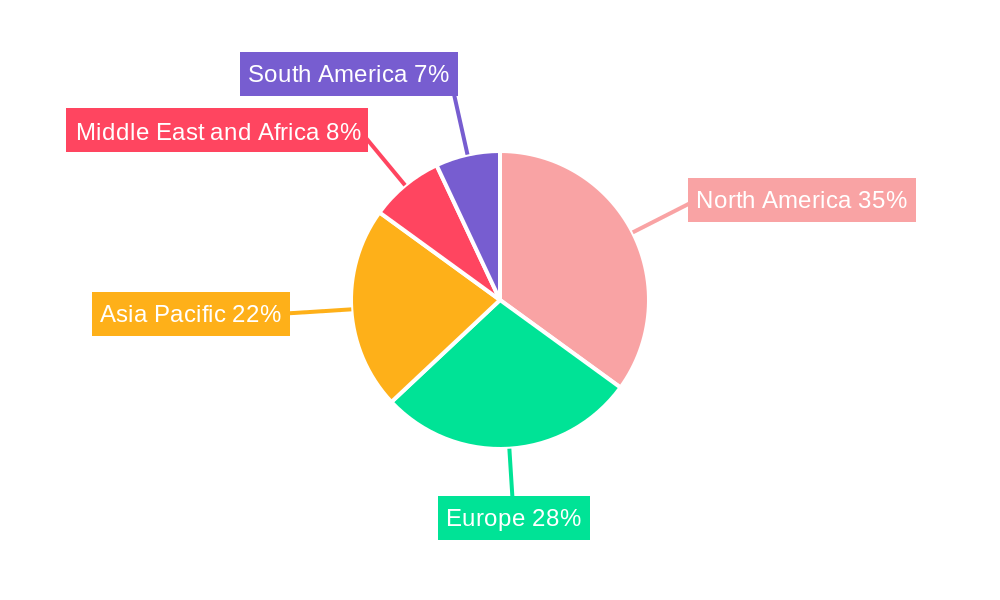
Dominant Regions & Segments in Medical Nutrition Industry
The North American region currently leads the global Medical Nutrition market. This dominance is attributed to substantial healthcare expenditure, highly developed healthcare infrastructure, and a considerable aging population within the region. Within the applications landscape, Nutritional Support for Malnutrition and Nutritional Support for Gastrointestinal Diseases stand out as the largest segments, driven by their high prevalence rates. In terms of end-users, the Adult segment accounts for the largest share. Currently, oral and enteral routes of administration are the most prevalent, however, the parenteral route is anticipated to experience substantial growth in the coming years, largely propelled by ongoing technological advancements in its application.
- Key Drivers in North America: Substantial healthcare expenditure, sophisticated healthcare infrastructure, and a significant aging population.
- Largest Application Segments: Nutritional Support for Malnutrition and Nutritional Support for Gastrointestinal Diseases.
- Dominant End-User Segment: Adult population.
- Leading Route of Administration: Oral and Enteral currently dominate, with Parenteral showing significant future growth potential.
Medical Nutrition Industry Product Innovations
Recent groundbreaking innovations in the Medical Nutrition industry are centered around the development of highly personalized nutrition solutions meticulously designed to meet the unique needs of individual patients. Furthermore, there have been significant advancements in improving product formulations to enhance palatability and optimize nutrient absorption. The evolution of advanced delivery systems is also a key area of focus, aimed at significantly improving patient compliance and ease of use. These innovations are strategically aligned with the escalating market demand for products that offer superior efficacy, unparalleled convenience, and precisely tailored solutions, thereby driving substantial market expansion and setting new benchmarks for patient care.
Report Scope & Segmentation Analysis
This report segments the Medical Nutrition market by application (Nutritional Support for Malnutrition, Metabolic Disorders, Gastrointestinal Diseases, Cancer, Neurological Diseases, and Other Diseases), end-user (Pediatric and Adult), and route of administration (Oral & Enteral, Parenteral). Each segment's growth projections, market sizes, and competitive dynamics are analyzed in detail. The report includes individual assessments of the market size, growth projections, and competitive dynamics of each segment and sub-segment. For instance, the Nutritional Support for Malnutrition segment is projected to reach $XX Billion by 2033, driven by rising prevalence of malnutrition globally.
Key Drivers of Medical Nutrition Industry Growth
Key growth drivers include the rising prevalence of chronic diseases, an aging global population, increasing healthcare expenditure, technological advancements in personalized nutrition and delivery systems, and favorable government regulations supporting healthcare access. These factors collectively fuel demand for advanced medical nutrition solutions.
Challenges in the Medical Nutrition Industry Sector
Challenges include stringent regulatory requirements impacting product approvals and market entry, complex supply chains susceptible to disruptions, and intense competition from established and emerging players. These factors can negatively affect profitability and market access. Specifically, regulatory hurdles delay product launches by an average of xx months, significantly impacting market entry.
Emerging Opportunities in Medical Nutrition Industry
Emerging opportunities lie in personalized nutrition solutions leveraging genomic and other data for tailored interventions, expansion into emerging markets with rising healthcare expenditure and prevalence of chronic diseases, and developing innovative delivery systems improving patient compliance and outcomes.
Leading Players in the Medical Nutrition Industry Market
- Medifood International Ltd
- Abbott Laboratories (Abbott Nutrition)
- Fresenius Kabi
- Danone (Nutricia)
- Perrigo Company PLC
- Nestle Health Science
- Ajinomoto Cambrooke Inc (Nualtra Ltd)
- AYMES International Ltd
- Baxter Healthcare
- B Braun SE
- Reckitt Benckiser
Key Developments in Medical Nutrition Industry
- October 2022: Hologram Sciences and Maeil Health Nutrition forged a strategic alliance to introduce innovative personalized nutrition solutions to the South Korean market.
- April 2022: Glanbia Nutritionals unveiled TechVantage, a pioneering platform for functionally optimized nutrient technology.
Future Outlook for Medical Nutrition Industry Market
The Medical Nutrition market is poised for continued robust growth, driven by sustained demand for effective nutritional solutions, technological advancements, and expansion into new markets. Strategic partnerships and product innovation will be key for companies to succeed in this competitive landscape. We project the market to reach $XX Billion by 2033, representing a significant growth opportunity.
Medical Nutrition Industry Segmentation
-
1. Route of Administration
- 1.1. Oral and Enteral
- 1.2. Parenteral
-
2. Application
- 2.1. Nutritional Support for Malnutrition
- 2.2. Nutritional Support for Metabolic Disorders
- 2.3. Nutritional Support for Gastrointestinal Diseases
- 2.4. Nutritional Support for Cancer
- 2.5. Nutritional Support in Neurological Diseases
- 2.6. Nutritional Support in Other Diseases
-
3. End User
- 3.1. Pediatric
- 3.2. Adult
Medical Nutrition Industry Segmentation By Geography
-
1. North America
- 1.1. United States
- 1.2. Canada
- 1.3. Mexico
-
2. Europe
- 2.1. Germany
- 2.2. United Kingdom
- 2.3. France
- 2.4. Italy
- 2.5. Spain
- 2.6. Rest of Europe
-
3. Asia Pacific
- 3.1. China
- 3.2. Japan
- 3.3. India
- 3.4. Australia
- 3.5. South Korea
- 3.6. Rest of Asia Pacific
-
4. Middle East and Africa
- 4.1. GCC
- 4.2. South Africa
- 4.3. Rest of Middle East and Africa
-
5. South America
- 5.1. Brazil
- 5.2. Argentina
- 5.3. Rest of South America
Medical Nutrition Industry Regional Market Share
Geographic Coverage of Medical Nutrition Industry
Medical Nutrition Industry REPORT HIGHLIGHTS
| Aspects | Details |
|---|---|
| Study Period | 2020-2034 |
| Base Year | 2025 |
| Estimated Year | 2026 |
| Forecast Period | 2026-2034 |
| Historical Period | 2020-2025 |
| Growth Rate | CAGR of 8.05% from 2020-2034 |
| Segmentation |
|
Table of Contents
- 1. Introduction
- 1.1. Research Scope
- 1.2. Market Segmentation
- 1.3. Research Objective
- 1.4. Definitions and Assumptions
- 2. Executive Summary
- 2.1. Market Snapshot
- 3. Market Dynamics
- 3.1. Market Drivers
- 3.2. Market Restrains
- 3.3. Market Trends
- 3.4. Market Opportunities
- 4. Market Factor Analysis
- 4.1. Porters Five Forces
- 4.1.1. Bargaining Power of Suppliers
- 4.1.2. Bargaining Power of Buyers
- 4.1.3. Threat of New Entrants
- 4.1.4. Threat of Substitutes
- 4.1.5. Competitive Rivalry
- 4.2. PESTEL analysis
- 4.3. BCG Analysis
- 4.3.1. Stars (High Growth, High Market Share)
- 4.3.2. Cash Cows (Low Growth, High Market Share)
- 4.3.3. Question Mark (High Growth, Low Market Share)
- 4.3.4. Dogs (Low Growth, Low Market Share)
- 4.4. Ansoff Matrix Analysis
- 4.5. Supply Chain Analysis
- 4.6. Regulatory Landscape
- 4.7. Current Market Potential and Opportunity Assessment (TAM–SAM–SOM Framework)
- 4.8. PRI Analyst Note
- 4.1. Porters Five Forces
- 5. Market Analysis, Insights and Forecast 2021-2033
- 5.1. Market Analysis, Insights and Forecast - by Route of Administration
- 5.1.1. Oral and Enteral
- 5.1.2. Parenteral
- 5.2. Market Analysis, Insights and Forecast - by Application
- 5.2.1. Nutritional Support for Malnutrition
- 5.2.2. Nutritional Support for Metabolic Disorders
- 5.2.3. Nutritional Support for Gastrointestinal Diseases
- 5.2.4. Nutritional Support for Cancer
- 5.2.5. Nutritional Support in Neurological Diseases
- 5.2.6. Nutritional Support in Other Diseases
- 5.3. Market Analysis, Insights and Forecast - by End User
- 5.3.1. Pediatric
- 5.3.2. Adult
- 5.4. Market Analysis, Insights and Forecast - by Region
- 5.4.1. North America
- 5.4.2. Europe
- 5.4.3. Asia Pacific
- 5.4.4. Middle East and Africa
- 5.4.5. South America
- 5.1. Market Analysis, Insights and Forecast - by Route of Administration
- 6. Global Medical Nutrition Industry Analysis, Insights and Forecast, 2021-2033
- 6.1. Market Analysis, Insights and Forecast - by Route of Administration
- 6.1.1. Oral and Enteral
- 6.1.2. Parenteral
- 6.2. Market Analysis, Insights and Forecast - by Application
- 6.2.1. Nutritional Support for Malnutrition
- 6.2.2. Nutritional Support for Metabolic Disorders
- 6.2.3. Nutritional Support for Gastrointestinal Diseases
- 6.2.4. Nutritional Support for Cancer
- 6.2.5. Nutritional Support in Neurological Diseases
- 6.2.6. Nutritional Support in Other Diseases
- 6.3. Market Analysis, Insights and Forecast - by End User
- 6.3.1. Pediatric
- 6.3.2. Adult
- 6.1. Market Analysis, Insights and Forecast - by Route of Administration
- 7. North America Medical Nutrition Industry Analysis, Insights and Forecast, 2020-2032
- 7.1. Market Analysis, Insights and Forecast - by Route of Administration
- 7.1.1. Oral and Enteral
- 7.1.2. Parenteral
- 7.2. Market Analysis, Insights and Forecast - by Application
- 7.2.1. Nutritional Support for Malnutrition
- 7.2.2. Nutritional Support for Metabolic Disorders
- 7.2.3. Nutritional Support for Gastrointestinal Diseases
- 7.2.4. Nutritional Support for Cancer
- 7.2.5. Nutritional Support in Neurological Diseases
- 7.2.6. Nutritional Support in Other Diseases
- 7.3. Market Analysis, Insights and Forecast - by End User
- 7.3.1. Pediatric
- 7.3.2. Adult
- 7.1. Market Analysis, Insights and Forecast - by Route of Administration
- 8. Europe Medical Nutrition Industry Analysis, Insights and Forecast, 2020-2032
- 8.1. Market Analysis, Insights and Forecast - by Route of Administration
- 8.1.1. Oral and Enteral
- 8.1.2. Parenteral
- 8.2. Market Analysis, Insights and Forecast - by Application
- 8.2.1. Nutritional Support for Malnutrition
- 8.2.2. Nutritional Support for Metabolic Disorders
- 8.2.3. Nutritional Support for Gastrointestinal Diseases
- 8.2.4. Nutritional Support for Cancer
- 8.2.5. Nutritional Support in Neurological Diseases
- 8.2.6. Nutritional Support in Other Diseases
- 8.3. Market Analysis, Insights and Forecast - by End User
- 8.3.1. Pediatric
- 8.3.2. Adult
- 8.1. Market Analysis, Insights and Forecast - by Route of Administration
- 9. Asia Pacific Medical Nutrition Industry Analysis, Insights and Forecast, 2020-2032
- 9.1. Market Analysis, Insights and Forecast - by Route of Administration
- 9.1.1. Oral and Enteral
- 9.1.2. Parenteral
- 9.2. Market Analysis, Insights and Forecast - by Application
- 9.2.1. Nutritional Support for Malnutrition
- 9.2.2. Nutritional Support for Metabolic Disorders
- 9.2.3. Nutritional Support for Gastrointestinal Diseases
- 9.2.4. Nutritional Support for Cancer
- 9.2.5. Nutritional Support in Neurological Diseases
- 9.2.6. Nutritional Support in Other Diseases
- 9.3. Market Analysis, Insights and Forecast - by End User
- 9.3.1. Pediatric
- 9.3.2. Adult
- 9.1. Market Analysis, Insights and Forecast - by Route of Administration
- 10. Middle East and Africa Medical Nutrition Industry Analysis, Insights and Forecast, 2020-2032
- 10.1. Market Analysis, Insights and Forecast - by Route of Administration
- 10.1.1. Oral and Enteral
- 10.1.2. Parenteral
- 10.2. Market Analysis, Insights and Forecast - by Application
- 10.2.1. Nutritional Support for Malnutrition
- 10.2.2. Nutritional Support for Metabolic Disorders
- 10.2.3. Nutritional Support for Gastrointestinal Diseases
- 10.2.4. Nutritional Support for Cancer
- 10.2.5. Nutritional Support in Neurological Diseases
- 10.2.6. Nutritional Support in Other Diseases
- 10.3. Market Analysis, Insights and Forecast - by End User
- 10.3.1. Pediatric
- 10.3.2. Adult
- 10.1. Market Analysis, Insights and Forecast - by Route of Administration
- 11. South America Medical Nutrition Industry Analysis, Insights and Forecast, 2020-2032
- 11.1. Market Analysis, Insights and Forecast - by Route of Administration
- 11.1.1. Oral and Enteral
- 11.1.2. Parenteral
- 11.2. Market Analysis, Insights and Forecast - by Application
- 11.2.1. Nutritional Support for Malnutrition
- 11.2.2. Nutritional Support for Metabolic Disorders
- 11.2.3. Nutritional Support for Gastrointestinal Diseases
- 11.2.4. Nutritional Support for Cancer
- 11.2.5. Nutritional Support in Neurological Diseases
- 11.2.6. Nutritional Support in Other Diseases
- 11.3. Market Analysis, Insights and Forecast - by End User
- 11.3.1. Pediatric
- 11.3.2. Adult
- 11.1. Market Analysis, Insights and Forecast - by Route of Administration
- 12. Competitive Analysis
- 12.1. Company Profiles
- 12.1.1 Medifood International Ltd
- 12.1.1.1. Company Overview
- 12.1.1.2. Products
- 12.1.1.3. Company Financials
- 12.1.1.4. SWOT Analysis
- 12.1.2 Abbott Laboratories (Abbott Nutrition)
- 12.1.2.1. Company Overview
- 12.1.2.2. Products
- 12.1.2.3. Company Financials
- 12.1.2.4. SWOT Analysis
- 12.1.3 Fresenius Kabi
- 12.1.3.1. Company Overview
- 12.1.3.2. Products
- 12.1.3.3. Company Financials
- 12.1.3.4. SWOT Analysis
- 12.1.4 Danone (Nutricia)
- 12.1.4.1. Company Overview
- 12.1.4.2. Products
- 12.1.4.3. Company Financials
- 12.1.4.4. SWOT Analysis
- 12.1.5 Perrigo Company PLC
- 12.1.5.1. Company Overview
- 12.1.5.2. Products
- 12.1.5.3. Company Financials
- 12.1.5.4. SWOT Analysis
- 12.1.6 Nestle Health Science
- 12.1.6.1. Company Overview
- 12.1.6.2. Products
- 12.1.6.3. Company Financials
- 12.1.6.4. SWOT Analysis
- 12.1.7 Ajinomoto Cambrooke Inc (Nualtra Ltd)
- 12.1.7.1. Company Overview
- 12.1.7.2. Products
- 12.1.7.3. Company Financials
- 12.1.7.4. SWOT Analysis
- 12.1.8 AYMES International Ltd
- 12.1.8.1. Company Overview
- 12.1.8.2. Products
- 12.1.8.3. Company Financials
- 12.1.8.4. SWOT Analysis
- 12.1.9 Baxter Healthcare
- 12.1.9.1. Company Overview
- 12.1.9.2. Products
- 12.1.9.3. Company Financials
- 12.1.9.4. SWOT Analysis
- 12.1.10 B Braun SE
- 12.1.10.1. Company Overview
- 12.1.10.2. Products
- 12.1.10.3. Company Financials
- 12.1.10.4. SWOT Analysis
- 12.1.11 Reckitt Benckiser
- 12.1.11.1. Company Overview
- 12.1.11.2. Products
- 12.1.11.3. Company Financials
- 12.1.11.4. SWOT Analysis
- 12.1.1 Medifood International Ltd
- 12.2. Market Entropy
- 12.2.1 Company's Key Areas Served
- 12.2.2 Recent Developments
- 12.3. Company Market Share Analysis 2025
- 12.3.1 Top 5 Companies Market Share Analysis
- 12.3.2 Top 3 Companies Market Share Analysis
- 12.4. List of Potential Customers
- 13. Research Methodology
List of Figures
- Figure 1: Global Medical Nutrition Industry Revenue Breakdown (Million, %) by Region 2025 & 2033
- Figure 2: Global Medical Nutrition Industry Volume Breakdown (K Unit, %) by Region 2025 & 2033
- Figure 3: North America Medical Nutrition Industry Revenue (Million), by Route of Administration 2025 & 2033
- Figure 4: North America Medical Nutrition Industry Volume (K Unit), by Route of Administration 2025 & 2033
- Figure 5: North America Medical Nutrition Industry Revenue Share (%), by Route of Administration 2025 & 2033
- Figure 6: North America Medical Nutrition Industry Volume Share (%), by Route of Administration 2025 & 2033
- Figure 7: North America Medical Nutrition Industry Revenue (Million), by Application 2025 & 2033
- Figure 8: North America Medical Nutrition Industry Volume (K Unit), by Application 2025 & 2033
- Figure 9: North America Medical Nutrition Industry Revenue Share (%), by Application 2025 & 2033
- Figure 10: North America Medical Nutrition Industry Volume Share (%), by Application 2025 & 2033
- Figure 11: North America Medical Nutrition Industry Revenue (Million), by End User 2025 & 2033
- Figure 12: North America Medical Nutrition Industry Volume (K Unit), by End User 2025 & 2033
- Figure 13: North America Medical Nutrition Industry Revenue Share (%), by End User 2025 & 2033
- Figure 14: North America Medical Nutrition Industry Volume Share (%), by End User 2025 & 2033
- Figure 15: North America Medical Nutrition Industry Revenue (Million), by Country 2025 & 2033
- Figure 16: North America Medical Nutrition Industry Volume (K Unit), by Country 2025 & 2033
- Figure 17: North America Medical Nutrition Industry Revenue Share (%), by Country 2025 & 2033
- Figure 18: North America Medical Nutrition Industry Volume Share (%), by Country 2025 & 2033
- Figure 19: Europe Medical Nutrition Industry Revenue (Million), by Route of Administration 2025 & 2033
- Figure 20: Europe Medical Nutrition Industry Volume (K Unit), by Route of Administration 2025 & 2033
- Figure 21: Europe Medical Nutrition Industry Revenue Share (%), by Route of Administration 2025 & 2033
- Figure 22: Europe Medical Nutrition Industry Volume Share (%), by Route of Administration 2025 & 2033
- Figure 23: Europe Medical Nutrition Industry Revenue (Million), by Application 2025 & 2033
- Figure 24: Europe Medical Nutrition Industry Volume (K Unit), by Application 2025 & 2033
- Figure 25: Europe Medical Nutrition Industry Revenue Share (%), by Application 2025 & 2033
- Figure 26: Europe Medical Nutrition Industry Volume Share (%), by Application 2025 & 2033
- Figure 27: Europe Medical Nutrition Industry Revenue (Million), by End User 2025 & 2033
- Figure 28: Europe Medical Nutrition Industry Volume (K Unit), by End User 2025 & 2033
- Figure 29: Europe Medical Nutrition Industry Revenue Share (%), by End User 2025 & 2033
- Figure 30: Europe Medical Nutrition Industry Volume Share (%), by End User 2025 & 2033
- Figure 31: Europe Medical Nutrition Industry Revenue (Million), by Country 2025 & 2033
- Figure 32: Europe Medical Nutrition Industry Volume (K Unit), by Country 2025 & 2033
- Figure 33: Europe Medical Nutrition Industry Revenue Share (%), by Country 2025 & 2033
- Figure 34: Europe Medical Nutrition Industry Volume Share (%), by Country 2025 & 2033
- Figure 35: Asia Pacific Medical Nutrition Industry Revenue (Million), by Route of Administration 2025 & 2033
- Figure 36: Asia Pacific Medical Nutrition Industry Volume (K Unit), by Route of Administration 2025 & 2033
- Figure 37: Asia Pacific Medical Nutrition Industry Revenue Share (%), by Route of Administration 2025 & 2033
- Figure 38: Asia Pacific Medical Nutrition Industry Volume Share (%), by Route of Administration 2025 & 2033
- Figure 39: Asia Pacific Medical Nutrition Industry Revenue (Million), by Application 2025 & 2033
- Figure 40: Asia Pacific Medical Nutrition Industry Volume (K Unit), by Application 2025 & 2033
- Figure 41: Asia Pacific Medical Nutrition Industry Revenue Share (%), by Application 2025 & 2033
- Figure 42: Asia Pacific Medical Nutrition Industry Volume Share (%), by Application 2025 & 2033
- Figure 43: Asia Pacific Medical Nutrition Industry Revenue (Million), by End User 2025 & 2033
- Figure 44: Asia Pacific Medical Nutrition Industry Volume (K Unit), by End User 2025 & 2033
- Figure 45: Asia Pacific Medical Nutrition Industry Revenue Share (%), by End User 2025 & 2033
- Figure 46: Asia Pacific Medical Nutrition Industry Volume Share (%), by End User 2025 & 2033
- Figure 47: Asia Pacific Medical Nutrition Industry Revenue (Million), by Country 2025 & 2033
- Figure 48: Asia Pacific Medical Nutrition Industry Volume (K Unit), by Country 2025 & 2033
- Figure 49: Asia Pacific Medical Nutrition Industry Revenue Share (%), by Country 2025 & 2033
- Figure 50: Asia Pacific Medical Nutrition Industry Volume Share (%), by Country 2025 & 2033
- Figure 51: Middle East and Africa Medical Nutrition Industry Revenue (Million), by Route of Administration 2025 & 2033
- Figure 52: Middle East and Africa Medical Nutrition Industry Volume (K Unit), by Route of Administration 2025 & 2033
- Figure 53: Middle East and Africa Medical Nutrition Industry Revenue Share (%), by Route of Administration 2025 & 2033
- Figure 54: Middle East and Africa Medical Nutrition Industry Volume Share (%), by Route of Administration 2025 & 2033
- Figure 55: Middle East and Africa Medical Nutrition Industry Revenue (Million), by Application 2025 & 2033
- Figure 56: Middle East and Africa Medical Nutrition Industry Volume (K Unit), by Application 2025 & 2033
- Figure 57: Middle East and Africa Medical Nutrition Industry Revenue Share (%), by Application 2025 & 2033
- Figure 58: Middle East and Africa Medical Nutrition Industry Volume Share (%), by Application 2025 & 2033
- Figure 59: Middle East and Africa Medical Nutrition Industry Revenue (Million), by End User 2025 & 2033
- Figure 60: Middle East and Africa Medical Nutrition Industry Volume (K Unit), by End User 2025 & 2033
- Figure 61: Middle East and Africa Medical Nutrition Industry Revenue Share (%), by End User 2025 & 2033
- Figure 62: Middle East and Africa Medical Nutrition Industry Volume Share (%), by End User 2025 & 2033
- Figure 63: Middle East and Africa Medical Nutrition Industry Revenue (Million), by Country 2025 & 2033
- Figure 64: Middle East and Africa Medical Nutrition Industry Volume (K Unit), by Country 2025 & 2033
- Figure 65: Middle East and Africa Medical Nutrition Industry Revenue Share (%), by Country 2025 & 2033
- Figure 66: Middle East and Africa Medical Nutrition Industry Volume Share (%), by Country 2025 & 2033
- Figure 67: South America Medical Nutrition Industry Revenue (Million), by Route of Administration 2025 & 2033
- Figure 68: South America Medical Nutrition Industry Volume (K Unit), by Route of Administration 2025 & 2033
- Figure 69: South America Medical Nutrition Industry Revenue Share (%), by Route of Administration 2025 & 2033
- Figure 70: South America Medical Nutrition Industry Volume Share (%), by Route of Administration 2025 & 2033
- Figure 71: South America Medical Nutrition Industry Revenue (Million), by Application 2025 & 2033
- Figure 72: South America Medical Nutrition Industry Volume (K Unit), by Application 2025 & 2033
- Figure 73: South America Medical Nutrition Industry Revenue Share (%), by Application 2025 & 2033
- Figure 74: South America Medical Nutrition Industry Volume Share (%), by Application 2025 & 2033
- Figure 75: South America Medical Nutrition Industry Revenue (Million), by End User 2025 & 2033
- Figure 76: South America Medical Nutrition Industry Volume (K Unit), by End User 2025 & 2033
- Figure 77: South America Medical Nutrition Industry Revenue Share (%), by End User 2025 & 2033
- Figure 78: South America Medical Nutrition Industry Volume Share (%), by End User 2025 & 2033
- Figure 79: South America Medical Nutrition Industry Revenue (Million), by Country 2025 & 2033
- Figure 80: South America Medical Nutrition Industry Volume (K Unit), by Country 2025 & 2033
- Figure 81: South America Medical Nutrition Industry Revenue Share (%), by Country 2025 & 2033
- Figure 82: South America Medical Nutrition Industry Volume Share (%), by Country 2025 & 2033
List of Tables
- Table 1: Global Medical Nutrition Industry Revenue Million Forecast, by Route of Administration 2020 & 2033
- Table 2: Global Medical Nutrition Industry Volume K Unit Forecast, by Route of Administration 2020 & 2033
- Table 3: Global Medical Nutrition Industry Revenue Million Forecast, by Application 2020 & 2033
- Table 4: Global Medical Nutrition Industry Volume K Unit Forecast, by Application 2020 & 2033
- Table 5: Global Medical Nutrition Industry Revenue Million Forecast, by End User 2020 & 2033
- Table 6: Global Medical Nutrition Industry Volume K Unit Forecast, by End User 2020 & 2033
- Table 7: Global Medical Nutrition Industry Revenue Million Forecast, by Region 2020 & 2033
- Table 8: Global Medical Nutrition Industry Volume K Unit Forecast, by Region 2020 & 2033
- Table 9: Global Medical Nutrition Industry Revenue Million Forecast, by Route of Administration 2020 & 2033
- Table 10: Global Medical Nutrition Industry Volume K Unit Forecast, by Route of Administration 2020 & 2033
- Table 11: Global Medical Nutrition Industry Revenue Million Forecast, by Application 2020 & 2033
- Table 12: Global Medical Nutrition Industry Volume K Unit Forecast, by Application 2020 & 2033
- Table 13: Global Medical Nutrition Industry Revenue Million Forecast, by End User 2020 & 2033
- Table 14: Global Medical Nutrition Industry Volume K Unit Forecast, by End User 2020 & 2033
- Table 15: Global Medical Nutrition Industry Revenue Million Forecast, by Country 2020 & 2033
- Table 16: Global Medical Nutrition Industry Volume K Unit Forecast, by Country 2020 & 2033
- Table 17: United States Medical Nutrition Industry Revenue (Million) Forecast, by Application 2020 & 2033
- Table 18: United States Medical Nutrition Industry Volume (K Unit) Forecast, by Application 2020 & 2033
- Table 19: Canada Medical Nutrition Industry Revenue (Million) Forecast, by Application 2020 & 2033
- Table 20: Canada Medical Nutrition Industry Volume (K Unit) Forecast, by Application 2020 & 2033
- Table 21: Mexico Medical Nutrition Industry Revenue (Million) Forecast, by Application 2020 & 2033
- Table 22: Mexico Medical Nutrition Industry Volume (K Unit) Forecast, by Application 2020 & 2033
- Table 23: Global Medical Nutrition Industry Revenue Million Forecast, by Route of Administration 2020 & 2033
- Table 24: Global Medical Nutrition Industry Volume K Unit Forecast, by Route of Administration 2020 & 2033
- Table 25: Global Medical Nutrition Industry Revenue Million Forecast, by Application 2020 & 2033
- Table 26: Global Medical Nutrition Industry Volume K Unit Forecast, by Application 2020 & 2033
- Table 27: Global Medical Nutrition Industry Revenue Million Forecast, by End User 2020 & 2033
- Table 28: Global Medical Nutrition Industry Volume K Unit Forecast, by End User 2020 & 2033
- Table 29: Global Medical Nutrition Industry Revenue Million Forecast, by Country 2020 & 2033
- Table 30: Global Medical Nutrition Industry Volume K Unit Forecast, by Country 2020 & 2033
- Table 31: Germany Medical Nutrition Industry Revenue (Million) Forecast, by Application 2020 & 2033
- Table 32: Germany Medical Nutrition Industry Volume (K Unit) Forecast, by Application 2020 & 2033
- Table 33: United Kingdom Medical Nutrition Industry Revenue (Million) Forecast, by Application 2020 & 2033
- Table 34: United Kingdom Medical Nutrition Industry Volume (K Unit) Forecast, by Application 2020 & 2033
- Table 35: France Medical Nutrition Industry Revenue (Million) Forecast, by Application 2020 & 2033
- Table 36: France Medical Nutrition Industry Volume (K Unit) Forecast, by Application 2020 & 2033
- Table 37: Italy Medical Nutrition Industry Revenue (Million) Forecast, by Application 2020 & 2033
- Table 38: Italy Medical Nutrition Industry Volume (K Unit) Forecast, by Application 2020 & 2033
- Table 39: Spain Medical Nutrition Industry Revenue (Million) Forecast, by Application 2020 & 2033
- Table 40: Spain Medical Nutrition Industry Volume (K Unit) Forecast, by Application 2020 & 2033
- Table 41: Rest of Europe Medical Nutrition Industry Revenue (Million) Forecast, by Application 2020 & 2033
- Table 42: Rest of Europe Medical Nutrition Industry Volume (K Unit) Forecast, by Application 2020 & 2033
- Table 43: Global Medical Nutrition Industry Revenue Million Forecast, by Route of Administration 2020 & 2033
- Table 44: Global Medical Nutrition Industry Volume K Unit Forecast, by Route of Administration 2020 & 2033
- Table 45: Global Medical Nutrition Industry Revenue Million Forecast, by Application 2020 & 2033
- Table 46: Global Medical Nutrition Industry Volume K Unit Forecast, by Application 2020 & 2033
- Table 47: Global Medical Nutrition Industry Revenue Million Forecast, by End User 2020 & 2033
- Table 48: Global Medical Nutrition Industry Volume K Unit Forecast, by End User 2020 & 2033
- Table 49: Global Medical Nutrition Industry Revenue Million Forecast, by Country 2020 & 2033
- Table 50: Global Medical Nutrition Industry Volume K Unit Forecast, by Country 2020 & 2033
- Table 51: China Medical Nutrition Industry Revenue (Million) Forecast, by Application 2020 & 2033
- Table 52: China Medical Nutrition Industry Volume (K Unit) Forecast, by Application 2020 & 2033
- Table 53: Japan Medical Nutrition Industry Revenue (Million) Forecast, by Application 2020 & 2033
- Table 54: Japan Medical Nutrition Industry Volume (K Unit) Forecast, by Application 2020 & 2033
- Table 55: India Medical Nutrition Industry Revenue (Million) Forecast, by Application 2020 & 2033
- Table 56: India Medical Nutrition Industry Volume (K Unit) Forecast, by Application 2020 & 2033
- Table 57: Australia Medical Nutrition Industry Revenue (Million) Forecast, by Application 2020 & 2033
- Table 58: Australia Medical Nutrition Industry Volume (K Unit) Forecast, by Application 2020 & 2033
- Table 59: South Korea Medical Nutrition Industry Revenue (Million) Forecast, by Application 2020 & 2033
- Table 60: South Korea Medical Nutrition Industry Volume (K Unit) Forecast, by Application 2020 & 2033
- Table 61: Rest of Asia Pacific Medical Nutrition Industry Revenue (Million) Forecast, by Application 2020 & 2033
- Table 62: Rest of Asia Pacific Medical Nutrition Industry Volume (K Unit) Forecast, by Application 2020 & 2033
- Table 63: Global Medical Nutrition Industry Revenue Million Forecast, by Route of Administration 2020 & 2033
- Table 64: Global Medical Nutrition Industry Volume K Unit Forecast, by Route of Administration 2020 & 2033
- Table 65: Global Medical Nutrition Industry Revenue Million Forecast, by Application 2020 & 2033
- Table 66: Global Medical Nutrition Industry Volume K Unit Forecast, by Application 2020 & 2033
- Table 67: Global Medical Nutrition Industry Revenue Million Forecast, by End User 2020 & 2033
- Table 68: Global Medical Nutrition Industry Volume K Unit Forecast, by End User 2020 & 2033
- Table 69: Global Medical Nutrition Industry Revenue Million Forecast, by Country 2020 & 2033
- Table 70: Global Medical Nutrition Industry Volume K Unit Forecast, by Country 2020 & 2033
- Table 71: GCC Medical Nutrition Industry Revenue (Million) Forecast, by Application 2020 & 2033
- Table 72: GCC Medical Nutrition Industry Volume (K Unit) Forecast, by Application 2020 & 2033
- Table 73: South Africa Medical Nutrition Industry Revenue (Million) Forecast, by Application 2020 & 2033
- Table 74: South Africa Medical Nutrition Industry Volume (K Unit) Forecast, by Application 2020 & 2033
- Table 75: Rest of Middle East and Africa Medical Nutrition Industry Revenue (Million) Forecast, by Application 2020 & 2033
- Table 76: Rest of Middle East and Africa Medical Nutrition Industry Volume (K Unit) Forecast, by Application 2020 & 2033
- Table 77: Global Medical Nutrition Industry Revenue Million Forecast, by Route of Administration 2020 & 2033
- Table 78: Global Medical Nutrition Industry Volume K Unit Forecast, by Route of Administration 2020 & 2033
- Table 79: Global Medical Nutrition Industry Revenue Million Forecast, by Application 2020 & 2033
- Table 80: Global Medical Nutrition Industry Volume K Unit Forecast, by Application 2020 & 2033
- Table 81: Global Medical Nutrition Industry Revenue Million Forecast, by End User 2020 & 2033
- Table 82: Global Medical Nutrition Industry Volume K Unit Forecast, by End User 2020 & 2033
- Table 83: Global Medical Nutrition Industry Revenue Million Forecast, by Country 2020 & 2033
- Table 84: Global Medical Nutrition Industry Volume K Unit Forecast, by Country 2020 & 2033
- Table 85: Brazil Medical Nutrition Industry Revenue (Million) Forecast, by Application 2020 & 2033
- Table 86: Brazil Medical Nutrition Industry Volume (K Unit) Forecast, by Application 2020 & 2033
- Table 87: Argentina Medical Nutrition Industry Revenue (Million) Forecast, by Application 2020 & 2033
- Table 88: Argentina Medical Nutrition Industry Volume (K Unit) Forecast, by Application 2020 & 2033
- Table 89: Rest of South America Medical Nutrition Industry Revenue (Million) Forecast, by Application 2020 & 2033
- Table 90: Rest of South America Medical Nutrition Industry Volume (K Unit) Forecast, by Application 2020 & 2033
Frequently Asked Questions
1. What is the projected Compound Annual Growth Rate (CAGR) of the Medical Nutrition Industry?
The projected CAGR is approximately 8.05%.
2. Which companies are prominent players in the Medical Nutrition Industry?
Key companies in the market include Medifood International Ltd, Abbott Laboratories (Abbott Nutrition), Fresenius Kabi, Danone (Nutricia), Perrigo Company PLC, Nestle Health Science, Ajinomoto Cambrooke Inc (Nualtra Ltd), AYMES International Ltd, Baxter Healthcare, B Braun SE, Reckitt Benckiser.
3. What are the main segments of the Medical Nutrition Industry?
The market segments include Route of Administration, Application, End User.
4. Can you provide details about the market size?
The market size is estimated to be USD 72.29 Million as of 2022.
5. What are some drivers contributing to market growth?
Increasing Prevalence of Metabolic Disorders; High Spending on Healthcare; Growing Geriatric Population.
6. What are the notable trends driving market growth?
Oral and Enteral Segment is Expected to Hold a Significant Market Share Over the Forecast Period.
7. Are there any restraints impacting market growth?
Imprecise Perception About Clinical Nutrition; Reduction in Birth Rates.
8. Can you provide examples of recent developments in the market?
October 2022: Hologram Sciences, and Maeil Health Nutrition entered into a strategic partnership to deliver personalized nutrition solutions to the Korean market.
9. What pricing options are available for accessing the report?
Pricing options include single-user, multi-user, and enterprise licenses priced at USD 4750, USD 5250, and USD 8750 respectively.
10. Is the market size provided in terms of value or volume?
The market size is provided in terms of value, measured in Million and volume, measured in K Unit.
11. Are there any specific market keywords associated with the report?
Yes, the market keyword associated with the report is "Medical Nutrition Industry," which aids in identifying and referencing the specific market segment covered.
12. How do I determine which pricing option suits my needs best?
The pricing options vary based on user requirements and access needs. Individual users may opt for single-user licenses, while businesses requiring broader access may choose multi-user or enterprise licenses for cost-effective access to the report.
13. Are there any additional resources or data provided in the Medical Nutrition Industry report?
While the report offers comprehensive insights, it's advisable to review the specific contents or supplementary materials provided to ascertain if additional resources or data are available.
14. How can I stay updated on further developments or reports in the Medical Nutrition Industry?
To stay informed about further developments, trends, and reports in the Medical Nutrition Industry, consider subscribing to industry newsletters, following relevant companies and organizations, or regularly checking reputable industry news sources and publications.
Methodology
Step 1 - Identification of Relevant Samples Size from Population Database


Step 2 - Approaches for Defining Global Market Size (Value, Volume* & Price*)

Note*: In applicable scenarios
Step 3 - Data Sources
Primary Research
- Web Analytics
- Survey Reports
- Research Institute
- Latest Research Reports
- Opinion Leaders
Secondary Research
- Annual Reports
- White Paper
- Latest Press Release
- Industry Association
- Paid Database
- Investor Presentations

Step 4 - Data Triangulation
Involves using different sources of information in order to increase the validity of a study
These sources are likely to be stakeholders in a program - participants, other researchers, program staff, other community members, and so on.
Then we put all data in single framework & apply various statistical tools to find out the dynamic on the market.
During the analysis stage, feedback from the stakeholder groups would be compared to determine areas of agreement as well as areas of divergence