
Key Insights
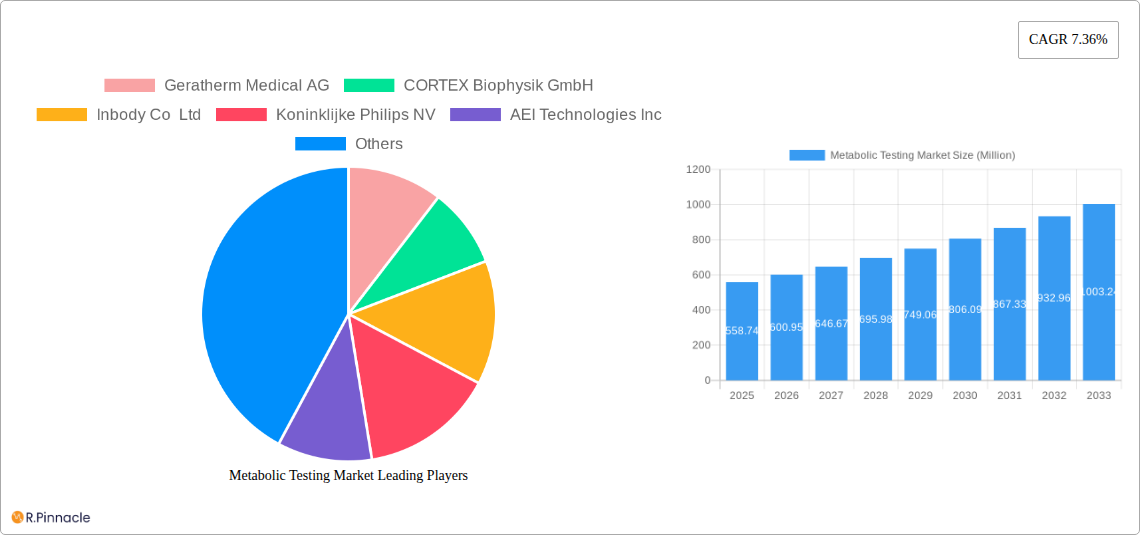
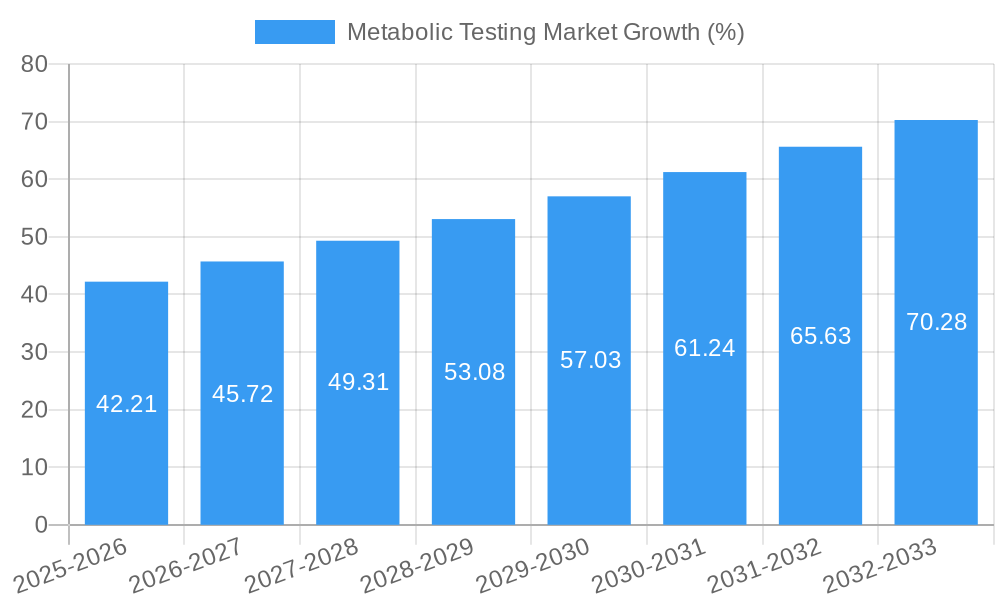
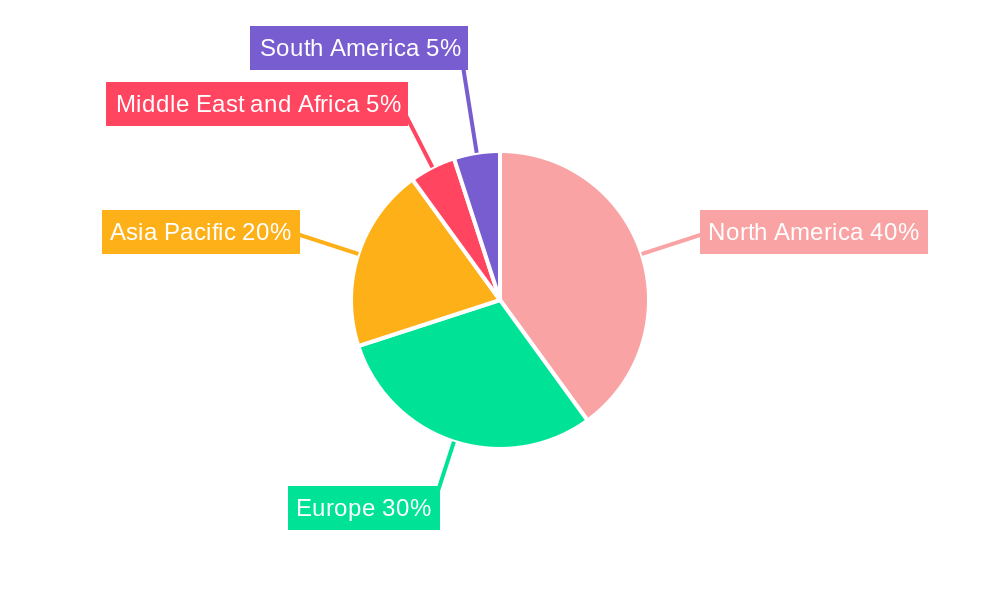
The global metabolic testing market, valued at $558.74 million in 2025, is projected to experience robust growth, driven by increasing prevalence of chronic lifestyle diseases like diabetes and obesity, coupled with rising demand for personalized medicine. The market's Compound Annual Growth Rate (CAGR) of 7.36% from 2025 to 2033 indicates significant expansion opportunities. Key drivers include advancements in technology leading to more accurate and efficient testing equipment, growing awareness about the importance of early disease detection and prevention, and increasing investment in healthcare infrastructure, particularly in developing economies. The market segmentation reveals a strong demand for body composition analyzers and cardiopulmonary exercise testing (CPET) systems across various end-users, including hospitals and clinics, and increasingly, sports training centers focusing on performance optimization and injury prevention. North America currently holds a significant market share, attributable to advanced healthcare infrastructure and high adoption rates of advanced diagnostic technologies. However, the Asia-Pacific region is poised for substantial growth due to rising healthcare expenditure and increasing awareness regarding metabolic health. The market faces challenges including high costs associated with sophisticated equipment and the need for skilled professionals to operate and interpret the results. Nevertheless, technological innovation and the growing focus on preventative healthcare are expected to mitigate these restraints.
Continued expansion within the metabolic testing market is anticipated due to several converging factors. The rising prevalence of obesity and related metabolic disorders creates a substantial unmet clinical need. This, combined with the burgeoning field of precision medicine, is driving demand for more sophisticated and individualized diagnostic approaches. Furthermore, the integration of metabolic testing into routine healthcare assessments is increasing, particularly in preventive and personalized care settings. The increasing accessibility and affordability of testing technologies, as well as growing reimbursement coverage by insurance providers, are likely to further stimulate market growth in the coming years. Competition among key players is intense, with continuous innovation in technology and services leading to improved diagnostic capabilities and patient outcomes. Strategic partnerships and acquisitions will likely shape the market landscape in the future, driving consolidation and expanding access to advanced metabolic testing solutions globally.
This in-depth report provides a comprehensive analysis of the global Metabolic Testing Market, offering valuable insights for industry professionals, investors, and strategic decision-makers. With a study period spanning 2019-2033, a base year of 2025, and a forecast period of 2025-2033, this report delivers actionable intelligence on market size, growth drivers, challenges, and future opportunities. The market is segmented by equipment type, application, and end-user, providing a granular understanding of the diverse landscape. The report also profiles key players like Geratherm Medical AG, CORTEX Biophysik GmbH, and Inbody Co Ltd., among others, analyzing their strategies and market positions. The total market value is predicted to reach xx Million by 2033.
Metabolic Testing Market Structure & Innovation Trends
The Metabolic Testing Market exhibits a moderately concentrated structure, with several key players holding significant market share. However, the presence of numerous smaller companies and the continuous emergence of innovative technologies contribute to a dynamic competitive landscape. Market share data indicates that the top five players collectively account for approximately xx% of the global market in 2025, while the remaining share is distributed among numerous smaller participants. Innovation is driven primarily by advancements in sensor technology, data analytics, and AI-powered diagnostic tools. Regulatory frameworks vary across regions, influencing market access and product approvals. Product substitutes, such as simpler, less expensive diagnostic tools, present competitive challenges. The end-user demographic is broad, encompassing hospitals, clinics, sports training centers, and individual consumers. Mergers and acquisitions (M&A) activities have been moderate, with deal values averaging approximately xx Million in recent years, primarily focused on expanding product portfolios and geographic reach.
- Market Concentration: Moderately concentrated
- Top 5 Players Market Share: xx% (2025)
- Average M&A Deal Value: xx Million
Metabolic Testing Market Market Dynamics & Trends
The Metabolic Testing Market is experiencing robust growth, driven by several key factors. The increasing prevalence of lifestyle diseases, such as obesity and diabetes, is fueling demand for accurate and efficient metabolic testing. Technological advancements, including the development of portable and user-friendly devices, are making metabolic testing more accessible and convenient. Consumer preferences are shifting towards personalized healthcare solutions, driving demand for customized metabolic testing services. Competitive dynamics are characterized by continuous innovation, strategic partnerships, and the entry of new players. The market is projected to experience a Compound Annual Growth Rate (CAGR) of xx% during the forecast period (2025-2033), with market penetration increasing from xx% in 2025 to xx% by 2033.
Dominant Regions & Segments in Metabolic Testing Market
North America currently dominates the Metabolic Testing Market, driven by high healthcare expenditure, advanced medical infrastructure, and a high prevalence of lifestyle diseases. Within this region, the United States holds the largest market share.
Key Drivers in North America:
- High healthcare expenditure
- Advanced medical infrastructure
- High prevalence of lifestyle diseases
- Strong regulatory support for new medical technologies
Dominant Segments:
- Equipment Type: Body Composition Analyzers currently holds the largest market share, driven by increasing demand for accurate body composition assessments for both clinical and fitness purposes.
- Application: Lifestyle diseases segment is experiencing the fastest growth rate, due to increasing awareness of the importance of metabolic health.
- End User: Hospitals and Clinics continue to be the largest segment, followed by sports training centers that are increasingly adopting advanced metabolic testing technologies to optimize athlete performance.
Metabolic Testing Market Product Innovations
Recent innovations in metabolic testing include the integration of AI and machine learning for improved diagnostic accuracy and efficiency, along with the development of wearable sensors for continuous metabolic monitoring. These advancements have expanded the applications of metabolic testing beyond traditional clinical settings, creating new opportunities in preventative care, personalized medicine, and athletic performance optimization. The market fit for these innovations is strong, driven by the growing demand for convenient, accurate, and cost-effective metabolic testing solutions.
Report Scope & Segmentation Analysis
This report offers a comprehensive segmentation of the Metabolic Testing Market across several key parameters:
Equipment Type: Body Composition Analyzers, Cardiopulmonary Exercise Testing (CPET) Systems, ECG Systems, Metabolic Carts, Others. Each segment is analyzed with respect to market size, growth rate, and competitive dynamics.
Application: Critical Care, Lifestyle Diseases. Growth projections are provided for each segment based on anticipated market trends.
End User: Hospitals and Clinics, Sports Training Centers, Others. Competitive landscapes within each end-user segment are examined.
Key Drivers of Metabolic Testing Market Growth
The Metabolic Testing Market's growth is fueled by the increasing prevalence of chronic diseases (like diabetes and obesity), advancements in technology (portable and user-friendly devices), rising healthcare expenditure, and growing awareness of personalized medicine. Government initiatives promoting preventive healthcare further stimulate market expansion.
Challenges in the Metabolic Testing Market Sector
Challenges include high initial investment costs for advanced equipment, the need for skilled professionals to operate and interpret results, regulatory hurdles in some regions, and potential supply chain disruptions impacting the availability of critical components. These factors collectively can restrain market growth to a certain extent.
Emerging Opportunities in Metabolic Testing Market
Emerging opportunities lie in developing portable and cost-effective devices, integrating AI for improved diagnostics, expanding into new markets (e.g., home-based testing), and tailoring solutions to specific demographics. The focus on preventative care and personalized medicine is opening new avenues for growth.
Leading Players in the Metabolic Testing Market Market
- Geratherm Medical AG
- CORTEX Biophysik GmbH
- Inbody Co Ltd
- Koninklijke Philips NV
- AEI Technologies Inc
- COSMED srl
- KORR Medical Technologies Inc
- Becton Dickinson and Company (CareFusion Corporation)
- General Electric Company (GE Healthcare)
- Parvo Medics
- OSI Systems Inc
- MGC Diagnostics Corporation
Key Developments in Metabolic Testing Market Industry
- December 2022: Rutgers University and HeartSciences launched a multi-year collaboration to develop AI-based ECG algorithms for improved heart disease detection. This development signifies a significant advancement in the diagnostic capabilities of ECG systems within the metabolic testing market.
- September 2022: Fitbit launched three new fitness trackers in India, enhancing consumer access to heart rate, SpO2, and stress monitoring features. This expansion into wearable technology expands the market reach for metabolic health tracking and indirectly contributes to increased demand for more sophisticated clinical metabolic testing.
Future Outlook for Metabolic Testing Market Market
The future of the Metabolic Testing Market is promising, driven by continuous technological advancements, the increasing prevalence of chronic diseases, and the rising adoption of personalized medicine. Strategic partnerships, acquisitions, and the development of innovative products will continue to shape the market landscape, presenting significant growth opportunities for companies operating in this sector. The market is expected to witness further expansion and consolidation in the coming years.
Metabolic Testing Market Segmentation
-
1. Equipment Type
- 1.1. Body Composition Analyzers
- 1.2. Cardiopulmonary Exercise Testing (CPET) Systems
- 1.3. ECG Systems
- 1.4. Metabolic Carts
- 1.5. Others
-
2. Application
- 2.1. Critical Care
- 2.2. Lifestyle Diseases
-
3. End User
- 3.1. Hospitals and Clinics
- 3.2. Sports Training Centers
- 3.3. Others
Metabolic Testing Market Segmentation By Geography
-
1. North America
- 1.1. United States
- 1.2. Canada
- 1.3. Mexico
-
2. Europe
- 2.1. Germany
- 2.2. United Kingdom
- 2.3. France
- 2.4. Italy
- 2.5. Spain
- 2.6. Rest of Europe
-
3. Asia Pacific
- 3.1. China
- 3.2. Japan
- 3.3. India
- 3.4. Australia
- 3.5. South Korea
- 3.6. Rest of Asia Pacific
-
4. Middle East and Africa
- 4.1. GCC
- 4.2. South Africa
- 4.3. Rest of Middle East and Africa
-
5. South America
- 5.1. Brazil
- 5.2. Argentina
- 5.3. Rest of South America
Metabolic Testing Market REPORT HIGHLIGHTS
| Aspects | Details |
|---|---|
| Study Period | 2019-2033 |
| Base Year | 2024 |
| Estimated Year | 2025 |
| Forecast Period | 2025-2033 |
| Historical Period | 2019-2024 |
| Growth Rate | CAGR of 7.36% from 2019-2033 |
| Segmentation |
|
Table of Contents
- 1. Introduction
- 1.1. Research Scope
- 1.2. Market Segmentation
- 1.3. Research Methodology
- 1.4. Definitions and Assumptions
- 2. Executive Summary
- 2.1. Introduction
- 3. Market Dynamics
- 3.1. Introduction
- 3.2. Market Drivers
- 3.2.1. Increasing Incidence of Lifestyle Diseases; Technological Advancements in Metabolic Testing
- 3.3. Market Restrains
- 3.3.1. High Cost of Equipment and Software; Poor Reimbursement Policies
- 3.4. Market Trends
- 3.4.1. Body Composition Analyzers are Expected to Hold a Significant Market Share in the Market Over the Forecast Period
- 4. Market Factor Analysis
- 4.1. Porters Five Forces
- 4.2. Supply/Value Chain
- 4.3. PESTEL analysis
- 4.4. Market Entropy
- 4.5. Patent/Trademark Analysis
- 5. Global Metabolic Testing Market Analysis, Insights and Forecast, 2019-2031
- 5.1. Market Analysis, Insights and Forecast - by Equipment Type
- 5.1.1. Body Composition Analyzers
- 5.1.2. Cardiopulmonary Exercise Testing (CPET) Systems
- 5.1.3. ECG Systems
- 5.1.4. Metabolic Carts
- 5.1.5. Others
- 5.2. Market Analysis, Insights and Forecast - by Application
- 5.2.1. Critical Care
- 5.2.2. Lifestyle Diseases
- 5.3. Market Analysis, Insights and Forecast - by End User
- 5.3.1. Hospitals and Clinics
- 5.3.2. Sports Training Centers
- 5.3.3. Others
- 5.4. Market Analysis, Insights and Forecast - by Region
- 5.4.1. North America
- 5.4.2. Europe
- 5.4.3. Asia Pacific
- 5.4.4. Middle East and Africa
- 5.4.5. South America
- 5.1. Market Analysis, Insights and Forecast - by Equipment Type
- 6. North America Metabolic Testing Market Analysis, Insights and Forecast, 2019-2031
- 6.1. Market Analysis, Insights and Forecast - by Equipment Type
- 6.1.1. Body Composition Analyzers
- 6.1.2. Cardiopulmonary Exercise Testing (CPET) Systems
- 6.1.3. ECG Systems
- 6.1.4. Metabolic Carts
- 6.1.5. Others
- 6.2. Market Analysis, Insights and Forecast - by Application
- 6.2.1. Critical Care
- 6.2.2. Lifestyle Diseases
- 6.3. Market Analysis, Insights and Forecast - by End User
- 6.3.1. Hospitals and Clinics
- 6.3.2. Sports Training Centers
- 6.3.3. Others
- 6.1. Market Analysis, Insights and Forecast - by Equipment Type
- 7. Europe Metabolic Testing Market Analysis, Insights and Forecast, 2019-2031
- 7.1. Market Analysis, Insights and Forecast - by Equipment Type
- 7.1.1. Body Composition Analyzers
- 7.1.2. Cardiopulmonary Exercise Testing (CPET) Systems
- 7.1.3. ECG Systems
- 7.1.4. Metabolic Carts
- 7.1.5. Others
- 7.2. Market Analysis, Insights and Forecast - by Application
- 7.2.1. Critical Care
- 7.2.2. Lifestyle Diseases
- 7.3. Market Analysis, Insights and Forecast - by End User
- 7.3.1. Hospitals and Clinics
- 7.3.2. Sports Training Centers
- 7.3.3. Others
- 7.1. Market Analysis, Insights and Forecast - by Equipment Type
- 8. Asia Pacific Metabolic Testing Market Analysis, Insights and Forecast, 2019-2031
- 8.1. Market Analysis, Insights and Forecast - by Equipment Type
- 8.1.1. Body Composition Analyzers
- 8.1.2. Cardiopulmonary Exercise Testing (CPET) Systems
- 8.1.3. ECG Systems
- 8.1.4. Metabolic Carts
- 8.1.5. Others
- 8.2. Market Analysis, Insights and Forecast - by Application
- 8.2.1. Critical Care
- 8.2.2. Lifestyle Diseases
- 8.3. Market Analysis, Insights and Forecast - by End User
- 8.3.1. Hospitals and Clinics
- 8.3.2. Sports Training Centers
- 8.3.3. Others
- 8.1. Market Analysis, Insights and Forecast - by Equipment Type
- 9. Middle East and Africa Metabolic Testing Market Analysis, Insights and Forecast, 2019-2031
- 9.1. Market Analysis, Insights and Forecast - by Equipment Type
- 9.1.1. Body Composition Analyzers
- 9.1.2. Cardiopulmonary Exercise Testing (CPET) Systems
- 9.1.3. ECG Systems
- 9.1.4. Metabolic Carts
- 9.1.5. Others
- 9.2. Market Analysis, Insights and Forecast - by Application
- 9.2.1. Critical Care
- 9.2.2. Lifestyle Diseases
- 9.3. Market Analysis, Insights and Forecast - by End User
- 9.3.1. Hospitals and Clinics
- 9.3.2. Sports Training Centers
- 9.3.3. Others
- 9.1. Market Analysis, Insights and Forecast - by Equipment Type
- 10. South America Metabolic Testing Market Analysis, Insights and Forecast, 2019-2031
- 10.1. Market Analysis, Insights and Forecast - by Equipment Type
- 10.1.1. Body Composition Analyzers
- 10.1.2. Cardiopulmonary Exercise Testing (CPET) Systems
- 10.1.3. ECG Systems
- 10.1.4. Metabolic Carts
- 10.1.5. Others
- 10.2. Market Analysis, Insights and Forecast - by Application
- 10.2.1. Critical Care
- 10.2.2. Lifestyle Diseases
- 10.3. Market Analysis, Insights and Forecast - by End User
- 10.3.1. Hospitals and Clinics
- 10.3.2. Sports Training Centers
- 10.3.3. Others
- 10.1. Market Analysis, Insights and Forecast - by Equipment Type
- 11. North America Metabolic Testing Market Analysis, Insights and Forecast, 2019-2031
- 11.1. Market Analysis, Insights and Forecast - By Country/Sub-region
- 11.1.1. undefined
- 12. Europe Metabolic Testing Market Analysis, Insights and Forecast, 2019-2031
- 12.1. Market Analysis, Insights and Forecast - By Country/Sub-region
- 12.1.1. undefined
- 13. Asia Pacific Metabolic Testing Market Analysis, Insights and Forecast, 2019-2031
- 13.1. Market Analysis, Insights and Forecast - By Country/Sub-region
- 13.1.1. undefined
- 14. Middle East and Africa Metabolic Testing Market Analysis, Insights and Forecast, 2019-2031
- 14.1. Market Analysis, Insights and Forecast - By Country/Sub-region
- 14.1.1. undefined
- 15. South America Metabolic Testing Market Analysis, Insights and Forecast, 2019-2031
- 15.1. Market Analysis, Insights and Forecast - By Country/Sub-region
- 15.1.1. undefined
- 16. Competitive Analysis
- 16.1. Global Market Share Analysis 2024
- 16.2. Company Profiles
- 16.2.1 Geratherm Medical AG
- 16.2.1.1. Overview
- 16.2.1.2. Products
- 16.2.1.3. SWOT Analysis
- 16.2.1.4. Recent Developments
- 16.2.1.5. Financials (Based on Availability)
- 16.2.2 CORTEX Biophysik GmbH
- 16.2.2.1. Overview
- 16.2.2.2. Products
- 16.2.2.3. SWOT Analysis
- 16.2.2.4. Recent Developments
- 16.2.2.5. Financials (Based on Availability)
- 16.2.3 Inbody Co Ltd
- 16.2.3.1. Overview
- 16.2.3.2. Products
- 16.2.3.3. SWOT Analysis
- 16.2.3.4. Recent Developments
- 16.2.3.5. Financials (Based on Availability)
- 16.2.4 Koninklijke Philips NV
- 16.2.4.1. Overview
- 16.2.4.2. Products
- 16.2.4.3. SWOT Analysis
- 16.2.4.4. Recent Developments
- 16.2.4.5. Financials (Based on Availability)
- 16.2.5 AEI Technologies Inc
- 16.2.5.1. Overview
- 16.2.5.2. Products
- 16.2.5.3. SWOT Analysis
- 16.2.5.4. Recent Developments
- 16.2.5.5. Financials (Based on Availability)
- 16.2.6 COSMED srl
- 16.2.6.1. Overview
- 16.2.6.2. Products
- 16.2.6.3. SWOT Analysis
- 16.2.6.4. Recent Developments
- 16.2.6.5. Financials (Based on Availability)
- 16.2.7 KORR Medical Technologies Inc
- 16.2.7.1. Overview
- 16.2.7.2. Products
- 16.2.7.3. SWOT Analysis
- 16.2.7.4. Recent Developments
- 16.2.7.5. Financials (Based on Availability)
- 16.2.8 Becton Dickinson and Company (CareFusion Corporation)
- 16.2.8.1. Overview
- 16.2.8.2. Products
- 16.2.8.3. SWOT Analysis
- 16.2.8.4. Recent Developments
- 16.2.8.5. Financials (Based on Availability)
- 16.2.9 General Electric Company (GE Healthcare)
- 16.2.9.1. Overview
- 16.2.9.2. Products
- 16.2.9.3. SWOT Analysis
- 16.2.9.4. Recent Developments
- 16.2.9.5. Financials (Based on Availability)
- 16.2.10 Parvo Medics
- 16.2.10.1. Overview
- 16.2.10.2. Products
- 16.2.10.3. SWOT Analysis
- 16.2.10.4. Recent Developments
- 16.2.10.5. Financials (Based on Availability)
- 16.2.11 OSI Systems Inc
- 16.2.11.1. Overview
- 16.2.11.2. Products
- 16.2.11.3. SWOT Analysis
- 16.2.11.4. Recent Developments
- 16.2.11.5. Financials (Based on Availability)
- 16.2.12 MGC Diagnostics Corporation
- 16.2.12.1. Overview
- 16.2.12.2. Products
- 16.2.12.3. SWOT Analysis
- 16.2.12.4. Recent Developments
- 16.2.12.5. Financials (Based on Availability)
- 16.2.1 Geratherm Medical AG
List of Figures
- Figure 1: Global Metabolic Testing Market Revenue Breakdown (Million, %) by Region 2024 & 2032
- Figure 2: Global Metabolic Testing Market Volume Breakdown (K Unit, %) by Region 2024 & 2032
- Figure 3: North America Metabolic Testing Market Revenue (Million), by Country 2024 & 2032
- Figure 4: North America Metabolic Testing Market Volume (K Unit), by Country 2024 & 2032
- Figure 5: North America Metabolic Testing Market Revenue Share (%), by Country 2024 & 2032
- Figure 6: North America Metabolic Testing Market Volume Share (%), by Country 2024 & 2032
- Figure 7: Europe Metabolic Testing Market Revenue (Million), by Country 2024 & 2032
- Figure 8: Europe Metabolic Testing Market Volume (K Unit), by Country 2024 & 2032
- Figure 9: Europe Metabolic Testing Market Revenue Share (%), by Country 2024 & 2032
- Figure 10: Europe Metabolic Testing Market Volume Share (%), by Country 2024 & 2032
- Figure 11: Asia Pacific Metabolic Testing Market Revenue (Million), by Country 2024 & 2032
- Figure 12: Asia Pacific Metabolic Testing Market Volume (K Unit), by Country 2024 & 2032
- Figure 13: Asia Pacific Metabolic Testing Market Revenue Share (%), by Country 2024 & 2032
- Figure 14: Asia Pacific Metabolic Testing Market Volume Share (%), by Country 2024 & 2032
- Figure 15: Middle East and Africa Metabolic Testing Market Revenue (Million), by Country 2024 & 2032
- Figure 16: Middle East and Africa Metabolic Testing Market Volume (K Unit), by Country 2024 & 2032
- Figure 17: Middle East and Africa Metabolic Testing Market Revenue Share (%), by Country 2024 & 2032
- Figure 18: Middle East and Africa Metabolic Testing Market Volume Share (%), by Country 2024 & 2032
- Figure 19: South America Metabolic Testing Market Revenue (Million), by Country 2024 & 2032
- Figure 20: South America Metabolic Testing Market Volume (K Unit), by Country 2024 & 2032
- Figure 21: South America Metabolic Testing Market Revenue Share (%), by Country 2024 & 2032
- Figure 22: South America Metabolic Testing Market Volume Share (%), by Country 2024 & 2032
- Figure 23: North America Metabolic Testing Market Revenue (Million), by Equipment Type 2024 & 2032
- Figure 24: North America Metabolic Testing Market Volume (K Unit), by Equipment Type 2024 & 2032
- Figure 25: North America Metabolic Testing Market Revenue Share (%), by Equipment Type 2024 & 2032
- Figure 26: North America Metabolic Testing Market Volume Share (%), by Equipment Type 2024 & 2032
- Figure 27: North America Metabolic Testing Market Revenue (Million), by Application 2024 & 2032
- Figure 28: North America Metabolic Testing Market Volume (K Unit), by Application 2024 & 2032
- Figure 29: North America Metabolic Testing Market Revenue Share (%), by Application 2024 & 2032
- Figure 30: North America Metabolic Testing Market Volume Share (%), by Application 2024 & 2032
- Figure 31: North America Metabolic Testing Market Revenue (Million), by End User 2024 & 2032
- Figure 32: North America Metabolic Testing Market Volume (K Unit), by End User 2024 & 2032
- Figure 33: North America Metabolic Testing Market Revenue Share (%), by End User 2024 & 2032
- Figure 34: North America Metabolic Testing Market Volume Share (%), by End User 2024 & 2032
- Figure 35: North America Metabolic Testing Market Revenue (Million), by Country 2024 & 2032
- Figure 36: North America Metabolic Testing Market Volume (K Unit), by Country 2024 & 2032
- Figure 37: North America Metabolic Testing Market Revenue Share (%), by Country 2024 & 2032
- Figure 38: North America Metabolic Testing Market Volume Share (%), by Country 2024 & 2032
- Figure 39: Europe Metabolic Testing Market Revenue (Million), by Equipment Type 2024 & 2032
- Figure 40: Europe Metabolic Testing Market Volume (K Unit), by Equipment Type 2024 & 2032
- Figure 41: Europe Metabolic Testing Market Revenue Share (%), by Equipment Type 2024 & 2032
- Figure 42: Europe Metabolic Testing Market Volume Share (%), by Equipment Type 2024 & 2032
- Figure 43: Europe Metabolic Testing Market Revenue (Million), by Application 2024 & 2032
- Figure 44: Europe Metabolic Testing Market Volume (K Unit), by Application 2024 & 2032
- Figure 45: Europe Metabolic Testing Market Revenue Share (%), by Application 2024 & 2032
- Figure 46: Europe Metabolic Testing Market Volume Share (%), by Application 2024 & 2032
- Figure 47: Europe Metabolic Testing Market Revenue (Million), by End User 2024 & 2032
- Figure 48: Europe Metabolic Testing Market Volume (K Unit), by End User 2024 & 2032
- Figure 49: Europe Metabolic Testing Market Revenue Share (%), by End User 2024 & 2032
- Figure 50: Europe Metabolic Testing Market Volume Share (%), by End User 2024 & 2032
- Figure 51: Europe Metabolic Testing Market Revenue (Million), by Country 2024 & 2032
- Figure 52: Europe Metabolic Testing Market Volume (K Unit), by Country 2024 & 2032
- Figure 53: Europe Metabolic Testing Market Revenue Share (%), by Country 2024 & 2032
- Figure 54: Europe Metabolic Testing Market Volume Share (%), by Country 2024 & 2032
- Figure 55: Asia Pacific Metabolic Testing Market Revenue (Million), by Equipment Type 2024 & 2032
- Figure 56: Asia Pacific Metabolic Testing Market Volume (K Unit), by Equipment Type 2024 & 2032
- Figure 57: Asia Pacific Metabolic Testing Market Revenue Share (%), by Equipment Type 2024 & 2032
- Figure 58: Asia Pacific Metabolic Testing Market Volume Share (%), by Equipment Type 2024 & 2032
- Figure 59: Asia Pacific Metabolic Testing Market Revenue (Million), by Application 2024 & 2032
- Figure 60: Asia Pacific Metabolic Testing Market Volume (K Unit), by Application 2024 & 2032
- Figure 61: Asia Pacific Metabolic Testing Market Revenue Share (%), by Application 2024 & 2032
- Figure 62: Asia Pacific Metabolic Testing Market Volume Share (%), by Application 2024 & 2032
- Figure 63: Asia Pacific Metabolic Testing Market Revenue (Million), by End User 2024 & 2032
- Figure 64: Asia Pacific Metabolic Testing Market Volume (K Unit), by End User 2024 & 2032
- Figure 65: Asia Pacific Metabolic Testing Market Revenue Share (%), by End User 2024 & 2032
- Figure 66: Asia Pacific Metabolic Testing Market Volume Share (%), by End User 2024 & 2032
- Figure 67: Asia Pacific Metabolic Testing Market Revenue (Million), by Country 2024 & 2032
- Figure 68: Asia Pacific Metabolic Testing Market Volume (K Unit), by Country 2024 & 2032
- Figure 69: Asia Pacific Metabolic Testing Market Revenue Share (%), by Country 2024 & 2032
- Figure 70: Asia Pacific Metabolic Testing Market Volume Share (%), by Country 2024 & 2032
- Figure 71: Middle East and Africa Metabolic Testing Market Revenue (Million), by Equipment Type 2024 & 2032
- Figure 72: Middle East and Africa Metabolic Testing Market Volume (K Unit), by Equipment Type 2024 & 2032
- Figure 73: Middle East and Africa Metabolic Testing Market Revenue Share (%), by Equipment Type 2024 & 2032
- Figure 74: Middle East and Africa Metabolic Testing Market Volume Share (%), by Equipment Type 2024 & 2032
- Figure 75: Middle East and Africa Metabolic Testing Market Revenue (Million), by Application 2024 & 2032
- Figure 76: Middle East and Africa Metabolic Testing Market Volume (K Unit), by Application 2024 & 2032
- Figure 77: Middle East and Africa Metabolic Testing Market Revenue Share (%), by Application 2024 & 2032
- Figure 78: Middle East and Africa Metabolic Testing Market Volume Share (%), by Application 2024 & 2032
- Figure 79: Middle East and Africa Metabolic Testing Market Revenue (Million), by End User 2024 & 2032
- Figure 80: Middle East and Africa Metabolic Testing Market Volume (K Unit), by End User 2024 & 2032
- Figure 81: Middle East and Africa Metabolic Testing Market Revenue Share (%), by End User 2024 & 2032
- Figure 82: Middle East and Africa Metabolic Testing Market Volume Share (%), by End User 2024 & 2032
- Figure 83: Middle East and Africa Metabolic Testing Market Revenue (Million), by Country 2024 & 2032
- Figure 84: Middle East and Africa Metabolic Testing Market Volume (K Unit), by Country 2024 & 2032
- Figure 85: Middle East and Africa Metabolic Testing Market Revenue Share (%), by Country 2024 & 2032
- Figure 86: Middle East and Africa Metabolic Testing Market Volume Share (%), by Country 2024 & 2032
- Figure 87: South America Metabolic Testing Market Revenue (Million), by Equipment Type 2024 & 2032
- Figure 88: South America Metabolic Testing Market Volume (K Unit), by Equipment Type 2024 & 2032
- Figure 89: South America Metabolic Testing Market Revenue Share (%), by Equipment Type 2024 & 2032
- Figure 90: South America Metabolic Testing Market Volume Share (%), by Equipment Type 2024 & 2032
- Figure 91: South America Metabolic Testing Market Revenue (Million), by Application 2024 & 2032
- Figure 92: South America Metabolic Testing Market Volume (K Unit), by Application 2024 & 2032
- Figure 93: South America Metabolic Testing Market Revenue Share (%), by Application 2024 & 2032
- Figure 94: South America Metabolic Testing Market Volume Share (%), by Application 2024 & 2032
- Figure 95: South America Metabolic Testing Market Revenue (Million), by End User 2024 & 2032
- Figure 96: South America Metabolic Testing Market Volume (K Unit), by End User 2024 & 2032
- Figure 97: South America Metabolic Testing Market Revenue Share (%), by End User 2024 & 2032
- Figure 98: South America Metabolic Testing Market Volume Share (%), by End User 2024 & 2032
- Figure 99: South America Metabolic Testing Market Revenue (Million), by Country 2024 & 2032
- Figure 100: South America Metabolic Testing Market Volume (K Unit), by Country 2024 & 2032
- Figure 101: South America Metabolic Testing Market Revenue Share (%), by Country 2024 & 2032
- Figure 102: South America Metabolic Testing Market Volume Share (%), by Country 2024 & 2032
List of Tables
- Table 1: Global Metabolic Testing Market Revenue Million Forecast, by Region 2019 & 2032
- Table 2: Global Metabolic Testing Market Volume K Unit Forecast, by Region 2019 & 2032
- Table 3: Global Metabolic Testing Market Revenue Million Forecast, by Equipment Type 2019 & 2032
- Table 4: Global Metabolic Testing Market Volume K Unit Forecast, by Equipment Type 2019 & 2032
- Table 5: Global Metabolic Testing Market Revenue Million Forecast, by Application 2019 & 2032
- Table 6: Global Metabolic Testing Market Volume K Unit Forecast, by Application 2019 & 2032
- Table 7: Global Metabolic Testing Market Revenue Million Forecast, by End User 2019 & 2032
- Table 8: Global Metabolic Testing Market Volume K Unit Forecast, by End User 2019 & 2032
- Table 9: Global Metabolic Testing Market Revenue Million Forecast, by Region 2019 & 2032
- Table 10: Global Metabolic Testing Market Volume K Unit Forecast, by Region 2019 & 2032
- Table 11: Global Metabolic Testing Market Revenue Million Forecast, by Country 2019 & 2032
- Table 12: Global Metabolic Testing Market Volume K Unit Forecast, by Country 2019 & 2032
- Table 13: Global Metabolic Testing Market Revenue Million Forecast, by Country 2019 & 2032
- Table 14: Global Metabolic Testing Market Volume K Unit Forecast, by Country 2019 & 2032
- Table 15: Global Metabolic Testing Market Revenue Million Forecast, by Country 2019 & 2032
- Table 16: Global Metabolic Testing Market Volume K Unit Forecast, by Country 2019 & 2032
- Table 17: Global Metabolic Testing Market Revenue Million Forecast, by Country 2019 & 2032
- Table 18: Global Metabolic Testing Market Volume K Unit Forecast, by Country 2019 & 2032
- Table 19: Global Metabolic Testing Market Revenue Million Forecast, by Country 2019 & 2032
- Table 20: Global Metabolic Testing Market Volume K Unit Forecast, by Country 2019 & 2032
- Table 21: Global Metabolic Testing Market Revenue Million Forecast, by Equipment Type 2019 & 2032
- Table 22: Global Metabolic Testing Market Volume K Unit Forecast, by Equipment Type 2019 & 2032
- Table 23: Global Metabolic Testing Market Revenue Million Forecast, by Application 2019 & 2032
- Table 24: Global Metabolic Testing Market Volume K Unit Forecast, by Application 2019 & 2032
- Table 25: Global Metabolic Testing Market Revenue Million Forecast, by End User 2019 & 2032
- Table 26: Global Metabolic Testing Market Volume K Unit Forecast, by End User 2019 & 2032
- Table 27: Global Metabolic Testing Market Revenue Million Forecast, by Country 2019 & 2032
- Table 28: Global Metabolic Testing Market Volume K Unit Forecast, by Country 2019 & 2032
- Table 29: United States Metabolic Testing Market Revenue (Million) Forecast, by Application 2019 & 2032
- Table 30: United States Metabolic Testing Market Volume (K Unit) Forecast, by Application 2019 & 2032
- Table 31: Canada Metabolic Testing Market Revenue (Million) Forecast, by Application 2019 & 2032
- Table 32: Canada Metabolic Testing Market Volume (K Unit) Forecast, by Application 2019 & 2032
- Table 33: Mexico Metabolic Testing Market Revenue (Million) Forecast, by Application 2019 & 2032
- Table 34: Mexico Metabolic Testing Market Volume (K Unit) Forecast, by Application 2019 & 2032
- Table 35: Global Metabolic Testing Market Revenue Million Forecast, by Equipment Type 2019 & 2032
- Table 36: Global Metabolic Testing Market Volume K Unit Forecast, by Equipment Type 2019 & 2032
- Table 37: Global Metabolic Testing Market Revenue Million Forecast, by Application 2019 & 2032
- Table 38: Global Metabolic Testing Market Volume K Unit Forecast, by Application 2019 & 2032
- Table 39: Global Metabolic Testing Market Revenue Million Forecast, by End User 2019 & 2032
- Table 40: Global Metabolic Testing Market Volume K Unit Forecast, by End User 2019 & 2032
- Table 41: Global Metabolic Testing Market Revenue Million Forecast, by Country 2019 & 2032
- Table 42: Global Metabolic Testing Market Volume K Unit Forecast, by Country 2019 & 2032
- Table 43: Germany Metabolic Testing Market Revenue (Million) Forecast, by Application 2019 & 2032
- Table 44: Germany Metabolic Testing Market Volume (K Unit) Forecast, by Application 2019 & 2032
- Table 45: United Kingdom Metabolic Testing Market Revenue (Million) Forecast, by Application 2019 & 2032
- Table 46: United Kingdom Metabolic Testing Market Volume (K Unit) Forecast, by Application 2019 & 2032
- Table 47: France Metabolic Testing Market Revenue (Million) Forecast, by Application 2019 & 2032
- Table 48: France Metabolic Testing Market Volume (K Unit) Forecast, by Application 2019 & 2032
- Table 49: Italy Metabolic Testing Market Revenue (Million) Forecast, by Application 2019 & 2032
- Table 50: Italy Metabolic Testing Market Volume (K Unit) Forecast, by Application 2019 & 2032
- Table 51: Spain Metabolic Testing Market Revenue (Million) Forecast, by Application 2019 & 2032
- Table 52: Spain Metabolic Testing Market Volume (K Unit) Forecast, by Application 2019 & 2032
- Table 53: Rest of Europe Metabolic Testing Market Revenue (Million) Forecast, by Application 2019 & 2032
- Table 54: Rest of Europe Metabolic Testing Market Volume (K Unit) Forecast, by Application 2019 & 2032
- Table 55: Global Metabolic Testing Market Revenue Million Forecast, by Equipment Type 2019 & 2032
- Table 56: Global Metabolic Testing Market Volume K Unit Forecast, by Equipment Type 2019 & 2032
- Table 57: Global Metabolic Testing Market Revenue Million Forecast, by Application 2019 & 2032
- Table 58: Global Metabolic Testing Market Volume K Unit Forecast, by Application 2019 & 2032
- Table 59: Global Metabolic Testing Market Revenue Million Forecast, by End User 2019 & 2032
- Table 60: Global Metabolic Testing Market Volume K Unit Forecast, by End User 2019 & 2032
- Table 61: Global Metabolic Testing Market Revenue Million Forecast, by Country 2019 & 2032
- Table 62: Global Metabolic Testing Market Volume K Unit Forecast, by Country 2019 & 2032
- Table 63: China Metabolic Testing Market Revenue (Million) Forecast, by Application 2019 & 2032
- Table 64: China Metabolic Testing Market Volume (K Unit) Forecast, by Application 2019 & 2032
- Table 65: Japan Metabolic Testing Market Revenue (Million) Forecast, by Application 2019 & 2032
- Table 66: Japan Metabolic Testing Market Volume (K Unit) Forecast, by Application 2019 & 2032
- Table 67: India Metabolic Testing Market Revenue (Million) Forecast, by Application 2019 & 2032
- Table 68: India Metabolic Testing Market Volume (K Unit) Forecast, by Application 2019 & 2032
- Table 69: Australia Metabolic Testing Market Revenue (Million) Forecast, by Application 2019 & 2032
- Table 70: Australia Metabolic Testing Market Volume (K Unit) Forecast, by Application 2019 & 2032
- Table 71: South Korea Metabolic Testing Market Revenue (Million) Forecast, by Application 2019 & 2032
- Table 72: South Korea Metabolic Testing Market Volume (K Unit) Forecast, by Application 2019 & 2032
- Table 73: Rest of Asia Pacific Metabolic Testing Market Revenue (Million) Forecast, by Application 2019 & 2032
- Table 74: Rest of Asia Pacific Metabolic Testing Market Volume (K Unit) Forecast, by Application 2019 & 2032
- Table 75: Global Metabolic Testing Market Revenue Million Forecast, by Equipment Type 2019 & 2032
- Table 76: Global Metabolic Testing Market Volume K Unit Forecast, by Equipment Type 2019 & 2032
- Table 77: Global Metabolic Testing Market Revenue Million Forecast, by Application 2019 & 2032
- Table 78: Global Metabolic Testing Market Volume K Unit Forecast, by Application 2019 & 2032
- Table 79: Global Metabolic Testing Market Revenue Million Forecast, by End User 2019 & 2032
- Table 80: Global Metabolic Testing Market Volume K Unit Forecast, by End User 2019 & 2032
- Table 81: Global Metabolic Testing Market Revenue Million Forecast, by Country 2019 & 2032
- Table 82: Global Metabolic Testing Market Volume K Unit Forecast, by Country 2019 & 2032
- Table 83: GCC Metabolic Testing Market Revenue (Million) Forecast, by Application 2019 & 2032
- Table 84: GCC Metabolic Testing Market Volume (K Unit) Forecast, by Application 2019 & 2032
- Table 85: South Africa Metabolic Testing Market Revenue (Million) Forecast, by Application 2019 & 2032
- Table 86: South Africa Metabolic Testing Market Volume (K Unit) Forecast, by Application 2019 & 2032
- Table 87: Rest of Middle East and Africa Metabolic Testing Market Revenue (Million) Forecast, by Application 2019 & 2032
- Table 88: Rest of Middle East and Africa Metabolic Testing Market Volume (K Unit) Forecast, by Application 2019 & 2032
- Table 89: Global Metabolic Testing Market Revenue Million Forecast, by Equipment Type 2019 & 2032
- Table 90: Global Metabolic Testing Market Volume K Unit Forecast, by Equipment Type 2019 & 2032
- Table 91: Global Metabolic Testing Market Revenue Million Forecast, by Application 2019 & 2032
- Table 92: Global Metabolic Testing Market Volume K Unit Forecast, by Application 2019 & 2032
- Table 93: Global Metabolic Testing Market Revenue Million Forecast, by End User 2019 & 2032
- Table 94: Global Metabolic Testing Market Volume K Unit Forecast, by End User 2019 & 2032
- Table 95: Global Metabolic Testing Market Revenue Million Forecast, by Country 2019 & 2032
- Table 96: Global Metabolic Testing Market Volume K Unit Forecast, by Country 2019 & 2032
- Table 97: Brazil Metabolic Testing Market Revenue (Million) Forecast, by Application 2019 & 2032
- Table 98: Brazil Metabolic Testing Market Volume (K Unit) Forecast, by Application 2019 & 2032
- Table 99: Argentina Metabolic Testing Market Revenue (Million) Forecast, by Application 2019 & 2032
- Table 100: Argentina Metabolic Testing Market Volume (K Unit) Forecast, by Application 2019 & 2032
- Table 101: Rest of South America Metabolic Testing Market Revenue (Million) Forecast, by Application 2019 & 2032
- Table 102: Rest of South America Metabolic Testing Market Volume (K Unit) Forecast, by Application 2019 & 2032
Frequently Asked Questions
1. What is the projected Compound Annual Growth Rate (CAGR) of the Metabolic Testing Market?
The projected CAGR is approximately 7.36%.
2. Which companies are prominent players in the Metabolic Testing Market?
Key companies in the market include Geratherm Medical AG, CORTEX Biophysik GmbH, Inbody Co Ltd, Koninklijke Philips NV, AEI Technologies Inc, COSMED srl, KORR Medical Technologies Inc, Becton Dickinson and Company (CareFusion Corporation), General Electric Company (GE Healthcare), Parvo Medics, OSI Systems Inc, MGC Diagnostics Corporation.
3. What are the main segments of the Metabolic Testing Market?
The market segments include Equipment Type, Application, End User.
4. Can you provide details about the market size?
The market size is estimated to be USD 558.74 Million as of 2022.
5. What are some drivers contributing to market growth?
Increasing Incidence of Lifestyle Diseases; Technological Advancements in Metabolic Testing.
6. What are the notable trends driving market growth?
Body Composition Analyzers are Expected to Hold a Significant Market Share in the Market Over the Forecast Period.
7. Are there any restraints impacting market growth?
High Cost of Equipment and Software; Poor Reimbursement Policies.
8. Can you provide examples of recent developments in the market?
In December 2022, Rutgers University and HeartSciences launched a multi-year collaboration to develop AI-based ECG algorithms to improve heart disease detection and expand the clinical value of an ECG for low-cost detection of heart disease.
9. What pricing options are available for accessing the report?
Pricing options include single-user, multi-user, and enterprise licenses priced at USD 4750, USD 5250, and USD 8750 respectively.
10. Is the market size provided in terms of value or volume?
The market size is provided in terms of value, measured in Million and volume, measured in K Unit.
11. Are there any specific market keywords associated with the report?
Yes, the market keyword associated with the report is "Metabolic Testing Market," which aids in identifying and referencing the specific market segment covered.
12. How do I determine which pricing option suits my needs best?
The pricing options vary based on user requirements and access needs. Individual users may opt for single-user licenses, while businesses requiring broader access may choose multi-user or enterprise licenses for cost-effective access to the report.
13. Are there any additional resources or data provided in the Metabolic Testing Market report?
While the report offers comprehensive insights, it's advisable to review the specific contents or supplementary materials provided to ascertain if additional resources or data are available.
14. How can I stay updated on further developments or reports in the Metabolic Testing Market?
To stay informed about further developments, trends, and reports in the Metabolic Testing Market, consider subscribing to industry newsletters, following relevant companies and organizations, or regularly checking reputable industry news sources and publications.
Methodology
Step 1 - Identification of Relevant Samples Size from Population Database


Step 2 - Approaches for Defining Global Market Size (Value, Volume* & Price*)

Note*: In applicable scenarios
Step 3 - Data Sources
Primary Research
- Web Analytics
- Survey Reports
- Research Institute
- Latest Research Reports
- Opinion Leaders
Secondary Research
- Annual Reports
- White Paper
- Latest Press Release
- Industry Association
- Paid Database
- Investor Presentations

Step 4 - Data Triangulation
Involves using different sources of information in order to increase the validity of a study
These sources are likely to be stakeholders in a program - participants, other researchers, program staff, other community members, and so on.
Then we put all data in single framework & apply various statistical tools to find out the dynamic on the market.
During the analysis stage, feedback from the stakeholder groups would be compared to determine areas of agreement as well as areas of divergence


