
Key Insights
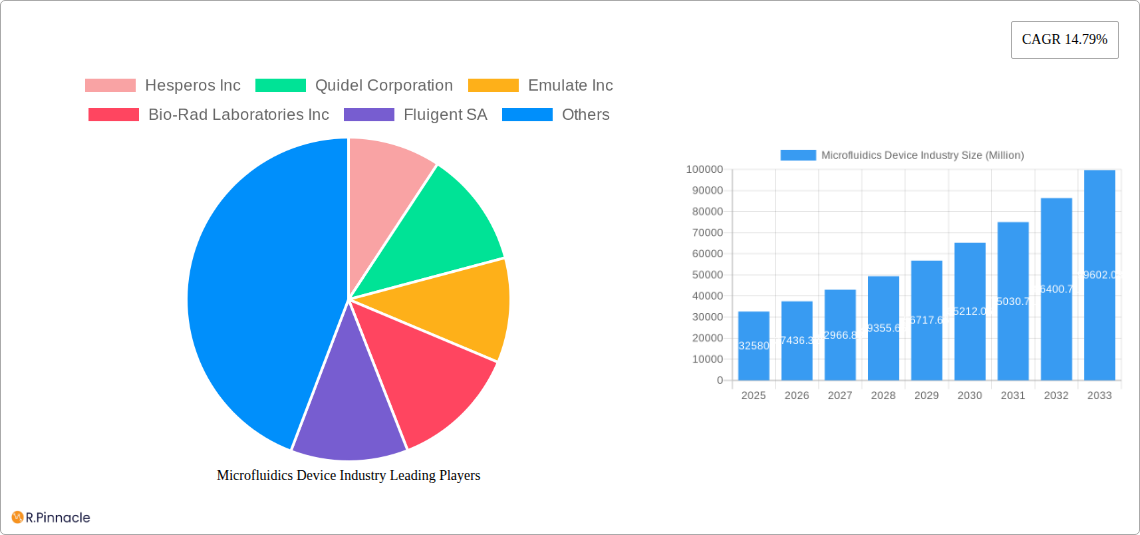
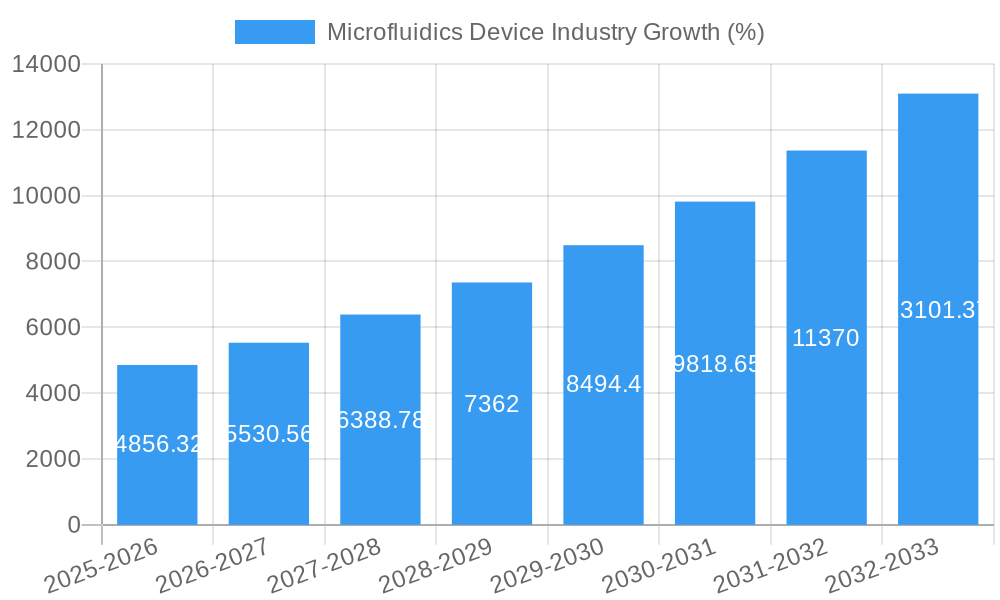
The global microfluidics device market is experiencing robust growth, projected to reach a substantial size, driven by the increasing demand for advanced diagnostic tools and miniaturized drug delivery systems. The market's Compound Annual Growth Rate (CAGR) of 14.79% from 2019 to 2024 indicates a significant upward trajectory. This expansion is fueled by several key factors. The rising prevalence of chronic diseases necessitates rapid and accurate diagnostic capabilities, leading to increased adoption of point-of-care diagnostics utilizing microfluidic technology. Furthermore, the pharmaceutical and biotechnology sectors are leveraging microfluidics for drug discovery, development, and high-throughput screening, contributing to market growth. Advancements in microfabrication techniques and the development of novel materials are further enhancing the capabilities and applications of these devices. The market segmentation reveals a strong preference for microfluidic-based devices and a significant contribution from applications in drug delivery and point-of-care diagnostics. Polymer-based materials dominate the material segment, owing to their cost-effectiveness and versatility. Geographical distribution shows a strong presence in North America and Europe, driven by established healthcare infrastructure and robust research activities, while the Asia-Pacific region is witnessing rapid growth due to increasing investment in healthcare and burgeoning biotechnology sectors. Competitive landscape analysis indicates that major players are focusing on strategic collaborations, acquisitions, and product innovations to maintain their market share and expand their reach.
Looking ahead to 2033, the continued technological advancements, coupled with increasing government funding for healthcare research and development, are expected to propel the microfluidics device market to even greater heights. The growing emphasis on personalized medicine and the development of lab-on-a-chip technologies are expected to create lucrative opportunities for market players. However, factors such as high initial investment costs associated with the development and manufacturing of sophisticated microfluidic devices and regulatory hurdles related to the approval and commercialization of new diagnostic tools might pose challenges to market growth. Nevertheless, the long-term outlook for the microfluidics device market remains exceptionally promising, driven by the continuous innovation and expanding applications across various sectors.
Microfluidics Device Industry Market Report: 2019-2033
This comprehensive report provides a detailed analysis of the global Microfluidics Device industry, offering invaluable insights for industry professionals, investors, and researchers. With a focus on market size, growth projections, competitive landscape, and emerging trends, this report covers the period 2019-2033, with 2025 as the base year and a forecast period of 2025-2033. The global market value is projected to reach xx Million by 2033.
Microfluidics Device Industry Market Structure & Innovation Trends
The microfluidics device market is characterized by a moderately concentrated structure with several key players holding significant market share. Companies like Agilent Technologies Inc, Bio-Rad Laboratories Inc, and Illumina Inc are among the dominant forces, although many smaller, specialized firms also contribute significantly. The market share of the top five companies is estimated at xx%, indicative of a competitive yet not overly consolidated landscape. Innovation is driven by advancements in materials science (e.g., polymers, silicones), miniaturization technologies, and integration with advanced detection systems. Stringent regulatory frameworks, particularly in healthcare applications, influence product development and market entry. Substitutes exist in some applications, such as traditional laboratory techniques, but microfluidics' advantages in terms of efficiency, cost-effectiveness, and portability are driving market growth. End-user demographics are diverse, including pharmaceutical and biotechnology companies, research institutions, diagnostic labs, and point-of-care settings. M&A activity has been moderate in recent years, with deal values averaging xx Million per transaction. Notable examples include [Insert specific M&A examples if available, otherwise state "Specific examples are not publicly available"].
- Market Concentration: Top 5 companies hold xx% market share.
- Innovation Drivers: Advancements in materials, miniaturization, and detection systems.
- Regulatory Framework: Stringent regulations, particularly in healthcare.
- M&A Activity: Moderate activity, with average deal values of xx Million.
Microfluidics Device Industry Market Dynamics & Trends
The microfluidics device market is experiencing robust growth, driven by several key factors. The increasing demand for point-of-care diagnostics, personalized medicine, and high-throughput screening in pharmaceutical and biotechnology research is fueling market expansion. Technological advancements, such as the development of advanced microfluidic chips with improved functionality and integration with other analytical tools, are further propelling growth. Consumer preference is shifting towards more efficient, cost-effective, and portable diagnostic and research tools, which significantly benefits the adoption of microfluidics. The competitive landscape is dynamic, with both established players and new entrants constantly striving for market share. This fosters innovation and competition, further stimulating market expansion. The Compound Annual Growth Rate (CAGR) during the forecast period (2025-2033) is projected to be xx%, with market penetration steadily increasing across various applications.
Dominant Regions & Segments in Microfluidics Device Industry
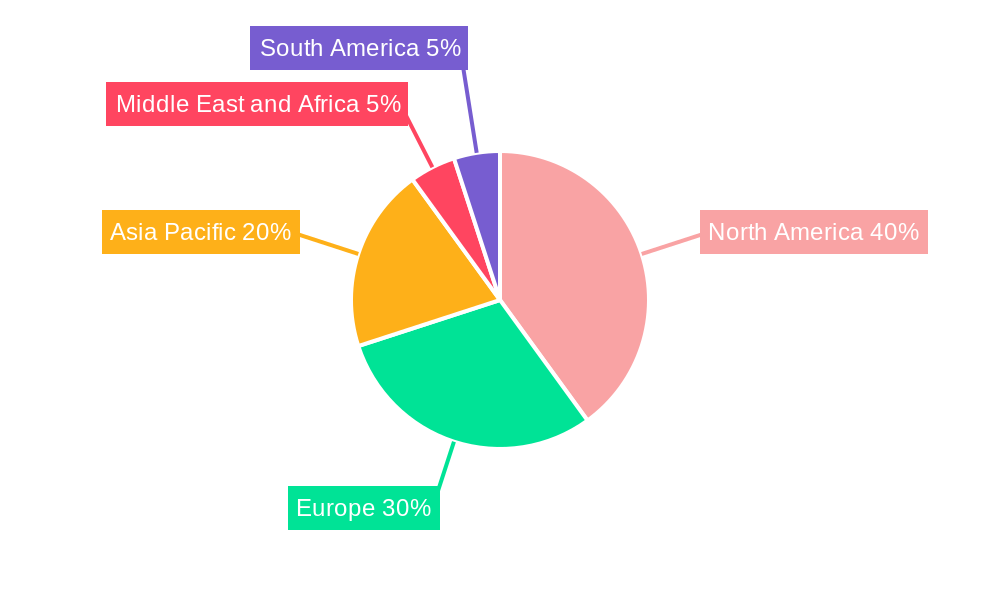
North America currently holds the largest market share in the microfluidics device industry, driven by strong research infrastructure, a significant presence of major players, and high healthcare expenditure. Europe is the second largest market, while Asia Pacific is expected to witness significant growth during the forecast period.
By Product Type: Microfluidic-based devices dominate the market, owing to their versatility and wide range of applications. The Microfluidic Components segment is also growing, fueled by demand for customized and specialized components.
By Application: Pharmaceutical and Biotechnology research and Point-of-care diagnostics represent the largest application segments. Drug delivery is experiencing rapid growth, driven by the increasing demand for targeted therapies.
By Material: Polymers are the most widely used material due to their flexibility, cost-effectiveness, and biocompatibility. Silicone and glass are also prevalent, catering to specific application requirements.
Key Drivers (Regional): Strong research infrastructure, high healthcare expenditure, supportive government policies, and a robust biotech ecosystem contribute significantly to the dominance of North America and Europe. The Asia Pacific region’s rapid growth is driven by increasing healthcare investment, expanding research activities, and government initiatives.
Microfluidics Device Industry Product Innovations
Recent innovations include the development of more sophisticated microfluidic chips incorporating advanced functionalities such as integrated sensors, actuators, and wireless communication capabilities. This trend is allowing for the development of portable and connected devices for diagnostics, drug delivery, and point-of-care testing. The market is also seeing increased adoption of novel materials with enhanced biocompatibility and durability. These developments are improving the performance, reliability, and usability of microfluidic devices, enhancing their market appeal and creating new applications across diverse sectors.
Report Scope & Segmentation Analysis
This report offers a detailed analysis of the global Microfluidics Device market, segmented by product type (Microfluidic-based Devices, Microfluidic Components), application (Drug Delivery, Point-of-care Diagnostics, Pharmaceutical and Biotechnology Research, Clinical Diagnostics, Other Applications), and material (Polymer, Silicone, Glass, Other Materials). Each segment is thoroughly analyzed, with growth projections, market size estimations, and competitive dynamics evaluated. The report covers the historical period (2019-2024), base year (2025), and forecast period (2025-2033).
Key Drivers of Microfluidics Device Industry Growth
The microfluidics device industry's growth is propelled by several key factors: The increasing demand for point-of-care diagnostics, facilitating rapid and accessible testing; advancements in microfabrication technologies, enabling the creation of increasingly sophisticated devices; rising investments in pharmaceutical and biotechnology research, driving the need for high-throughput screening and drug discovery tools; and supportive government regulations and funding for research and development in the healthcare sector.
Challenges in the Microfluidics Device Industry Sector
Challenges include the high initial investment costs associated with manufacturing and developing sophisticated microfluidic devices, which can hinder market entry for smaller companies. Complex regulatory pathways and stringent approval processes, particularly in medical applications, present significant hurdles. Supply chain disruptions and the availability of specialized materials can also affect production and profitability. Furthermore, competition from established players and the emergence of alternative technologies requires companies to continuously innovate and adapt to maintain market share. These challenges are estimated to negatively impact market growth by approximately xx% annually.
Emerging Opportunities in Microfluidics Device Industry
Significant opportunities lie in the expansion into new and emerging markets such as personalized medicine, environmental monitoring, and industrial process control. The integration of artificial intelligence and machine learning offers the potential for improved device performance, automation, and data analysis. The development of novel biocompatible materials and advanced microfabrication techniques are further contributing to the widening applications of microfluidics. The increasing demand for portable and user-friendly diagnostic tools also presents significant growth prospects.
Leading Players in the Microfluidics Device Industry Market
- Hesperos Inc
- Quidel Corporation
- Emulate Inc
- Bio-Rad Laboratories Inc
- Fluigent SA
- ZEON CORPORATION
- Dolomite Microfluidics (Blacktrace Holdings Ltd)
- Micronit Microfluidics
- Biosurfit SA
- Bartels-Mikrotechnik
- Sphere Fluidics Limited
- Agilent Technologies Inc
- UFluidix
- PerkinElmer Inc
- Illumina Inc
- FluIdigm Corporation
- Nanomix Inc
Key Developments in Microfluidics Device Industry Industry
- November 2023: IDEX MPT's Microfluidics launched a new processor for production-scale cell disruption, impacting vaccine and gene therapy manufacturing.
- January 2023: SCIEX launched the Intabio ZT system, a fully-integrated microfluidic chip-based platform for protein analysis, advancing point-of-care diagnostics capabilities.
Future Outlook for Microfluidics Device Industry Market
The future outlook for the microfluidics device market is very positive. Continued technological advancements, coupled with the rising demand for personalized medicine, point-of-care diagnostics, and high-throughput screening, will drive substantial growth. The increasing adoption of microfluidics in diverse sectors beyond healthcare, such as environmental monitoring and industrial process control, will further expand market opportunities. Strategic partnerships, collaborations, and investments in research and development will play a vital role in shaping the future of this dynamic and innovative industry.
Microfluidics Device Industry Segmentation
-
1. Product Type
- 1.1. Microfluidic-based Devices
-
1.2. Microfluidic Components
- 1.2.1. Microfluidic Chips
- 1.2.2. Micro Pumps
- 1.2.3. Microneedles
- 1.2.4. Other Product Types
-
2. Application
- 2.1. Drug Delivery
- 2.2. Point-of-care Diagnostics
- 2.3. Pharmaceutical and Biotechnology Research
-
3. Material
- 3.1. Polymer
- 3.2. Silicone
- 3.3. Glass
Microfluidics Device Industry Segmentation By Geography
-
1. North America
- 1.1. United States
- 1.2. Canada
- 1.3. Mexico
-
2. Europe
- 2.1. France
- 2.2. United Kingdom
- 2.3. Germany
- 2.4. Italy
- 2.5. Spain
- 2.6. Rest of Europe
-
3. Asia Pacific
- 3.1. China
- 3.2. Japan
- 3.3. India
- 3.4. Australia
- 3.5. South Korea
- 3.6. Rest of Asia Pacific
-
4. Middle East and Africa
- 4.1. GCC
- 4.2. South Africa
- 4.3. Rest of Middle East and Africa
-
5. South America
- 5.1. Brazil
- 5.2. Argentina
- 5.3. Rest of South America
Microfluidics Device Industry REPORT HIGHLIGHTS
| Aspects | Details |
|---|---|
| Study Period | 2019-2033 |
| Base Year | 2024 |
| Estimated Year | 2025 |
| Forecast Period | 2025-2033 |
| Historical Period | 2019-2024 |
| Growth Rate | CAGR of 14.79% from 2019-2033 |
| Segmentation |
|
Table of Contents
- 1. Introduction
- 1.1. Research Scope
- 1.2. Market Segmentation
- 1.3. Research Methodology
- 1.4. Definitions and Assumptions
- 2. Executive Summary
- 2.1. Introduction
- 3. Market Dynamics
- 3.1. Introduction
- 3.2. Market Drivers
- 3.2.1. Increasing Demand for Point-of-care Testing; Increasing Incidences of Various Diseases; Faster Turn-around Time for Analysis and Improved Portability of Devices
- 3.3. Market Restrains
- 3.3.1. Integration of Microfluidics Technology with Existing Workflows; Low Adoption in Developing Countries Due to High Prices
- 3.4. Market Trends
- 3.4.1. The Point-of-Care Diagnostics Segment is Expected to Witness Considerable Growth During the Forecast Period
- 4. Market Factor Analysis
- 4.1. Porters Five Forces
- 4.2. Supply/Value Chain
- 4.3. PESTEL analysis
- 4.4. Market Entropy
- 4.5. Patent/Trademark Analysis
- 5. Global Microfluidics Device Industry Analysis, Insights and Forecast, 2019-2031
- 5.1. Market Analysis, Insights and Forecast - by Product Type
- 5.1.1. Microfluidic-based Devices
- 5.1.2. Microfluidic Components
- 5.1.2.1. Microfluidic Chips
- 5.1.2.2. Micro Pumps
- 5.1.2.3. Microneedles
- 5.1.2.4. Other Product Types
- 5.2. Market Analysis, Insights and Forecast - by Application
- 5.2.1. Drug Delivery
- 5.2.2. Point-of-care Diagnostics
- 5.2.3. Pharmaceutical and Biotechnology Research
- 5.3. Market Analysis, Insights and Forecast - by Material
- 5.3.1. Polymer
- 5.3.2. Silicone
- 5.3.3. Glass
- 5.4. Market Analysis, Insights and Forecast - by Region
- 5.4.1. North America
- 5.4.2. Europe
- 5.4.3. Asia Pacific
- 5.4.4. Middle East and Africa
- 5.4.5. South America
- 5.1. Market Analysis, Insights and Forecast - by Product Type
- 6. North America Microfluidics Device Industry Analysis, Insights and Forecast, 2019-2031
- 6.1. Market Analysis, Insights and Forecast - by Product Type
- 6.1.1. Microfluidic-based Devices
- 6.1.2. Microfluidic Components
- 6.1.2.1. Microfluidic Chips
- 6.1.2.2. Micro Pumps
- 6.1.2.3. Microneedles
- 6.1.2.4. Other Product Types
- 6.2. Market Analysis, Insights and Forecast - by Application
- 6.2.1. Drug Delivery
- 6.2.2. Point-of-care Diagnostics
- 6.2.3. Pharmaceutical and Biotechnology Research
- 6.3. Market Analysis, Insights and Forecast - by Material
- 6.3.1. Polymer
- 6.3.2. Silicone
- 6.3.3. Glass
- 6.1. Market Analysis, Insights and Forecast - by Product Type
- 7. Europe Microfluidics Device Industry Analysis, Insights and Forecast, 2019-2031
- 7.1. Market Analysis, Insights and Forecast - by Product Type
- 7.1.1. Microfluidic-based Devices
- 7.1.2. Microfluidic Components
- 7.1.2.1. Microfluidic Chips
- 7.1.2.2. Micro Pumps
- 7.1.2.3. Microneedles
- 7.1.2.4. Other Product Types
- 7.2. Market Analysis, Insights and Forecast - by Application
- 7.2.1. Drug Delivery
- 7.2.2. Point-of-care Diagnostics
- 7.2.3. Pharmaceutical and Biotechnology Research
- 7.3. Market Analysis, Insights and Forecast - by Material
- 7.3.1. Polymer
- 7.3.2. Silicone
- 7.3.3. Glass
- 7.1. Market Analysis, Insights and Forecast - by Product Type
- 8. Asia Pacific Microfluidics Device Industry Analysis, Insights and Forecast, 2019-2031
- 8.1. Market Analysis, Insights and Forecast - by Product Type
- 8.1.1. Microfluidic-based Devices
- 8.1.2. Microfluidic Components
- 8.1.2.1. Microfluidic Chips
- 8.1.2.2. Micro Pumps
- 8.1.2.3. Microneedles
- 8.1.2.4. Other Product Types
- 8.2. Market Analysis, Insights and Forecast - by Application
- 8.2.1. Drug Delivery
- 8.2.2. Point-of-care Diagnostics
- 8.2.3. Pharmaceutical and Biotechnology Research
- 8.3. Market Analysis, Insights and Forecast - by Material
- 8.3.1. Polymer
- 8.3.2. Silicone
- 8.3.3. Glass
- 8.1. Market Analysis, Insights and Forecast - by Product Type
- 9. Middle East and Africa Microfluidics Device Industry Analysis, Insights and Forecast, 2019-2031
- 9.1. Market Analysis, Insights and Forecast - by Product Type
- 9.1.1. Microfluidic-based Devices
- 9.1.2. Microfluidic Components
- 9.1.2.1. Microfluidic Chips
- 9.1.2.2. Micro Pumps
- 9.1.2.3. Microneedles
- 9.1.2.4. Other Product Types
- 9.2. Market Analysis, Insights and Forecast - by Application
- 9.2.1. Drug Delivery
- 9.2.2. Point-of-care Diagnostics
- 9.2.3. Pharmaceutical and Biotechnology Research
- 9.3. Market Analysis, Insights and Forecast - by Material
- 9.3.1. Polymer
- 9.3.2. Silicone
- 9.3.3. Glass
- 9.1. Market Analysis, Insights and Forecast - by Product Type
- 10. South America Microfluidics Device Industry Analysis, Insights and Forecast, 2019-2031
- 10.1. Market Analysis, Insights and Forecast - by Product Type
- 10.1.1. Microfluidic-based Devices
- 10.1.2. Microfluidic Components
- 10.1.2.1. Microfluidic Chips
- 10.1.2.2. Micro Pumps
- 10.1.2.3. Microneedles
- 10.1.2.4. Other Product Types
- 10.2. Market Analysis, Insights and Forecast - by Application
- 10.2.1. Drug Delivery
- 10.2.2. Point-of-care Diagnostics
- 10.2.3. Pharmaceutical and Biotechnology Research
- 10.3. Market Analysis, Insights and Forecast - by Material
- 10.3.1. Polymer
- 10.3.2. Silicone
- 10.3.3. Glass
- 10.1. Market Analysis, Insights and Forecast - by Product Type
- 11. North America Microfluidics Device Industry Analysis, Insights and Forecast, 2019-2031
- 11.1. Market Analysis, Insights and Forecast - By Country/Sub-region
- 11.1.1 United States
- 11.1.2 Canada
- 11.1.3 Mexico
- 12. Europe Microfluidics Device Industry Analysis, Insights and Forecast, 2019-2031
- 12.1. Market Analysis, Insights and Forecast - By Country/Sub-region
- 12.1.1 France
- 12.1.2 United Kingdom
- 12.1.3 Germany
- 12.1.4 Italy
- 12.1.5 Spain
- 12.1.6 Rest of Europe
- 13. Asia Pacific Microfluidics Device Industry Analysis, Insights and Forecast, 2019-2031
- 13.1. Market Analysis, Insights and Forecast - By Country/Sub-region
- 13.1.1 China
- 13.1.2 Japan
- 13.1.3 India
- 13.1.4 Australia
- 13.1.5 South Korea
- 13.1.6 Rest of Asia Pacific
- 14. Middle East and Africa Microfluidics Device Industry Analysis, Insights and Forecast, 2019-2031
- 14.1. Market Analysis, Insights and Forecast - By Country/Sub-region
- 14.1.1 GCC
- 14.1.2 South Africa
- 14.1.3 Rest of Middle East and Africa
- 15. South America Microfluidics Device Industry Analysis, Insights and Forecast, 2019-2031
- 15.1. Market Analysis, Insights and Forecast - By Country/Sub-region
- 15.1.1 Brazil
- 15.1.2 Argentina
- 15.1.3 Rest of South America
- 16. Competitive Analysis
- 16.1. Global Market Share Analysis 2024
- 16.2. Company Profiles
- 16.2.1 Hesperos Inc
- 16.2.1.1. Overview
- 16.2.1.2. Products
- 16.2.1.3. SWOT Analysis
- 16.2.1.4. Recent Developments
- 16.2.1.5. Financials (Based on Availability)
- 16.2.2 Quidel Corporation
- 16.2.2.1. Overview
- 16.2.2.2. Products
- 16.2.2.3. SWOT Analysis
- 16.2.2.4. Recent Developments
- 16.2.2.5. Financials (Based on Availability)
- 16.2.3 Emulate Inc
- 16.2.3.1. Overview
- 16.2.3.2. Products
- 16.2.3.3. SWOT Analysis
- 16.2.3.4. Recent Developments
- 16.2.3.5. Financials (Based on Availability)
- 16.2.4 Bio-Rad Laboratories Inc
- 16.2.4.1. Overview
- 16.2.4.2. Products
- 16.2.4.3. SWOT Analysis
- 16.2.4.4. Recent Developments
- 16.2.4.5. Financials (Based on Availability)
- 16.2.5 Fluigent SA
- 16.2.5.1. Overview
- 16.2.5.2. Products
- 16.2.5.3. SWOT Analysis
- 16.2.5.4. Recent Developments
- 16.2.5.5. Financials (Based on Availability)
- 16.2.6 ZEON CORPORATION
- 16.2.6.1. Overview
- 16.2.6.2. Products
- 16.2.6.3. SWOT Analysis
- 16.2.6.4. Recent Developments
- 16.2.6.5. Financials (Based on Availability)
- 16.2.7 Dolomite Microfluidics (Blacktrace Holdings Ltd)
- 16.2.7.1. Overview
- 16.2.7.2. Products
- 16.2.7.3. SWOT Analysis
- 16.2.7.4. Recent Developments
- 16.2.7.5. Financials (Based on Availability)
- 16.2.8 Micronit Microfluidics
- 16.2.8.1. Overview
- 16.2.8.2. Products
- 16.2.8.3. SWOT Analysis
- 16.2.8.4. Recent Developments
- 16.2.8.5. Financials (Based on Availability)
- 16.2.9 Biosurfit SA
- 16.2.9.1. Overview
- 16.2.9.2. Products
- 16.2.9.3. SWOT Analysis
- 16.2.9.4. Recent Developments
- 16.2.9.5. Financials (Based on Availability)
- 16.2.10 Bartels-Mikrotechnik
- 16.2.10.1. Overview
- 16.2.10.2. Products
- 16.2.10.3. SWOT Analysis
- 16.2.10.4. Recent Developments
- 16.2.10.5. Financials (Based on Availability)
- 16.2.11 Sphere Fluidics Limited
- 16.2.11.1. Overview
- 16.2.11.2. Products
- 16.2.11.3. SWOT Analysis
- 16.2.11.4. Recent Developments
- 16.2.11.5. Financials (Based on Availability)
- 16.2.12 Agilent Technologies Inc
- 16.2.12.1. Overview
- 16.2.12.2. Products
- 16.2.12.3. SWOT Analysis
- 16.2.12.4. Recent Developments
- 16.2.12.5. Financials (Based on Availability)
- 16.2.13 UFluidix
- 16.2.13.1. Overview
- 16.2.13.2. Products
- 16.2.13.3. SWOT Analysis
- 16.2.13.4. Recent Developments
- 16.2.13.5. Financials (Based on Availability)
- 16.2.14 PerkinElmer Inc
- 16.2.14.1. Overview
- 16.2.14.2. Products
- 16.2.14.3. SWOT Analysis
- 16.2.14.4. Recent Developments
- 16.2.14.5. Financials (Based on Availability)
- 16.2.15 Illumina Inc
- 16.2.15.1. Overview
- 16.2.15.2. Products
- 16.2.15.3. SWOT Analysis
- 16.2.15.4. Recent Developments
- 16.2.15.5. Financials (Based on Availability)
- 16.2.16 FluIdigm Corporation
- 16.2.16.1. Overview
- 16.2.16.2. Products
- 16.2.16.3. SWOT Analysis
- 16.2.16.4. Recent Developments
- 16.2.16.5. Financials (Based on Availability)
- 16.2.17 Nanomix Inc
- 16.2.17.1. Overview
- 16.2.17.2. Products
- 16.2.17.3. SWOT Analysis
- 16.2.17.4. Recent Developments
- 16.2.17.5. Financials (Based on Availability)
- 16.2.1 Hesperos Inc
List of Figures
- Figure 1: Global Microfluidics Device Industry Revenue Breakdown (Million, %) by Region 2024 & 2032
- Figure 2: Global Microfluidics Device Industry Volume Breakdown (K Unit, %) by Region 2024 & 2032
- Figure 3: North America Microfluidics Device Industry Revenue (Million), by Country 2024 & 2032
- Figure 4: North America Microfluidics Device Industry Volume (K Unit), by Country 2024 & 2032
- Figure 5: North America Microfluidics Device Industry Revenue Share (%), by Country 2024 & 2032
- Figure 6: North America Microfluidics Device Industry Volume Share (%), by Country 2024 & 2032
- Figure 7: Europe Microfluidics Device Industry Revenue (Million), by Country 2024 & 2032
- Figure 8: Europe Microfluidics Device Industry Volume (K Unit), by Country 2024 & 2032
- Figure 9: Europe Microfluidics Device Industry Revenue Share (%), by Country 2024 & 2032
- Figure 10: Europe Microfluidics Device Industry Volume Share (%), by Country 2024 & 2032
- Figure 11: Asia Pacific Microfluidics Device Industry Revenue (Million), by Country 2024 & 2032
- Figure 12: Asia Pacific Microfluidics Device Industry Volume (K Unit), by Country 2024 & 2032
- Figure 13: Asia Pacific Microfluidics Device Industry Revenue Share (%), by Country 2024 & 2032
- Figure 14: Asia Pacific Microfluidics Device Industry Volume Share (%), by Country 2024 & 2032
- Figure 15: Middle East and Africa Microfluidics Device Industry Revenue (Million), by Country 2024 & 2032
- Figure 16: Middle East and Africa Microfluidics Device Industry Volume (K Unit), by Country 2024 & 2032
- Figure 17: Middle East and Africa Microfluidics Device Industry Revenue Share (%), by Country 2024 & 2032
- Figure 18: Middle East and Africa Microfluidics Device Industry Volume Share (%), by Country 2024 & 2032
- Figure 19: South America Microfluidics Device Industry Revenue (Million), by Country 2024 & 2032
- Figure 20: South America Microfluidics Device Industry Volume (K Unit), by Country 2024 & 2032
- Figure 21: South America Microfluidics Device Industry Revenue Share (%), by Country 2024 & 2032
- Figure 22: South America Microfluidics Device Industry Volume Share (%), by Country 2024 & 2032
- Figure 23: North America Microfluidics Device Industry Revenue (Million), by Product Type 2024 & 2032
- Figure 24: North America Microfluidics Device Industry Volume (K Unit), by Product Type 2024 & 2032
- Figure 25: North America Microfluidics Device Industry Revenue Share (%), by Product Type 2024 & 2032
- Figure 26: North America Microfluidics Device Industry Volume Share (%), by Product Type 2024 & 2032
- Figure 27: North America Microfluidics Device Industry Revenue (Million), by Application 2024 & 2032
- Figure 28: North America Microfluidics Device Industry Volume (K Unit), by Application 2024 & 2032
- Figure 29: North America Microfluidics Device Industry Revenue Share (%), by Application 2024 & 2032
- Figure 30: North America Microfluidics Device Industry Volume Share (%), by Application 2024 & 2032
- Figure 31: North America Microfluidics Device Industry Revenue (Million), by Material 2024 & 2032
- Figure 32: North America Microfluidics Device Industry Volume (K Unit), by Material 2024 & 2032
- Figure 33: North America Microfluidics Device Industry Revenue Share (%), by Material 2024 & 2032
- Figure 34: North America Microfluidics Device Industry Volume Share (%), by Material 2024 & 2032
- Figure 35: North America Microfluidics Device Industry Revenue (Million), by Country 2024 & 2032
- Figure 36: North America Microfluidics Device Industry Volume (K Unit), by Country 2024 & 2032
- Figure 37: North America Microfluidics Device Industry Revenue Share (%), by Country 2024 & 2032
- Figure 38: North America Microfluidics Device Industry Volume Share (%), by Country 2024 & 2032
- Figure 39: Europe Microfluidics Device Industry Revenue (Million), by Product Type 2024 & 2032
- Figure 40: Europe Microfluidics Device Industry Volume (K Unit), by Product Type 2024 & 2032
- Figure 41: Europe Microfluidics Device Industry Revenue Share (%), by Product Type 2024 & 2032
- Figure 42: Europe Microfluidics Device Industry Volume Share (%), by Product Type 2024 & 2032
- Figure 43: Europe Microfluidics Device Industry Revenue (Million), by Application 2024 & 2032
- Figure 44: Europe Microfluidics Device Industry Volume (K Unit), by Application 2024 & 2032
- Figure 45: Europe Microfluidics Device Industry Revenue Share (%), by Application 2024 & 2032
- Figure 46: Europe Microfluidics Device Industry Volume Share (%), by Application 2024 & 2032
- Figure 47: Europe Microfluidics Device Industry Revenue (Million), by Material 2024 & 2032
- Figure 48: Europe Microfluidics Device Industry Volume (K Unit), by Material 2024 & 2032
- Figure 49: Europe Microfluidics Device Industry Revenue Share (%), by Material 2024 & 2032
- Figure 50: Europe Microfluidics Device Industry Volume Share (%), by Material 2024 & 2032
- Figure 51: Europe Microfluidics Device Industry Revenue (Million), by Country 2024 & 2032
- Figure 52: Europe Microfluidics Device Industry Volume (K Unit), by Country 2024 & 2032
- Figure 53: Europe Microfluidics Device Industry Revenue Share (%), by Country 2024 & 2032
- Figure 54: Europe Microfluidics Device Industry Volume Share (%), by Country 2024 & 2032
- Figure 55: Asia Pacific Microfluidics Device Industry Revenue (Million), by Product Type 2024 & 2032
- Figure 56: Asia Pacific Microfluidics Device Industry Volume (K Unit), by Product Type 2024 & 2032
- Figure 57: Asia Pacific Microfluidics Device Industry Revenue Share (%), by Product Type 2024 & 2032
- Figure 58: Asia Pacific Microfluidics Device Industry Volume Share (%), by Product Type 2024 & 2032
- Figure 59: Asia Pacific Microfluidics Device Industry Revenue (Million), by Application 2024 & 2032
- Figure 60: Asia Pacific Microfluidics Device Industry Volume (K Unit), by Application 2024 & 2032
- Figure 61: Asia Pacific Microfluidics Device Industry Revenue Share (%), by Application 2024 & 2032
- Figure 62: Asia Pacific Microfluidics Device Industry Volume Share (%), by Application 2024 & 2032
- Figure 63: Asia Pacific Microfluidics Device Industry Revenue (Million), by Material 2024 & 2032
- Figure 64: Asia Pacific Microfluidics Device Industry Volume (K Unit), by Material 2024 & 2032
- Figure 65: Asia Pacific Microfluidics Device Industry Revenue Share (%), by Material 2024 & 2032
- Figure 66: Asia Pacific Microfluidics Device Industry Volume Share (%), by Material 2024 & 2032
- Figure 67: Asia Pacific Microfluidics Device Industry Revenue (Million), by Country 2024 & 2032
- Figure 68: Asia Pacific Microfluidics Device Industry Volume (K Unit), by Country 2024 & 2032
- Figure 69: Asia Pacific Microfluidics Device Industry Revenue Share (%), by Country 2024 & 2032
- Figure 70: Asia Pacific Microfluidics Device Industry Volume Share (%), by Country 2024 & 2032
- Figure 71: Middle East and Africa Microfluidics Device Industry Revenue (Million), by Product Type 2024 & 2032
- Figure 72: Middle East and Africa Microfluidics Device Industry Volume (K Unit), by Product Type 2024 & 2032
- Figure 73: Middle East and Africa Microfluidics Device Industry Revenue Share (%), by Product Type 2024 & 2032
- Figure 74: Middle East and Africa Microfluidics Device Industry Volume Share (%), by Product Type 2024 & 2032
- Figure 75: Middle East and Africa Microfluidics Device Industry Revenue (Million), by Application 2024 & 2032
- Figure 76: Middle East and Africa Microfluidics Device Industry Volume (K Unit), by Application 2024 & 2032
- Figure 77: Middle East and Africa Microfluidics Device Industry Revenue Share (%), by Application 2024 & 2032
- Figure 78: Middle East and Africa Microfluidics Device Industry Volume Share (%), by Application 2024 & 2032
- Figure 79: Middle East and Africa Microfluidics Device Industry Revenue (Million), by Material 2024 & 2032
- Figure 80: Middle East and Africa Microfluidics Device Industry Volume (K Unit), by Material 2024 & 2032
- Figure 81: Middle East and Africa Microfluidics Device Industry Revenue Share (%), by Material 2024 & 2032
- Figure 82: Middle East and Africa Microfluidics Device Industry Volume Share (%), by Material 2024 & 2032
- Figure 83: Middle East and Africa Microfluidics Device Industry Revenue (Million), by Country 2024 & 2032
- Figure 84: Middle East and Africa Microfluidics Device Industry Volume (K Unit), by Country 2024 & 2032
- Figure 85: Middle East and Africa Microfluidics Device Industry Revenue Share (%), by Country 2024 & 2032
- Figure 86: Middle East and Africa Microfluidics Device Industry Volume Share (%), by Country 2024 & 2032
- Figure 87: South America Microfluidics Device Industry Revenue (Million), by Product Type 2024 & 2032
- Figure 88: South America Microfluidics Device Industry Volume (K Unit), by Product Type 2024 & 2032
- Figure 89: South America Microfluidics Device Industry Revenue Share (%), by Product Type 2024 & 2032
- Figure 90: South America Microfluidics Device Industry Volume Share (%), by Product Type 2024 & 2032
- Figure 91: South America Microfluidics Device Industry Revenue (Million), by Application 2024 & 2032
- Figure 92: South America Microfluidics Device Industry Volume (K Unit), by Application 2024 & 2032
- Figure 93: South America Microfluidics Device Industry Revenue Share (%), by Application 2024 & 2032
- Figure 94: South America Microfluidics Device Industry Volume Share (%), by Application 2024 & 2032
- Figure 95: South America Microfluidics Device Industry Revenue (Million), by Material 2024 & 2032
- Figure 96: South America Microfluidics Device Industry Volume (K Unit), by Material 2024 & 2032
- Figure 97: South America Microfluidics Device Industry Revenue Share (%), by Material 2024 & 2032
- Figure 98: South America Microfluidics Device Industry Volume Share (%), by Material 2024 & 2032
- Figure 99: South America Microfluidics Device Industry Revenue (Million), by Country 2024 & 2032
- Figure 100: South America Microfluidics Device Industry Volume (K Unit), by Country 2024 & 2032
- Figure 101: South America Microfluidics Device Industry Revenue Share (%), by Country 2024 & 2032
- Figure 102: South America Microfluidics Device Industry Volume Share (%), by Country 2024 & 2032
List of Tables
- Table 1: Global Microfluidics Device Industry Revenue Million Forecast, by Region 2019 & 2032
- Table 2: Global Microfluidics Device Industry Volume K Unit Forecast, by Region 2019 & 2032
- Table 3: Global Microfluidics Device Industry Revenue Million Forecast, by Product Type 2019 & 2032
- Table 4: Global Microfluidics Device Industry Volume K Unit Forecast, by Product Type 2019 & 2032
- Table 5: Global Microfluidics Device Industry Revenue Million Forecast, by Application 2019 & 2032
- Table 6: Global Microfluidics Device Industry Volume K Unit Forecast, by Application 2019 & 2032
- Table 7: Global Microfluidics Device Industry Revenue Million Forecast, by Material 2019 & 2032
- Table 8: Global Microfluidics Device Industry Volume K Unit Forecast, by Material 2019 & 2032
- Table 9: Global Microfluidics Device Industry Revenue Million Forecast, by Region 2019 & 2032
- Table 10: Global Microfluidics Device Industry Volume K Unit Forecast, by Region 2019 & 2032
- Table 11: Global Microfluidics Device Industry Revenue Million Forecast, by Country 2019 & 2032
- Table 12: Global Microfluidics Device Industry Volume K Unit Forecast, by Country 2019 & 2032
- Table 13: United States Microfluidics Device Industry Revenue (Million) Forecast, by Application 2019 & 2032
- Table 14: United States Microfluidics Device Industry Volume (K Unit) Forecast, by Application 2019 & 2032
- Table 15: Canada Microfluidics Device Industry Revenue (Million) Forecast, by Application 2019 & 2032
- Table 16: Canada Microfluidics Device Industry Volume (K Unit) Forecast, by Application 2019 & 2032
- Table 17: Mexico Microfluidics Device Industry Revenue (Million) Forecast, by Application 2019 & 2032
- Table 18: Mexico Microfluidics Device Industry Volume (K Unit) Forecast, by Application 2019 & 2032
- Table 19: Global Microfluidics Device Industry Revenue Million Forecast, by Country 2019 & 2032
- Table 20: Global Microfluidics Device Industry Volume K Unit Forecast, by Country 2019 & 2032
- Table 21: France Microfluidics Device Industry Revenue (Million) Forecast, by Application 2019 & 2032
- Table 22: France Microfluidics Device Industry Volume (K Unit) Forecast, by Application 2019 & 2032
- Table 23: United Kingdom Microfluidics Device Industry Revenue (Million) Forecast, by Application 2019 & 2032
- Table 24: United Kingdom Microfluidics Device Industry Volume (K Unit) Forecast, by Application 2019 & 2032
- Table 25: Germany Microfluidics Device Industry Revenue (Million) Forecast, by Application 2019 & 2032
- Table 26: Germany Microfluidics Device Industry Volume (K Unit) Forecast, by Application 2019 & 2032
- Table 27: Italy Microfluidics Device Industry Revenue (Million) Forecast, by Application 2019 & 2032
- Table 28: Italy Microfluidics Device Industry Volume (K Unit) Forecast, by Application 2019 & 2032
- Table 29: Spain Microfluidics Device Industry Revenue (Million) Forecast, by Application 2019 & 2032
- Table 30: Spain Microfluidics Device Industry Volume (K Unit) Forecast, by Application 2019 & 2032
- Table 31: Rest of Europe Microfluidics Device Industry Revenue (Million) Forecast, by Application 2019 & 2032
- Table 32: Rest of Europe Microfluidics Device Industry Volume (K Unit) Forecast, by Application 2019 & 2032
- Table 33: Global Microfluidics Device Industry Revenue Million Forecast, by Country 2019 & 2032
- Table 34: Global Microfluidics Device Industry Volume K Unit Forecast, by Country 2019 & 2032
- Table 35: China Microfluidics Device Industry Revenue (Million) Forecast, by Application 2019 & 2032
- Table 36: China Microfluidics Device Industry Volume (K Unit) Forecast, by Application 2019 & 2032
- Table 37: Japan Microfluidics Device Industry Revenue (Million) Forecast, by Application 2019 & 2032
- Table 38: Japan Microfluidics Device Industry Volume (K Unit) Forecast, by Application 2019 & 2032
- Table 39: India Microfluidics Device Industry Revenue (Million) Forecast, by Application 2019 & 2032
- Table 40: India Microfluidics Device Industry Volume (K Unit) Forecast, by Application 2019 & 2032
- Table 41: Australia Microfluidics Device Industry Revenue (Million) Forecast, by Application 2019 & 2032
- Table 42: Australia Microfluidics Device Industry Volume (K Unit) Forecast, by Application 2019 & 2032
- Table 43: South Korea Microfluidics Device Industry Revenue (Million) Forecast, by Application 2019 & 2032
- Table 44: South Korea Microfluidics Device Industry Volume (K Unit) Forecast, by Application 2019 & 2032
- Table 45: Rest of Asia Pacific Microfluidics Device Industry Revenue (Million) Forecast, by Application 2019 & 2032
- Table 46: Rest of Asia Pacific Microfluidics Device Industry Volume (K Unit) Forecast, by Application 2019 & 2032
- Table 47: Global Microfluidics Device Industry Revenue Million Forecast, by Country 2019 & 2032
- Table 48: Global Microfluidics Device Industry Volume K Unit Forecast, by Country 2019 & 2032
- Table 49: GCC Microfluidics Device Industry Revenue (Million) Forecast, by Application 2019 & 2032
- Table 50: GCC Microfluidics Device Industry Volume (K Unit) Forecast, by Application 2019 & 2032
- Table 51: South Africa Microfluidics Device Industry Revenue (Million) Forecast, by Application 2019 & 2032
- Table 52: South Africa Microfluidics Device Industry Volume (K Unit) Forecast, by Application 2019 & 2032
- Table 53: Rest of Middle East and Africa Microfluidics Device Industry Revenue (Million) Forecast, by Application 2019 & 2032
- Table 54: Rest of Middle East and Africa Microfluidics Device Industry Volume (K Unit) Forecast, by Application 2019 & 2032
- Table 55: Global Microfluidics Device Industry Revenue Million Forecast, by Country 2019 & 2032
- Table 56: Global Microfluidics Device Industry Volume K Unit Forecast, by Country 2019 & 2032
- Table 57: Brazil Microfluidics Device Industry Revenue (Million) Forecast, by Application 2019 & 2032
- Table 58: Brazil Microfluidics Device Industry Volume (K Unit) Forecast, by Application 2019 & 2032
- Table 59: Argentina Microfluidics Device Industry Revenue (Million) Forecast, by Application 2019 & 2032
- Table 60: Argentina Microfluidics Device Industry Volume (K Unit) Forecast, by Application 2019 & 2032
- Table 61: Rest of South America Microfluidics Device Industry Revenue (Million) Forecast, by Application 2019 & 2032
- Table 62: Rest of South America Microfluidics Device Industry Volume (K Unit) Forecast, by Application 2019 & 2032
- Table 63: Global Microfluidics Device Industry Revenue Million Forecast, by Product Type 2019 & 2032
- Table 64: Global Microfluidics Device Industry Volume K Unit Forecast, by Product Type 2019 & 2032
- Table 65: Global Microfluidics Device Industry Revenue Million Forecast, by Application 2019 & 2032
- Table 66: Global Microfluidics Device Industry Volume K Unit Forecast, by Application 2019 & 2032
- Table 67: Global Microfluidics Device Industry Revenue Million Forecast, by Material 2019 & 2032
- Table 68: Global Microfluidics Device Industry Volume K Unit Forecast, by Material 2019 & 2032
- Table 69: Global Microfluidics Device Industry Revenue Million Forecast, by Country 2019 & 2032
- Table 70: Global Microfluidics Device Industry Volume K Unit Forecast, by Country 2019 & 2032
- Table 71: United States Microfluidics Device Industry Revenue (Million) Forecast, by Application 2019 & 2032
- Table 72: United States Microfluidics Device Industry Volume (K Unit) Forecast, by Application 2019 & 2032
- Table 73: Canada Microfluidics Device Industry Revenue (Million) Forecast, by Application 2019 & 2032
- Table 74: Canada Microfluidics Device Industry Volume (K Unit) Forecast, by Application 2019 & 2032
- Table 75: Mexico Microfluidics Device Industry Revenue (Million) Forecast, by Application 2019 & 2032
- Table 76: Mexico Microfluidics Device Industry Volume (K Unit) Forecast, by Application 2019 & 2032
- Table 77: Global Microfluidics Device Industry Revenue Million Forecast, by Product Type 2019 & 2032
- Table 78: Global Microfluidics Device Industry Volume K Unit Forecast, by Product Type 2019 & 2032
- Table 79: Global Microfluidics Device Industry Revenue Million Forecast, by Application 2019 & 2032
- Table 80: Global Microfluidics Device Industry Volume K Unit Forecast, by Application 2019 & 2032
- Table 81: Global Microfluidics Device Industry Revenue Million Forecast, by Material 2019 & 2032
- Table 82: Global Microfluidics Device Industry Volume K Unit Forecast, by Material 2019 & 2032
- Table 83: Global Microfluidics Device Industry Revenue Million Forecast, by Country 2019 & 2032
- Table 84: Global Microfluidics Device Industry Volume K Unit Forecast, by Country 2019 & 2032
- Table 85: France Microfluidics Device Industry Revenue (Million) Forecast, by Application 2019 & 2032
- Table 86: France Microfluidics Device Industry Volume (K Unit) Forecast, by Application 2019 & 2032
- Table 87: United Kingdom Microfluidics Device Industry Revenue (Million) Forecast, by Application 2019 & 2032
- Table 88: United Kingdom Microfluidics Device Industry Volume (K Unit) Forecast, by Application 2019 & 2032
- Table 89: Germany Microfluidics Device Industry Revenue (Million) Forecast, by Application 2019 & 2032
- Table 90: Germany Microfluidics Device Industry Volume (K Unit) Forecast, by Application 2019 & 2032
- Table 91: Italy Microfluidics Device Industry Revenue (Million) Forecast, by Application 2019 & 2032
- Table 92: Italy Microfluidics Device Industry Volume (K Unit) Forecast, by Application 2019 & 2032
- Table 93: Spain Microfluidics Device Industry Revenue (Million) Forecast, by Application 2019 & 2032
- Table 94: Spain Microfluidics Device Industry Volume (K Unit) Forecast, by Application 2019 & 2032
- Table 95: Rest of Europe Microfluidics Device Industry Revenue (Million) Forecast, by Application 2019 & 2032
- Table 96: Rest of Europe Microfluidics Device Industry Volume (K Unit) Forecast, by Application 2019 & 2032
- Table 97: Global Microfluidics Device Industry Revenue Million Forecast, by Product Type 2019 & 2032
- Table 98: Global Microfluidics Device Industry Volume K Unit Forecast, by Product Type 2019 & 2032
- Table 99: Global Microfluidics Device Industry Revenue Million Forecast, by Application 2019 & 2032
- Table 100: Global Microfluidics Device Industry Volume K Unit Forecast, by Application 2019 & 2032
- Table 101: Global Microfluidics Device Industry Revenue Million Forecast, by Material 2019 & 2032
- Table 102: Global Microfluidics Device Industry Volume K Unit Forecast, by Material 2019 & 2032
- Table 103: Global Microfluidics Device Industry Revenue Million Forecast, by Country 2019 & 2032
- Table 104: Global Microfluidics Device Industry Volume K Unit Forecast, by Country 2019 & 2032
- Table 105: China Microfluidics Device Industry Revenue (Million) Forecast, by Application 2019 & 2032
- Table 106: China Microfluidics Device Industry Volume (K Unit) Forecast, by Application 2019 & 2032
- Table 107: Japan Microfluidics Device Industry Revenue (Million) Forecast, by Application 2019 & 2032
- Table 108: Japan Microfluidics Device Industry Volume (K Unit) Forecast, by Application 2019 & 2032
- Table 109: India Microfluidics Device Industry Revenue (Million) Forecast, by Application 2019 & 2032
- Table 110: India Microfluidics Device Industry Volume (K Unit) Forecast, by Application 2019 & 2032
- Table 111: Australia Microfluidics Device Industry Revenue (Million) Forecast, by Application 2019 & 2032
- Table 112: Australia Microfluidics Device Industry Volume (K Unit) Forecast, by Application 2019 & 2032
- Table 113: South Korea Microfluidics Device Industry Revenue (Million) Forecast, by Application 2019 & 2032
- Table 114: South Korea Microfluidics Device Industry Volume (K Unit) Forecast, by Application 2019 & 2032
- Table 115: Rest of Asia Pacific Microfluidics Device Industry Revenue (Million) Forecast, by Application 2019 & 2032
- Table 116: Rest of Asia Pacific Microfluidics Device Industry Volume (K Unit) Forecast, by Application 2019 & 2032
- Table 117: Global Microfluidics Device Industry Revenue Million Forecast, by Product Type 2019 & 2032
- Table 118: Global Microfluidics Device Industry Volume K Unit Forecast, by Product Type 2019 & 2032
- Table 119: Global Microfluidics Device Industry Revenue Million Forecast, by Application 2019 & 2032
- Table 120: Global Microfluidics Device Industry Volume K Unit Forecast, by Application 2019 & 2032
- Table 121: Global Microfluidics Device Industry Revenue Million Forecast, by Material 2019 & 2032
- Table 122: Global Microfluidics Device Industry Volume K Unit Forecast, by Material 2019 & 2032
- Table 123: Global Microfluidics Device Industry Revenue Million Forecast, by Country 2019 & 2032
- Table 124: Global Microfluidics Device Industry Volume K Unit Forecast, by Country 2019 & 2032
- Table 125: GCC Microfluidics Device Industry Revenue (Million) Forecast, by Application 2019 & 2032
- Table 126: GCC Microfluidics Device Industry Volume (K Unit) Forecast, by Application 2019 & 2032
- Table 127: South Africa Microfluidics Device Industry Revenue (Million) Forecast, by Application 2019 & 2032
- Table 128: South Africa Microfluidics Device Industry Volume (K Unit) Forecast, by Application 2019 & 2032
- Table 129: Rest of Middle East and Africa Microfluidics Device Industry Revenue (Million) Forecast, by Application 2019 & 2032
- Table 130: Rest of Middle East and Africa Microfluidics Device Industry Volume (K Unit) Forecast, by Application 2019 & 2032
- Table 131: Global Microfluidics Device Industry Revenue Million Forecast, by Product Type 2019 & 2032
- Table 132: Global Microfluidics Device Industry Volume K Unit Forecast, by Product Type 2019 & 2032
- Table 133: Global Microfluidics Device Industry Revenue Million Forecast, by Application 2019 & 2032
- Table 134: Global Microfluidics Device Industry Volume K Unit Forecast, by Application 2019 & 2032
- Table 135: Global Microfluidics Device Industry Revenue Million Forecast, by Material 2019 & 2032
- Table 136: Global Microfluidics Device Industry Volume K Unit Forecast, by Material 2019 & 2032
- Table 137: Global Microfluidics Device Industry Revenue Million Forecast, by Country 2019 & 2032
- Table 138: Global Microfluidics Device Industry Volume K Unit Forecast, by Country 2019 & 2032
- Table 139: Brazil Microfluidics Device Industry Revenue (Million) Forecast, by Application 2019 & 2032
- Table 140: Brazil Microfluidics Device Industry Volume (K Unit) Forecast, by Application 2019 & 2032
- Table 141: Argentina Microfluidics Device Industry Revenue (Million) Forecast, by Application 2019 & 2032
- Table 142: Argentina Microfluidics Device Industry Volume (K Unit) Forecast, by Application 2019 & 2032
- Table 143: Rest of South America Microfluidics Device Industry Revenue (Million) Forecast, by Application 2019 & 2032
- Table 144: Rest of South America Microfluidics Device Industry Volume (K Unit) Forecast, by Application 2019 & 2032
Frequently Asked Questions
1. What is the projected Compound Annual Growth Rate (CAGR) of the Microfluidics Device Industry?
The projected CAGR is approximately 14.79%.
2. Which companies are prominent players in the Microfluidics Device Industry?
Key companies in the market include Hesperos Inc, Quidel Corporation, Emulate Inc, Bio-Rad Laboratories Inc, Fluigent SA, ZEON CORPORATION, Dolomite Microfluidics (Blacktrace Holdings Ltd), Micronit Microfluidics, Biosurfit SA, Bartels-Mikrotechnik, Sphere Fluidics Limited, Agilent Technologies Inc, UFluidix, PerkinElmer Inc, Illumina Inc, FluIdigm Corporation, Nanomix Inc.
3. What are the main segments of the Microfluidics Device Industry?
The market segments include Product Type, Application, Material.
4. Can you provide details about the market size?
The market size is estimated to be USD 32.58 Million as of 2022.
5. What are some drivers contributing to market growth?
Increasing Demand for Point-of-care Testing; Increasing Incidences of Various Diseases; Faster Turn-around Time for Analysis and Improved Portability of Devices.
6. What are the notable trends driving market growth?
The Point-of-Care Diagnostics Segment is Expected to Witness Considerable Growth During the Forecast Period.
7. Are there any restraints impacting market growth?
Integration of Microfluidics Technology with Existing Workflows; Low Adoption in Developing Countries Due to High Prices.
8. Can you provide examples of recent developments in the market?
November 2023: Microfluidics, a unit of IDEX Material Processing Technology (MPT), launched Microfluidics’ newest processor, which is designed for production scale cell disruption, which is used in the manufacturing of many biological products such as antigens for vaccines and viral vectors that deliver genes for next-generation gene therapy.
9. What pricing options are available for accessing the report?
Pricing options include single-user, multi-user, and enterprise licenses priced at USD 4750, USD 5250, and USD 8750 respectively.
10. Is the market size provided in terms of value or volume?
The market size is provided in terms of value, measured in Million and volume, measured in K Unit.
11. Are there any specific market keywords associated with the report?
Yes, the market keyword associated with the report is "Microfluidics Device Industry," which aids in identifying and referencing the specific market segment covered.
12. How do I determine which pricing option suits my needs best?
The pricing options vary based on user requirements and access needs. Individual users may opt for single-user licenses, while businesses requiring broader access may choose multi-user or enterprise licenses for cost-effective access to the report.
13. Are there any additional resources or data provided in the Microfluidics Device Industry report?
While the report offers comprehensive insights, it's advisable to review the specific contents or supplementary materials provided to ascertain if additional resources or data are available.
14. How can I stay updated on further developments or reports in the Microfluidics Device Industry?
To stay informed about further developments, trends, and reports in the Microfluidics Device Industry, consider subscribing to industry newsletters, following relevant companies and organizations, or regularly checking reputable industry news sources and publications.
Methodology
Step 1 - Identification of Relevant Samples Size from Population Database


Step 2 - Approaches for Defining Global Market Size (Value, Volume* & Price*)

Note*: In applicable scenarios
Step 3 - Data Sources
Primary Research
- Web Analytics
- Survey Reports
- Research Institute
- Latest Research Reports
- Opinion Leaders
Secondary Research
- Annual Reports
- White Paper
- Latest Press Release
- Industry Association
- Paid Database
- Investor Presentations

Step 4 - Data Triangulation
Involves using different sources of information in order to increase the validity of a study
These sources are likely to be stakeholders in a program - participants, other researchers, program staff, other community members, and so on.
Then we put all data in single framework & apply various statistical tools to find out the dynamic on the market.
During the analysis stage, feedback from the stakeholder groups would be compared to determine areas of agreement as well as areas of divergence


