
Key Insights
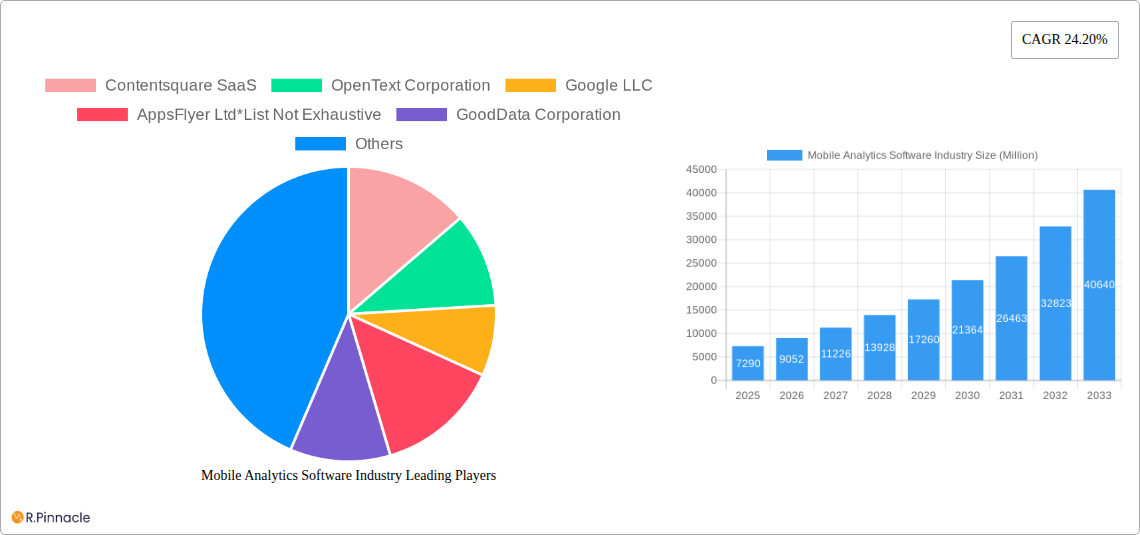
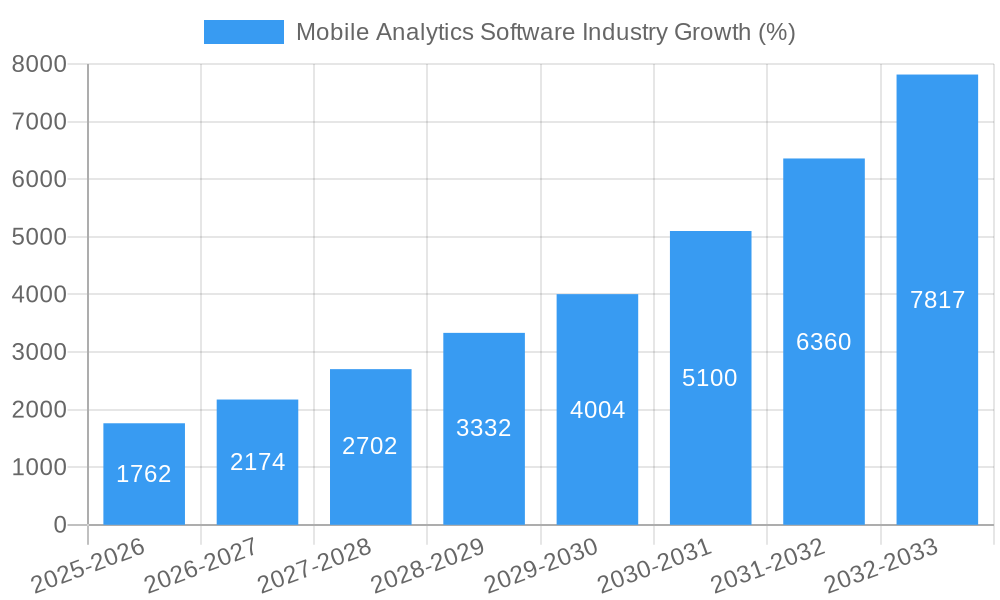
The mobile analytics software market, currently valued at $7.29 billion (2025), is experiencing robust growth, projected to expand at a Compound Annual Growth Rate (CAGR) of 24.20% from 2025 to 2033. This surge is fueled by several key drivers. The increasing adoption of mobile devices across various sectors, coupled with the need for businesses to understand user behavior and optimize mobile experiences, is a major catalyst. Furthermore, the rise of sophisticated analytics tools capable of providing real-time insights into user engagement, app performance, and campaign effectiveness is significantly impacting market growth. Advanced features like predictive analytics and machine learning are further enhancing the value proposition of these solutions, attracting a diverse range of industries including retail, BFSI (Banking, Financial Services, and Insurance), and media and entertainment. Segmentation by type (Application Analytics, Campaign Analytics, Service Analytics, and Other Applications) highlights the diverse applications of mobile analytics, catering to specific business needs. Competitive dynamics are shaped by established players like Google, Salesforce, and Adobe, alongside specialized analytics providers, fostering innovation and driving market expansion.
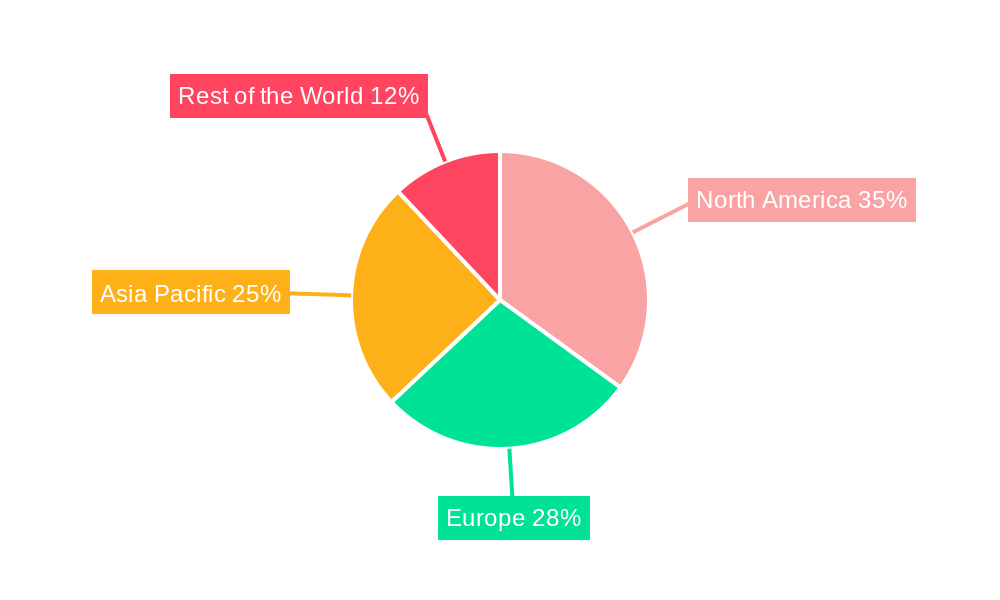
Despite the impressive growth trajectory, the market faces certain restraints. Data privacy concerns and regulatory compliance requirements are paramount, necessitating robust data security measures and adherence to evolving privacy regulations like GDPR and CCPA. Furthermore, the complexity of some analytics tools and the need for specialized expertise can pose a barrier to entry for smaller businesses. The integration of mobile analytics with other marketing and business intelligence platforms also presents a challenge, requiring seamless compatibility and data interoperability. However, the ongoing technological advancements and the increasing demand for data-driven decision-making are expected to outweigh these limitations, propelling continued market expansion in the coming years. The Asia-Pacific region is projected to witness significant growth due to rising smartphone penetration and increasing digital adoption.
Mobile Analytics Software Industry Report: 2019-2033
This comprehensive report provides a detailed analysis of the Mobile Analytics Software industry, covering market size, growth trends, competitive landscape, and future outlook from 2019 to 2033. The report leverages extensive data analysis and insights to offer actionable intelligence for industry professionals, investors, and strategists. The study period spans 2019-2033, with 2025 as the base and estimated year. The forecast period is 2025-2033, and the historical period is 2019-2024.
Mobile Analytics Software Industry Market Structure & Innovation Trends
The Mobile Analytics Software market is characterized by a mix of large established players and emerging innovative companies. Market concentration is moderate, with a few dominant players holding significant market share, estimated at xx Million in 2025. However, the market shows signs of increasing fragmentation due to the influx of smaller, specialized firms. Innovation is a key driver, fueled by advancements in data analytics, AI, and machine learning. Regulatory frameworks, particularly concerning data privacy (e.g., GDPR, CCPA), significantly impact market dynamics. Product substitutes, such as in-house analytics solutions, present competition, although specialized software often offers superior capabilities. M&A activity has been significant, with deal values exceeding xx Million in recent years, primarily driven by the consolidation of market share and the acquisition of specialized technologies. End-user demographics are expanding, encompassing a broader range of industries and organizational sizes.
- Market Share (2025 Estimate):
- Google LLC: xx%
- Adobe Inc: xx%
- Salesforce com Inc: xx%
- Others: xx%
- M&A Deal Value (2019-2024): xx Million
Mobile Analytics Software Industry Market Dynamics & Trends
The Mobile Analytics Software market exhibits robust growth, driven by the explosive growth of mobile applications and the increasing need for data-driven decision-making. The Compound Annual Growth Rate (CAGR) is projected at xx% during the forecast period (2025-2033). Market penetration is increasing across various industries, particularly in Retail, BFSI, and IT and Telecom. Technological disruptions, such as the adoption of cloud-based analytics and the rise of AI-powered insights, are reshaping the competitive landscape. Consumer preferences are shifting towards real-time analytics and intuitive user interfaces. Competitive dynamics are characterized by intense competition, product differentiation, and strategic partnerships.
Dominant Regions & Segments in Mobile Analytics Software Industry
North America currently holds the largest market share, driven by high mobile app adoption, strong technological infrastructure, and the presence of major players. However, Asia Pacific is projected to experience the fastest growth, fueled by rapid mobile penetration and increasing digitalization.
By Type:
- Application Analytics: This segment is witnessing substantial growth due to increasing app complexity and user engagement expectations.
- Campaign Analytics: This segment is driven by the necessity for precise performance monitoring of mobile marketing efforts.
- Service Analytics: Growth in this segment is driven by the increasing demand for improved service quality and customer experience.
- Other Applications: This segment is steadily growing, driven by various emerging mobile applications and analytics needs.
By End-User Vertical:
- Retail: This segment benefits from increased e-commerce and personalized marketing demands.
- BFSI (Banking, Financial Services, and Insurance): This segment utilizes mobile analytics for fraud detection, risk management, and customer relationship management.
- Government: This segment utilizes mobile analytics for public service optimization and citizen engagement.
- IT and Telecom: This segment utilizes mobile analytics for network performance optimization and customer experience management.
- Media and Entertainment: This segment utilizes mobile analytics for content personalization and targeted advertising.
Key Drivers:
- North America: Strong technological infrastructure, high mobile app adoption, established players.
- Asia Pacific: Rapid mobile penetration, increasing digitalization, rising disposable incomes.
Mobile Analytics Software Industry Product Innovations
Recent product innovations focus on enhancing user experience, integrating AI/ML for predictive analytics, and providing real-time dashboards. Key trends include cloud-based solutions, improved data visualization, and enhanced data security features. These innovations cater to the growing need for actionable insights and seamless integration with existing marketing and business intelligence systems. The market fit for these advancements is high, driven by the ever-increasing demands for data-driven decision-making in the mobile app ecosystem.
Report Scope & Segmentation Analysis
This report provides a detailed segmentation analysis of the Mobile Analytics Software market by Type (Application Analytics, Campaign Analytics, Service Analytics, Other Applications) and by End-User Vertical (Retail, BFSI, Government, IT and Telecom, Media and Entertainment, Other End-User Verticals). Each segment is analyzed in terms of its market size, growth projections, and competitive dynamics. The report offers insights into the various drivers and challenges that affect each segment's growth trajectory.
Key Drivers of Mobile Analytics Software Industry Growth
Several factors fuel the growth of this industry. The proliferation of smartphones and mobile apps creates massive data volumes demanding robust analytics solutions. The increasing emphasis on data-driven decision-making across all sectors boosts the demand for sophisticated analytics tools. Technological advancements, particularly in AI and machine learning, enable more accurate and insightful data analysis. Furthermore, supportive regulatory frameworks promoting data-driven innovation contribute to market expansion.
Challenges in the Mobile Analytics Software Industry Sector
The industry faces challenges such as data privacy concerns, which necessitate strict compliance with regulations like GDPR and CCPA. Maintaining data security and preventing breaches is also crucial. Furthermore, intense competition and the need for continuous innovation add to the complexities of operating in this rapidly evolving space. The cost of integrating complex analytics solutions can also be a barrier for smaller organizations.
Emerging Opportunities in Mobile Analytics Software Industry
Emerging opportunities lie in the integration of advanced analytics with other technologies, such as IoT and blockchain. The expansion into new geographic markets, especially in developing economies with growing mobile penetration, offers significant potential. The development of specialized solutions targeting niche industries and vertical markets presents another lucrative opportunity. Finally, leveraging AI and machine learning to provide more personalized and predictive analytics capabilities will create new avenues for growth.
Leading Players in the Mobile Analytics Software Industry Market
- Contentsquare SaaS
- OpenText Corporation
- Google LLC
- AppsFlyer Ltd
- GoodData Corporation
- Salesforce com Inc
- Microsoft Corporation
- Adobe Inc
- Oracle Corp
- Facebook Inc
Key Developments in Mobile Analytics Software Industry
- April 2022: Adjust released Adjust Datascape, a mobile marketing analytics solution offering improved KPI and performance metric accessibility.
- August 2022: Pinterest launched real-time statistics for Pin Analytics on smartphones, improving accessibility for users.
- February 2022: IronSource announced a new app analytics tool to enhance revenue, customer retention, and growth for app and game creators.
Future Outlook for Mobile Analytics Software Industry Market
The Mobile Analytics Software market is poised for continued robust growth, driven by factors such as rising mobile app usage, increased adoption of data-driven decision-making, and ongoing technological innovations. Strategic opportunities exist in developing advanced analytics solutions, expanding into new geographic markets, and fostering strategic partnerships. The market is expected to reach xx Million by 2033, offering significant potential for both established players and new entrants.
Mobile Analytics Software Industry Segmentation
-
1. Type
- 1.1. Application Analytics
- 1.2. Campaign Analytics
- 1.3. Service Analytics
- 1.4. Other Applications
-
2. End-User Vertical
- 2.1. Retail
- 2.2. BFSI
- 2.3. Government
- 2.4. IT and Telecom
- 2.5. Media and Entertainment
- 2.6. Other End-User Verticals
Mobile Analytics Software Industry Segmentation By Geography
- 1. North America
- 2. Europe
- 3. Asia Pacific
- 4. Rest of the World
Mobile Analytics Software Industry REPORT HIGHLIGHTS
| Aspects | Details |
|---|---|
| Study Period | 2019-2033 |
| Base Year | 2024 |
| Estimated Year | 2025 |
| Forecast Period | 2025-2033 |
| Historical Period | 2019-2024 |
| Growth Rate | CAGR of 24.20% from 2019-2033 |
| Segmentation |
|
Table of Contents
- 1. Introduction
- 1.1. Research Scope
- 1.2. Market Segmentation
- 1.3. Research Methodology
- 1.4. Definitions and Assumptions
- 2. Executive Summary
- 2.1. Introduction
- 3. Market Dynamics
- 3.1. Introduction
- 3.2. Market Drivers
- 3.2.1. Smartphone Revolution to Generate Enormous Data; Data Explosion from E- commerce Likely to Propel the Market
- 3.3. Market Restrains
- 3.3.1. Failure of the Widespread Adoption of 4G Services Due to Insufficient Users; Lack of Internet Penetration in Certain Areas
- 3.4. Market Trends
- 3.4.1. Retail Industry Holds Significant Market Share
- 4. Market Factor Analysis
- 4.1. Porters Five Forces
- 4.2. Supply/Value Chain
- 4.3. PESTEL analysis
- 4.4. Market Entropy
- 4.5. Patent/Trademark Analysis
- 5. Global Mobile Analytics Software Industry Analysis, Insights and Forecast, 2019-2031
- 5.1. Market Analysis, Insights and Forecast - by Type
- 5.1.1. Application Analytics
- 5.1.2. Campaign Analytics
- 5.1.3. Service Analytics
- 5.1.4. Other Applications
- 5.2. Market Analysis, Insights and Forecast - by End-User Vertical
- 5.2.1. Retail
- 5.2.2. BFSI
- 5.2.3. Government
- 5.2.4. IT and Telecom
- 5.2.5. Media and Entertainment
- 5.2.6. Other End-User Verticals
- 5.3. Market Analysis, Insights and Forecast - by Region
- 5.3.1. North America
- 5.3.2. Europe
- 5.3.3. Asia Pacific
- 5.3.4. Rest of the World
- 5.1. Market Analysis, Insights and Forecast - by Type
- 6. North America Mobile Analytics Software Industry Analysis, Insights and Forecast, 2019-2031
- 6.1. Market Analysis, Insights and Forecast - by Type
- 6.1.1. Application Analytics
- 6.1.2. Campaign Analytics
- 6.1.3. Service Analytics
- 6.1.4. Other Applications
- 6.2. Market Analysis, Insights and Forecast - by End-User Vertical
- 6.2.1. Retail
- 6.2.2. BFSI
- 6.2.3. Government
- 6.2.4. IT and Telecom
- 6.2.5. Media and Entertainment
- 6.2.6. Other End-User Verticals
- 6.1. Market Analysis, Insights and Forecast - by Type
- 7. Europe Mobile Analytics Software Industry Analysis, Insights and Forecast, 2019-2031
- 7.1. Market Analysis, Insights and Forecast - by Type
- 7.1.1. Application Analytics
- 7.1.2. Campaign Analytics
- 7.1.3. Service Analytics
- 7.1.4. Other Applications
- 7.2. Market Analysis, Insights and Forecast - by End-User Vertical
- 7.2.1. Retail
- 7.2.2. BFSI
- 7.2.3. Government
- 7.2.4. IT and Telecom
- 7.2.5. Media and Entertainment
- 7.2.6. Other End-User Verticals
- 7.1. Market Analysis, Insights and Forecast - by Type
- 8. Asia Pacific Mobile Analytics Software Industry Analysis, Insights and Forecast, 2019-2031
- 8.1. Market Analysis, Insights and Forecast - by Type
- 8.1.1. Application Analytics
- 8.1.2. Campaign Analytics
- 8.1.3. Service Analytics
- 8.1.4. Other Applications
- 8.2. Market Analysis, Insights and Forecast - by End-User Vertical
- 8.2.1. Retail
- 8.2.2. BFSI
- 8.2.3. Government
- 8.2.4. IT and Telecom
- 8.2.5. Media and Entertainment
- 8.2.6. Other End-User Verticals
- 8.1. Market Analysis, Insights and Forecast - by Type
- 9. Rest of the World Mobile Analytics Software Industry Analysis, Insights and Forecast, 2019-2031
- 9.1. Market Analysis, Insights and Forecast - by Type
- 9.1.1. Application Analytics
- 9.1.2. Campaign Analytics
- 9.1.3. Service Analytics
- 9.1.4. Other Applications
- 9.2. Market Analysis, Insights and Forecast - by End-User Vertical
- 9.2.1. Retail
- 9.2.2. BFSI
- 9.2.3. Government
- 9.2.4. IT and Telecom
- 9.2.5. Media and Entertainment
- 9.2.6. Other End-User Verticals
- 9.1. Market Analysis, Insights and Forecast - by Type
- 10. North America Mobile Analytics Software Industry Analysis, Insights and Forecast, 2019-2031
- 10.1. Market Analysis, Insights and Forecast - By Country/Sub-region
- 10.1.1.
- 11. Europe Mobile Analytics Software Industry Analysis, Insights and Forecast, 2019-2031
- 11.1. Market Analysis, Insights and Forecast - By Country/Sub-region
- 11.1.1.
- 12. Asia Pacific Mobile Analytics Software Industry Analysis, Insights and Forecast, 2019-2031
- 12.1. Market Analysis, Insights and Forecast - By Country/Sub-region
- 12.1.1.
- 13. Rest of the World Mobile Analytics Software Industry Analysis, Insights and Forecast, 2019-2031
- 13.1. Market Analysis, Insights and Forecast - By Country/Sub-region
- 13.1.1.
- 14. Competitive Analysis
- 14.1. Global Market Share Analysis 2024
- 14.2. Company Profiles
- 14.2.1 Contentsquare SaaS
- 14.2.1.1. Overview
- 14.2.1.2. Products
- 14.2.1.3. SWOT Analysis
- 14.2.1.4. Recent Developments
- 14.2.1.5. Financials (Based on Availability)
- 14.2.2 OpenText Corporation
- 14.2.2.1. Overview
- 14.2.2.2. Products
- 14.2.2.3. SWOT Analysis
- 14.2.2.4. Recent Developments
- 14.2.2.5. Financials (Based on Availability)
- 14.2.3 Google LLC
- 14.2.3.1. Overview
- 14.2.3.2. Products
- 14.2.3.3. SWOT Analysis
- 14.2.3.4. Recent Developments
- 14.2.3.5. Financials (Based on Availability)
- 14.2.4 AppsFlyer Ltd*List Not Exhaustive
- 14.2.4.1. Overview
- 14.2.4.2. Products
- 14.2.4.3. SWOT Analysis
- 14.2.4.4. Recent Developments
- 14.2.4.5. Financials (Based on Availability)
- 14.2.5 GoodData Corporation
- 14.2.5.1. Overview
- 14.2.5.2. Products
- 14.2.5.3. SWOT Analysis
- 14.2.5.4. Recent Developments
- 14.2.5.5. Financials (Based on Availability)
- 14.2.6 Salesforce com Inc
- 14.2.6.1. Overview
- 14.2.6.2. Products
- 14.2.6.3. SWOT Analysis
- 14.2.6.4. Recent Developments
- 14.2.6.5. Financials (Based on Availability)
- 14.2.7 Microsoft Corporation
- 14.2.7.1. Overview
- 14.2.7.2. Products
- 14.2.7.3. SWOT Analysis
- 14.2.7.4. Recent Developments
- 14.2.7.5. Financials (Based on Availability)
- 14.2.8 Adobe Inc
- 14.2.8.1. Overview
- 14.2.8.2. Products
- 14.2.8.3. SWOT Analysis
- 14.2.8.4. Recent Developments
- 14.2.8.5. Financials (Based on Availability)
- 14.2.9 Oracle Corp
- 14.2.9.1. Overview
- 14.2.9.2. Products
- 14.2.9.3. SWOT Analysis
- 14.2.9.4. Recent Developments
- 14.2.9.5. Financials (Based on Availability)
- 14.2.10 Facebook Inc
- 14.2.10.1. Overview
- 14.2.10.2. Products
- 14.2.10.3. SWOT Analysis
- 14.2.10.4. Recent Developments
- 14.2.10.5. Financials (Based on Availability)
- 14.2.1 Contentsquare SaaS
List of Figures
- Figure 1: Global Mobile Analytics Software Industry Revenue Breakdown (Million, %) by Region 2024 & 2032
- Figure 2: North America Mobile Analytics Software Industry Revenue (Million), by Country 2024 & 2032
- Figure 3: North America Mobile Analytics Software Industry Revenue Share (%), by Country 2024 & 2032
- Figure 4: Europe Mobile Analytics Software Industry Revenue (Million), by Country 2024 & 2032
- Figure 5: Europe Mobile Analytics Software Industry Revenue Share (%), by Country 2024 & 2032
- Figure 6: Asia Pacific Mobile Analytics Software Industry Revenue (Million), by Country 2024 & 2032
- Figure 7: Asia Pacific Mobile Analytics Software Industry Revenue Share (%), by Country 2024 & 2032
- Figure 8: Rest of the World Mobile Analytics Software Industry Revenue (Million), by Country 2024 & 2032
- Figure 9: Rest of the World Mobile Analytics Software Industry Revenue Share (%), by Country 2024 & 2032
- Figure 10: North America Mobile Analytics Software Industry Revenue (Million), by Type 2024 & 2032
- Figure 11: North America Mobile Analytics Software Industry Revenue Share (%), by Type 2024 & 2032
- Figure 12: North America Mobile Analytics Software Industry Revenue (Million), by End-User Vertical 2024 & 2032
- Figure 13: North America Mobile Analytics Software Industry Revenue Share (%), by End-User Vertical 2024 & 2032
- Figure 14: North America Mobile Analytics Software Industry Revenue (Million), by Country 2024 & 2032
- Figure 15: North America Mobile Analytics Software Industry Revenue Share (%), by Country 2024 & 2032
- Figure 16: Europe Mobile Analytics Software Industry Revenue (Million), by Type 2024 & 2032
- Figure 17: Europe Mobile Analytics Software Industry Revenue Share (%), by Type 2024 & 2032
- Figure 18: Europe Mobile Analytics Software Industry Revenue (Million), by End-User Vertical 2024 & 2032
- Figure 19: Europe Mobile Analytics Software Industry Revenue Share (%), by End-User Vertical 2024 & 2032
- Figure 20: Europe Mobile Analytics Software Industry Revenue (Million), by Country 2024 & 2032
- Figure 21: Europe Mobile Analytics Software Industry Revenue Share (%), by Country 2024 & 2032
- Figure 22: Asia Pacific Mobile Analytics Software Industry Revenue (Million), by Type 2024 & 2032
- Figure 23: Asia Pacific Mobile Analytics Software Industry Revenue Share (%), by Type 2024 & 2032
- Figure 24: Asia Pacific Mobile Analytics Software Industry Revenue (Million), by End-User Vertical 2024 & 2032
- Figure 25: Asia Pacific Mobile Analytics Software Industry Revenue Share (%), by End-User Vertical 2024 & 2032
- Figure 26: Asia Pacific Mobile Analytics Software Industry Revenue (Million), by Country 2024 & 2032
- Figure 27: Asia Pacific Mobile Analytics Software Industry Revenue Share (%), by Country 2024 & 2032
- Figure 28: Rest of the World Mobile Analytics Software Industry Revenue (Million), by Type 2024 & 2032
- Figure 29: Rest of the World Mobile Analytics Software Industry Revenue Share (%), by Type 2024 & 2032
- Figure 30: Rest of the World Mobile Analytics Software Industry Revenue (Million), by End-User Vertical 2024 & 2032
- Figure 31: Rest of the World Mobile Analytics Software Industry Revenue Share (%), by End-User Vertical 2024 & 2032
- Figure 32: Rest of the World Mobile Analytics Software Industry Revenue (Million), by Country 2024 & 2032
- Figure 33: Rest of the World Mobile Analytics Software Industry Revenue Share (%), by Country 2024 & 2032
List of Tables
- Table 1: Global Mobile Analytics Software Industry Revenue Million Forecast, by Region 2019 & 2032
- Table 2: Global Mobile Analytics Software Industry Revenue Million Forecast, by Type 2019 & 2032
- Table 3: Global Mobile Analytics Software Industry Revenue Million Forecast, by End-User Vertical 2019 & 2032
- Table 4: Global Mobile Analytics Software Industry Revenue Million Forecast, by Region 2019 & 2032
- Table 5: Global Mobile Analytics Software Industry Revenue Million Forecast, by Country 2019 & 2032
- Table 6: Mobile Analytics Software Industry Revenue (Million) Forecast, by Application 2019 & 2032
- Table 7: Global Mobile Analytics Software Industry Revenue Million Forecast, by Country 2019 & 2032
- Table 8: Mobile Analytics Software Industry Revenue (Million) Forecast, by Application 2019 & 2032
- Table 9: Global Mobile Analytics Software Industry Revenue Million Forecast, by Country 2019 & 2032
- Table 10: Mobile Analytics Software Industry Revenue (Million) Forecast, by Application 2019 & 2032
- Table 11: Global Mobile Analytics Software Industry Revenue Million Forecast, by Country 2019 & 2032
- Table 12: Mobile Analytics Software Industry Revenue (Million) Forecast, by Application 2019 & 2032
- Table 13: Global Mobile Analytics Software Industry Revenue Million Forecast, by Type 2019 & 2032
- Table 14: Global Mobile Analytics Software Industry Revenue Million Forecast, by End-User Vertical 2019 & 2032
- Table 15: Global Mobile Analytics Software Industry Revenue Million Forecast, by Country 2019 & 2032
- Table 16: Global Mobile Analytics Software Industry Revenue Million Forecast, by Type 2019 & 2032
- Table 17: Global Mobile Analytics Software Industry Revenue Million Forecast, by End-User Vertical 2019 & 2032
- Table 18: Global Mobile Analytics Software Industry Revenue Million Forecast, by Country 2019 & 2032
- Table 19: Global Mobile Analytics Software Industry Revenue Million Forecast, by Type 2019 & 2032
- Table 20: Global Mobile Analytics Software Industry Revenue Million Forecast, by End-User Vertical 2019 & 2032
- Table 21: Global Mobile Analytics Software Industry Revenue Million Forecast, by Country 2019 & 2032
- Table 22: Global Mobile Analytics Software Industry Revenue Million Forecast, by Type 2019 & 2032
- Table 23: Global Mobile Analytics Software Industry Revenue Million Forecast, by End-User Vertical 2019 & 2032
- Table 24: Global Mobile Analytics Software Industry Revenue Million Forecast, by Country 2019 & 2032
Frequently Asked Questions
1. What is the projected Compound Annual Growth Rate (CAGR) of the Mobile Analytics Software Industry?
The projected CAGR is approximately 24.20%.
2. Which companies are prominent players in the Mobile Analytics Software Industry?
Key companies in the market include Contentsquare SaaS, OpenText Corporation, Google LLC, AppsFlyer Ltd*List Not Exhaustive, GoodData Corporation, Salesforce com Inc, Microsoft Corporation, Adobe Inc, Oracle Corp, Facebook Inc.
3. What are the main segments of the Mobile Analytics Software Industry?
The market segments include Type, End-User Vertical.
4. Can you provide details about the market size?
The market size is estimated to be USD 7.29 Million as of 2022.
5. What are some drivers contributing to market growth?
Smartphone Revolution to Generate Enormous Data; Data Explosion from E- commerce Likely to Propel the Market.
6. What are the notable trends driving market growth?
Retail Industry Holds Significant Market Share.
7. Are there any restraints impacting market growth?
Failure of the Widespread Adoption of 4G Services Due to Insufficient Users; Lack of Internet Penetration in Certain Areas.
8. Can you provide examples of recent developments in the market?
February 2022 - IronSource has announced a new app analytics tool to help app and game creators increase revenue, customer retention, and growth. IronSource is offering a one-stop solution for app monetization, user recruitment, and analytics with the beta edition of App Analytics. Analytics has grown in popularity, as have platforms and techniques for success in mobile apps and games. IronSource claims that the app analytics platform's usability (UX) is far superior to most other alternatives.
9. What pricing options are available for accessing the report?
Pricing options include single-user, multi-user, and enterprise licenses priced at USD 4750, USD 5250, and USD 8750 respectively.
10. Is the market size provided in terms of value or volume?
The market size is provided in terms of value, measured in Million.
11. Are there any specific market keywords associated with the report?
Yes, the market keyword associated with the report is "Mobile Analytics Software Industry," which aids in identifying and referencing the specific market segment covered.
12. How do I determine which pricing option suits my needs best?
The pricing options vary based on user requirements and access needs. Individual users may opt for single-user licenses, while businesses requiring broader access may choose multi-user or enterprise licenses for cost-effective access to the report.
13. Are there any additional resources or data provided in the Mobile Analytics Software Industry report?
While the report offers comprehensive insights, it's advisable to review the specific contents or supplementary materials provided to ascertain if additional resources or data are available.
14. How can I stay updated on further developments or reports in the Mobile Analytics Software Industry?
To stay informed about further developments, trends, and reports in the Mobile Analytics Software Industry, consider subscribing to industry newsletters, following relevant companies and organizations, or regularly checking reputable industry news sources and publications.
Methodology
Step 1 - Identification of Relevant Samples Size from Population Database


Step 2 - Approaches for Defining Global Market Size (Value, Volume* & Price*)

Note*: In applicable scenarios
Step 3 - Data Sources
Primary Research
- Web Analytics
- Survey Reports
- Research Institute
- Latest Research Reports
- Opinion Leaders
Secondary Research
- Annual Reports
- White Paper
- Latest Press Release
- Industry Association
- Paid Database
- Investor Presentations

Step 4 - Data Triangulation
Involves using different sources of information in order to increase the validity of a study
These sources are likely to be stakeholders in a program - participants, other researchers, program staff, other community members, and so on.
Then we put all data in single framework & apply various statistical tools to find out the dynamic on the market.
During the analysis stage, feedback from the stakeholder groups would be compared to determine areas of agreement as well as areas of divergence


