
Key Insights
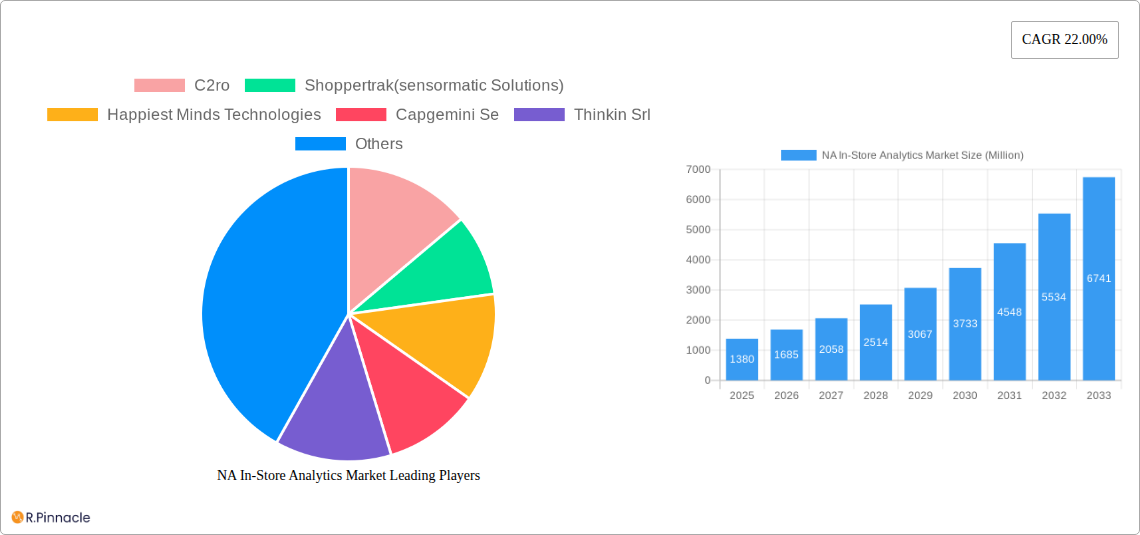
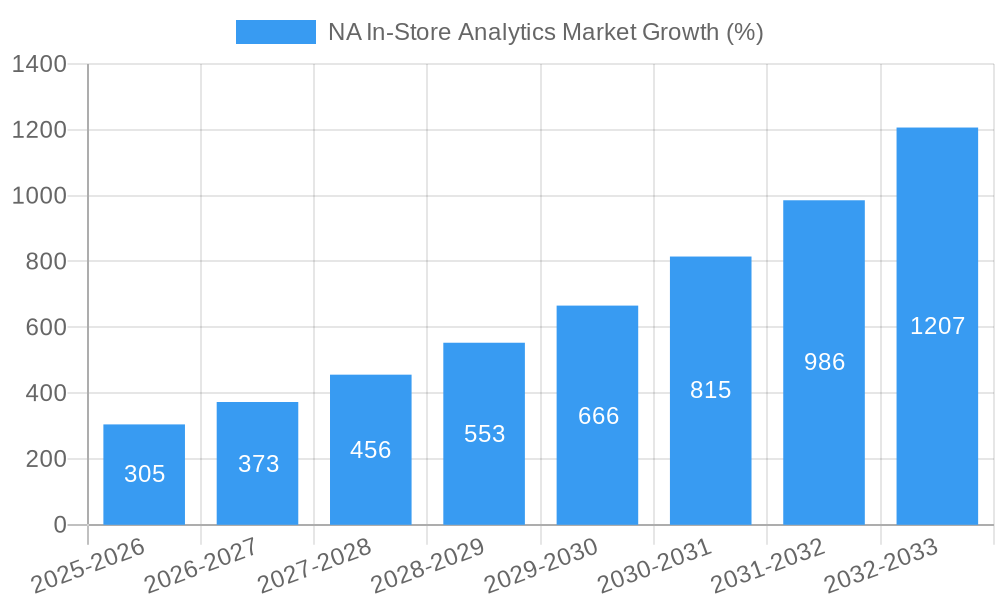
The North American (NA) in-store analytics market, valued at $1.38 billion in 2025, is experiencing robust growth, projected to expand at a Compound Annual Growth Rate (CAGR) of 22% from 2025 to 2033. This surge is driven by the increasing adoption of advanced technologies like computer vision, artificial intelligence (AI), and the Internet of Things (IoT) to gather and analyze real-time customer behavior data. Retailers are leveraging these insights to optimize store layouts, personalize the shopping experience, enhance marketing campaigns, and improve operational efficiency. The cloud-based deployment model is gaining traction due to its scalability, cost-effectiveness, and accessibility, further fueling market expansion. Large enterprises are leading the adoption, but the growing need for data-driven decision-making among SMEs is also contributing to market growth. Key application areas include customer management (understanding shopping patterns, preferences, and demographics), risk and compliance management (loss prevention, fraud detection), store operation management (optimizing staffing and inventory), and marketing and merchandising (targeted promotions and product placement).
The market's growth trajectory is also influenced by evolving consumer expectations and the increasing competition within the retail sector. Retailers are under pressure to provide seamless and personalized omnichannel experiences, and in-store analytics offer a crucial tool for achieving this. However, challenges such as data privacy concerns, the complexity of integrating different data sources, and the high initial investment costs for implementing advanced analytics solutions pose potential restraints. Despite these challenges, the overall market outlook remains positive, with significant opportunities for growth in the coming years. The continued development of more sophisticated analytics tools and the increasing availability of affordable solutions are expected to drive further market penetration across various retail segments and geographies within North America.
North American In-Store Analytics Market Report: 2019-2033
This comprehensive report provides a detailed analysis of the North American (NA) In-Store Analytics market, offering invaluable insights for industry professionals, investors, and strategic decision-makers. The report covers the period 2019-2033, with a focus on the estimated year 2025 and a forecast period of 2025-2033. The market size is projected to reach xx Million by 2033, exhibiting substantial growth potential. This in-depth study delves into market structure, dynamics, leading segments, key players, and future trends, equipping readers with actionable intelligence to navigate this rapidly evolving landscape.
NA In-Store Analytics Market Market Structure & Innovation Trends
The NA In-Store Analytics market exhibits a moderately concentrated structure, with several key players commanding significant market share. Companies like SAP SE, Trax Image Recognition, and C2ro hold substantial positions, while several other companies, including Shoppertrak (sensormatic Solutions), Happiest Minds Technologies, Capgemini SE, Thinkin Srl, Retailnext Inc, Cisco Meraki (Cisco Systems Inc), Cloud4wi Inc, Capillary Technologies, Amoobi, and Analytiks AI, contribute significantly. Market share distribution is dynamic, with ongoing M&A activities reshaping the competitive landscape. Recent M&A deal values in this sector have averaged around xx Million, indicating strong consolidation trends.
Innovation is driven by advancements in AI, machine learning, computer vision, and cloud computing, enabling more sophisticated data analysis and real-time insights. Regulatory frameworks, particularly concerning data privacy (e.g., CCPA, GDPR implications), are shaping the market's trajectory. Product substitutes, such as traditional market research methods, are facing increasing pressure from the cost-effectiveness and enhanced accuracy of in-store analytics. The end-user demographic is expanding to encompass small and medium-sized enterprises (SMEs) alongside large enterprises, driven by the decreasing cost of adoption and accessibility of cloud-based solutions.
NA In-Store Analytics Market Market Dynamics & Trends
The NA In-Store Analytics market is experiencing robust growth, driven primarily by the rising adoption of digital technologies in retail, the need for enhanced customer experience personalization, and the increasing demand for data-driven decision-making. The market's CAGR during the forecast period is estimated to be xx%, exceeding the global average. Market penetration is growing significantly, particularly amongst large enterprises leveraging the scalability and efficiency of cloud-based solutions. Technological disruptions, such as the integration of IoT devices and advanced analytics platforms, are accelerating market transformation. Consumer preferences for personalized shopping experiences are shaping the demand for solutions that provide granular insights into customer behavior within physical stores. Intense competitive dynamics are characterized by ongoing innovation, strategic partnerships, and expansion into new geographical markets.
Dominant Regions & Segments in NA In-Store Analytics Market
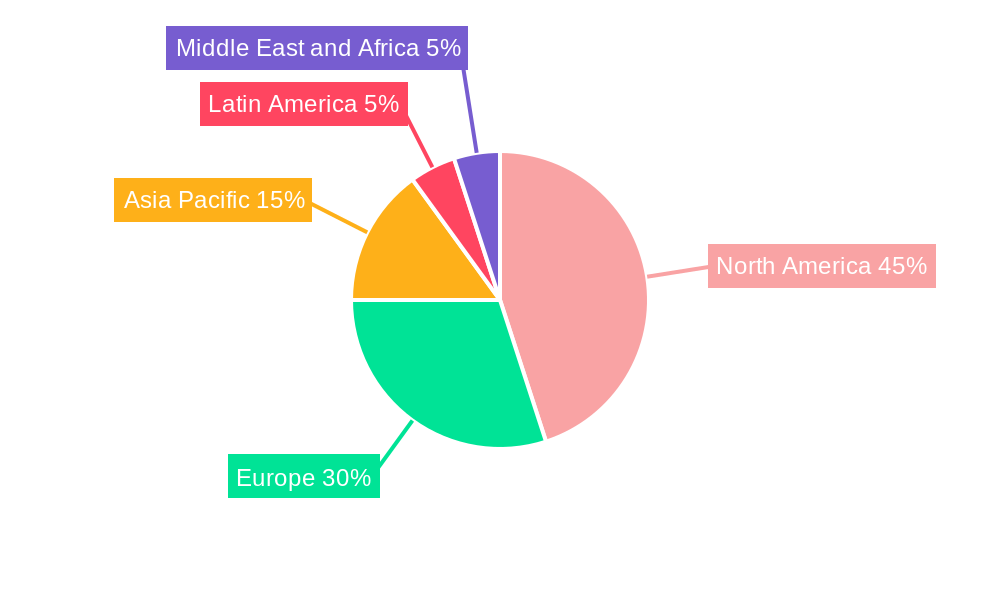
The United States dominates the NA In-Store Analytics market, driven by higher adoption rates among large retailers, advanced technological infrastructure, and a robust economy. Canada also shows substantial growth potential.
- By Component: The software segment holds a larger market share due to the increasing demand for sophisticated analytics platforms and applications.
- By Deployment: Cloud-based deployments are experiencing faster growth compared to on-premise solutions due to their scalability, cost-effectiveness, and accessibility.
- By Organization Size: Large enterprises are the primary adopters, driven by their larger budgets and higher need for comprehensive analytics solutions. However, SME adoption is rapidly increasing.
- By Application: Customer management and store operations management are the leading applications, while marketing and merchandising are gaining traction.
- Key Drivers:
- United States: Strong economic conditions, high technological adoption, and a well-developed retail sector.
- Canada: Growing retail sector, increased investment in digital technologies, and government initiatives promoting digital transformation.
NA In-Store Analytics Market Product Innovations
Recent product innovations are characterized by increased integration of AI, machine learning, and computer vision into analytics platforms. These advancements provide retailers with more accurate and timely insights into customer behavior, inventory levels, and operational efficiency. New applications focus on personalized recommendations, optimized shelf placement, and real-time performance monitoring. Competitive advantages are determined by the accuracy, efficiency, and user-friendliness of the platforms, alongside data security and compliance capabilities.
Report Scope & Segmentation Analysis
This report provides a comprehensive analysis of the NA In-Store Analytics market, segmented by component (software, services), deployment (cloud, on-premise), organization size (large enterprises, SMEs), application (customer management, risk and compliance management, store operation management, marketing and merchandising, other applications), and country (United States, Canada). Each segment's growth projection, market size, and competitive dynamics are thoroughly analyzed, providing granular insights into the market's structure and future trends. For example, the cloud deployment segment is anticipated to experience a faster growth rate compared to the on-premise segment, driven by the increasing demand for scalability, flexibility, and cost-effectiveness.
Key Drivers of NA In-Store Analytics Market Growth
The NA In-Store Analytics market is propelled by several key factors, including the increasing adoption of digital technologies in retail, the growing demand for personalized shopping experiences, the need for optimized store operations, and the escalating pressure to enhance customer satisfaction. Advancements in AI and machine learning are significantly contributing to the development of more sophisticated analytics solutions, further fueling market growth. Government regulations encouraging data-driven decision-making also play a supportive role.
Challenges in the NA In-Store Analytics Market Sector
Challenges include high initial investment costs for implementing sophisticated analytics systems, concerns about data security and privacy, the complexity of integrating various data sources, and the need for skilled personnel to manage and interpret the collected data. Competition from established players and emerging startups presents a significant challenge. The impact of these challenges on market growth is estimated to be around xx% annually, highlighting the need for strategic solutions.
Emerging Opportunities in NA In-Store Analytics Market
Emerging opportunities include the integration of IoT devices to collect real-time data, the application of augmented reality and virtual reality technologies to enhance the customer experience, and the use of predictive analytics to optimize inventory management and improve forecasting accuracy. Expanding into new market segments, such as smaller retailers and emerging economies, represents a significant opportunity for growth.
Leading Players in the NA In-Store Analytics Market Market
- C2ro
- Shoppertrak (sensormatic Solutions)
- Happiest Minds Technologies
- Capgemini SE
- Thinkin Srl
- Retailnext Inc
- Cisco Meraki (Cisco Systems Inc)
- Cloud4wi Inc
- Capillary Technologies
- Amoobi
- Analytiks AI
- SAP SE
- Trax Image Recognition
Key Developments in NA In-Store Analytics Market Industry
July 2023: Acosta and Pensa Systems partnered to enhance retail shelf visibility and provide strategic business insights for CPG retailers and brands, integrating Pensa's shelf intelligence into Acosta's analytics solutions. This partnership significantly impacts market dynamics by strengthening the provision of in-store data and business intelligence services.
January 2023: Google Cloud launched four AI technologies designed to automate in-store inventory checks and enhance e-commerce experiences for retailers. This initiative accelerates market adoption of AI-powered solutions for shelf management and customer experience optimization.
Future Outlook for NA In-Store Analytics Market Market
The future of the NA In-Store Analytics market is promising, driven by continuous technological advancements and the growing importance of data-driven decision-making in retail. The market is poised for significant growth, with increased adoption of cloud-based solutions, expansion into new applications, and the emergence of innovative technologies such as AI and IoT expected to be key drivers. Strategic partnerships and M&A activities will continue to shape the competitive landscape.
NA In-Store Analytics Market Segmentation
-
1. Component
- 1.1. Software
- 1.2. Services
-
2. Deployment
- 2.1. Cloud
- 2.2. On-premise
-
3. Organization Size
- 3.1. Large Enterprises
- 3.2. Small and Medium Enterprises
-
4. Application
- 4.1. Customer Management
- 4.2. Risk and Compliance Management
- 4.3. Store Operation Management
- 4.4. Marketing and Merchandizing
- 4.5. Other Applications
NA In-Store Analytics Market Segmentation By Geography
-
1. North America
- 1.1. United States
- 1.2. Canada
- 1.3. Mexico
NA In-Store Analytics Market REPORT HIGHLIGHTS
| Aspects | Details |
|---|---|
| Study Period | 2019-2033 |
| Base Year | 2024 |
| Estimated Year | 2025 |
| Forecast Period | 2025-2033 |
| Historical Period | 2019-2024 |
| Growth Rate | CAGR of 22.00% from 2019-2033 |
| Segmentation |
|
Table of Contents
- 1. Introduction
- 1.1. Research Scope
- 1.2. Market Segmentation
- 1.3. Research Methodology
- 1.4. Definitions and Assumptions
- 2. Executive Summary
- 2.1. Introduction
- 3. Market Dynamics
- 3.1. Introduction
- 3.2. Market Drivers
- 3.2.1. Increasing Data Volume In In-store Operations; Need For Better Customer Service And Enhanced Shopping Experience
- 3.3. Market Restrains
- 3.3.1. Lack of Personnel Skills
- 3.4. Market Trends
- 3.4.1. Store Operation Management to Exhibit Good Growth Over the Forecast Period
- 4. Market Factor Analysis
- 4.1. Porters Five Forces
- 4.2. Supply/Value Chain
- 4.3. PESTEL analysis
- 4.4. Market Entropy
- 4.5. Patent/Trademark Analysis
- 5. NA In-Store Analytics Market Analysis, Insights and Forecast, 2019-2031
- 5.1. Market Analysis, Insights and Forecast - by Component
- 5.1.1. Software
- 5.1.2. Services
- 5.2. Market Analysis, Insights and Forecast - by Deployment
- 5.2.1. Cloud
- 5.2.2. On-premise
- 5.3. Market Analysis, Insights and Forecast - by Organization Size
- 5.3.1. Large Enterprises
- 5.3.2. Small and Medium Enterprises
- 5.4. Market Analysis, Insights and Forecast - by Application
- 5.4.1. Customer Management
- 5.4.2. Risk and Compliance Management
- 5.4.3. Store Operation Management
- 5.4.4. Marketing and Merchandizing
- 5.4.5. Other Applications
- 5.5. Market Analysis, Insights and Forecast - by Region
- 5.5.1. North America
- 5.1. Market Analysis, Insights and Forecast - by Component
- 6. North America NA In-Store Analytics Market Analysis, Insights and Forecast, 2019-2031
- 6.1. Market Analysis, Insights and Forecast - By Country/Sub-region
- 6.1.1.
- 7. Europe NA In-Store Analytics Market Analysis, Insights and Forecast, 2019-2031
- 7.1. Market Analysis, Insights and Forecast - By Country/Sub-region
- 7.1.1.
- 8. Asia Pacific NA In-Store Analytics Market Analysis, Insights and Forecast, 2019-2031
- 8.1. Market Analysis, Insights and Forecast - By Country/Sub-region
- 8.1.1.
- 9. Latin America NA In-Store Analytics Market Analysis, Insights and Forecast, 2019-2031
- 9.1. Market Analysis, Insights and Forecast - By Country/Sub-region
- 9.1.1.
- 10. Middle East and Africa NA In-Store Analytics Market Analysis, Insights and Forecast, 2019-2031
- 10.1. Market Analysis, Insights and Forecast - By Country/Sub-region
- 10.1.1.
- 11. Competitive Analysis
- 11.1. Market Share Analysis 2024
- 11.2. Company Profiles
- 11.2.1 C2ro
- 11.2.1.1. Overview
- 11.2.1.2. Products
- 11.2.1.3. SWOT Analysis
- 11.2.1.4. Recent Developments
- 11.2.1.5. Financials (Based on Availability)
- 11.2.2 Shoppertrak(sensormatic Solutions)
- 11.2.2.1. Overview
- 11.2.2.2. Products
- 11.2.2.3. SWOT Analysis
- 11.2.2.4. Recent Developments
- 11.2.2.5. Financials (Based on Availability)
- 11.2.3 Happiest Minds Technologies
- 11.2.3.1. Overview
- 11.2.3.2. Products
- 11.2.3.3. SWOT Analysis
- 11.2.3.4. Recent Developments
- 11.2.3.5. Financials (Based on Availability)
- 11.2.4 Capgemini Se
- 11.2.4.1. Overview
- 11.2.4.2. Products
- 11.2.4.3. SWOT Analysis
- 11.2.4.4. Recent Developments
- 11.2.4.5. Financials (Based on Availability)
- 11.2.5 Thinkin Srl
- 11.2.5.1. Overview
- 11.2.5.2. Products
- 11.2.5.3. SWOT Analysis
- 11.2.5.4. Recent Developments
- 11.2.5.5. Financials (Based on Availability)
- 11.2.6 Retailnext Inc
- 11.2.6.1. Overview
- 11.2.6.2. Products
- 11.2.6.3. SWOT Analysis
- 11.2.6.4. Recent Developments
- 11.2.6.5. Financials (Based on Availability)
- 11.2.7 Cisco Meraki (Cisco Systems Inc )
- 11.2.7.1. Overview
- 11.2.7.2. Products
- 11.2.7.3. SWOT Analysis
- 11.2.7.4. Recent Developments
- 11.2.7.5. Financials (Based on Availability)
- 11.2.8 Cloud4wi Inc
- 11.2.8.1. Overview
- 11.2.8.2. Products
- 11.2.8.3. SWOT Analysis
- 11.2.8.4. Recent Developments
- 11.2.8.5. Financials (Based on Availability)
- 11.2.9 Capillary Technologies
- 11.2.9.1. Overview
- 11.2.9.2. Products
- 11.2.9.3. SWOT Analysis
- 11.2.9.4. Recent Developments
- 11.2.9.5. Financials (Based on Availability)
- 11.2.10 Amoobi
- 11.2.10.1. Overview
- 11.2.10.2. Products
- 11.2.10.3. SWOT Analysis
- 11.2.10.4. Recent Developments
- 11.2.10.5. Financials (Based on Availability)
- 11.2.11 Analytiks AI
- 11.2.11.1. Overview
- 11.2.11.2. Products
- 11.2.11.3. SWOT Analysis
- 11.2.11.4. Recent Developments
- 11.2.11.5. Financials (Based on Availability)
- 11.2.12 SAP SE
- 11.2.12.1. Overview
- 11.2.12.2. Products
- 11.2.12.3. SWOT Analysis
- 11.2.12.4. Recent Developments
- 11.2.12.5. Financials (Based on Availability)
- 11.2.13 Trax Image Recognition
- 11.2.13.1. Overview
- 11.2.13.2. Products
- 11.2.13.3. SWOT Analysis
- 11.2.13.4. Recent Developments
- 11.2.13.5. Financials (Based on Availability)
- 11.2.1 C2ro
List of Figures
- Figure 1: NA In-Store Analytics Market Revenue Breakdown (Million, %) by Product 2024 & 2032
- Figure 2: NA In-Store Analytics Market Share (%) by Company 2024
List of Tables
- Table 1: NA In-Store Analytics Market Revenue Million Forecast, by Region 2019 & 2032
- Table 2: NA In-Store Analytics Market Volume K Unit Forecast, by Region 2019 & 2032
- Table 3: NA In-Store Analytics Market Revenue Million Forecast, by Component 2019 & 2032
- Table 4: NA In-Store Analytics Market Volume K Unit Forecast, by Component 2019 & 2032
- Table 5: NA In-Store Analytics Market Revenue Million Forecast, by Deployment 2019 & 2032
- Table 6: NA In-Store Analytics Market Volume K Unit Forecast, by Deployment 2019 & 2032
- Table 7: NA In-Store Analytics Market Revenue Million Forecast, by Organization Size 2019 & 2032
- Table 8: NA In-Store Analytics Market Volume K Unit Forecast, by Organization Size 2019 & 2032
- Table 9: NA In-Store Analytics Market Revenue Million Forecast, by Application 2019 & 2032
- Table 10: NA In-Store Analytics Market Volume K Unit Forecast, by Application 2019 & 2032
- Table 11: NA In-Store Analytics Market Revenue Million Forecast, by Region 2019 & 2032
- Table 12: NA In-Store Analytics Market Volume K Unit Forecast, by Region 2019 & 2032
- Table 13: NA In-Store Analytics Market Revenue Million Forecast, by Country 2019 & 2032
- Table 14: NA In-Store Analytics Market Volume K Unit Forecast, by Country 2019 & 2032
- Table 15: NA In-Store Analytics Market Revenue (Million) Forecast, by Application 2019 & 2032
- Table 16: NA In-Store Analytics Market Volume (K Unit) Forecast, by Application 2019 & 2032
- Table 17: NA In-Store Analytics Market Revenue Million Forecast, by Country 2019 & 2032
- Table 18: NA In-Store Analytics Market Volume K Unit Forecast, by Country 2019 & 2032
- Table 19: NA In-Store Analytics Market Revenue (Million) Forecast, by Application 2019 & 2032
- Table 20: NA In-Store Analytics Market Volume (K Unit) Forecast, by Application 2019 & 2032
- Table 21: NA In-Store Analytics Market Revenue Million Forecast, by Country 2019 & 2032
- Table 22: NA In-Store Analytics Market Volume K Unit Forecast, by Country 2019 & 2032
- Table 23: NA In-Store Analytics Market Revenue (Million) Forecast, by Application 2019 & 2032
- Table 24: NA In-Store Analytics Market Volume (K Unit) Forecast, by Application 2019 & 2032
- Table 25: NA In-Store Analytics Market Revenue Million Forecast, by Country 2019 & 2032
- Table 26: NA In-Store Analytics Market Volume K Unit Forecast, by Country 2019 & 2032
- Table 27: NA In-Store Analytics Market Revenue (Million) Forecast, by Application 2019 & 2032
- Table 28: NA In-Store Analytics Market Volume (K Unit) Forecast, by Application 2019 & 2032
- Table 29: NA In-Store Analytics Market Revenue Million Forecast, by Country 2019 & 2032
- Table 30: NA In-Store Analytics Market Volume K Unit Forecast, by Country 2019 & 2032
- Table 31: NA In-Store Analytics Market Revenue (Million) Forecast, by Application 2019 & 2032
- Table 32: NA In-Store Analytics Market Volume (K Unit) Forecast, by Application 2019 & 2032
- Table 33: NA In-Store Analytics Market Revenue Million Forecast, by Component 2019 & 2032
- Table 34: NA In-Store Analytics Market Volume K Unit Forecast, by Component 2019 & 2032
- Table 35: NA In-Store Analytics Market Revenue Million Forecast, by Deployment 2019 & 2032
- Table 36: NA In-Store Analytics Market Volume K Unit Forecast, by Deployment 2019 & 2032
- Table 37: NA In-Store Analytics Market Revenue Million Forecast, by Organization Size 2019 & 2032
- Table 38: NA In-Store Analytics Market Volume K Unit Forecast, by Organization Size 2019 & 2032
- Table 39: NA In-Store Analytics Market Revenue Million Forecast, by Application 2019 & 2032
- Table 40: NA In-Store Analytics Market Volume K Unit Forecast, by Application 2019 & 2032
- Table 41: NA In-Store Analytics Market Revenue Million Forecast, by Country 2019 & 2032
- Table 42: NA In-Store Analytics Market Volume K Unit Forecast, by Country 2019 & 2032
- Table 43: United States NA In-Store Analytics Market Revenue (Million) Forecast, by Application 2019 & 2032
- Table 44: United States NA In-Store Analytics Market Volume (K Unit) Forecast, by Application 2019 & 2032
- Table 45: Canada NA In-Store Analytics Market Revenue (Million) Forecast, by Application 2019 & 2032
- Table 46: Canada NA In-Store Analytics Market Volume (K Unit) Forecast, by Application 2019 & 2032
- Table 47: Mexico NA In-Store Analytics Market Revenue (Million) Forecast, by Application 2019 & 2032
- Table 48: Mexico NA In-Store Analytics Market Volume (K Unit) Forecast, by Application 2019 & 2032
Frequently Asked Questions
1. What is the projected Compound Annual Growth Rate (CAGR) of the NA In-Store Analytics Market?
The projected CAGR is approximately 22.00%.
2. Which companies are prominent players in the NA In-Store Analytics Market?
Key companies in the market include C2ro, Shoppertrak(sensormatic Solutions), Happiest Minds Technologies, Capgemini Se, Thinkin Srl, Retailnext Inc, Cisco Meraki (Cisco Systems Inc ), Cloud4wi Inc, Capillary Technologies, Amoobi, Analytiks AI, SAP SE, Trax Image Recognition.
3. What are the main segments of the NA In-Store Analytics Market?
The market segments include Component, Deployment, Organization Size, Application.
4. Can you provide details about the market size?
The market size is estimated to be USD 1.38 Million as of 2022.
5. What are some drivers contributing to market growth?
Increasing Data Volume In In-store Operations; Need For Better Customer Service And Enhanced Shopping Experience.
6. What are the notable trends driving market growth?
Store Operation Management to Exhibit Good Growth Over the Forecast Period.
7. Are there any restraints impacting market growth?
Lack of Personnel Skills.
8. Can you provide examples of recent developments in the market?
July 2023 - Acosta, an Acosta Group agency and a provider of commerce-centric solutions for the modern marketplace to retailers, brands, and foodservice providers, and Pensa Systems, a provider of digital retail shelf inventory management solutions, have partnered to boost revenue growth for CPG retailers and brands with highly accurate retail shelf visibility, strategic business insights as well as in-store execution. The shelf intelligence of the Pensa brand is being integrated into this new partnership by Acosta's analytics, in-store data collection, business intelligence, and merchandising solutions for all retailers on the market.
9. What pricing options are available for accessing the report?
Pricing options include single-user, multi-user, and enterprise licenses priced at USD 4750, USD 4950, and USD 6800 respectively.
10. Is the market size provided in terms of value or volume?
The market size is provided in terms of value, measured in Million and volume, measured in K Unit.
11. Are there any specific market keywords associated with the report?
Yes, the market keyword associated with the report is "NA In-Store Analytics Market," which aids in identifying and referencing the specific market segment covered.
12. How do I determine which pricing option suits my needs best?
The pricing options vary based on user requirements and access needs. Individual users may opt for single-user licenses, while businesses requiring broader access may choose multi-user or enterprise licenses for cost-effective access to the report.
13. Are there any additional resources or data provided in the NA In-Store Analytics Market report?
While the report offers comprehensive insights, it's advisable to review the specific contents or supplementary materials provided to ascertain if additional resources or data are available.
14. How can I stay updated on further developments or reports in the NA In-Store Analytics Market?
To stay informed about further developments, trends, and reports in the NA In-Store Analytics Market, consider subscribing to industry newsletters, following relevant companies and organizations, or regularly checking reputable industry news sources and publications.
Methodology
Step 1 - Identification of Relevant Samples Size from Population Database


Step 2 - Approaches for Defining Global Market Size (Value, Volume* & Price*)

Note*: In applicable scenarios
Step 3 - Data Sources
Primary Research
- Web Analytics
- Survey Reports
- Research Institute
- Latest Research Reports
- Opinion Leaders
Secondary Research
- Annual Reports
- White Paper
- Latest Press Release
- Industry Association
- Paid Database
- Investor Presentations

Step 4 - Data Triangulation
Involves using different sources of information in order to increase the validity of a study
These sources are likely to be stakeholders in a program - participants, other researchers, program staff, other community members, and so on.
Then we put all data in single framework & apply various statistical tools to find out the dynamic on the market.
During the analysis stage, feedback from the stakeholder groups would be compared to determine areas of agreement as well as areas of divergence


