
Key Insights
The natural stone flooring market, valued at $11.58 billion in 2025, is projected to experience steady growth, exhibiting a compound annual growth rate (CAGR) of 4.16% from 2025 to 2033. This growth is fueled by several key drivers. The increasing preference for sustainable and eco-friendly building materials positions natural stone favorably against synthetic alternatives. Furthermore, the inherent durability and aesthetic appeal of natural stone, including its unique patterns and textures, continue to drive demand in both residential and commercial construction projects. Design trends showcasing natural materials in interior design also contribute significantly to market expansion. While the market faces certain restraints, such as high initial costs compared to other flooring options and potential difficulties in maintenance and installation, the overall positive perception and growing awareness of natural stone's longevity offset these limitations. The market is segmented by product type (slate, other products), application (residential, commercial), and end-user (cut-to-size, other). North America and Europe currently represent significant market shares, driven by high disposable income and established construction sectors. However, rapid urbanization and rising disposable incomes in regions like Asia-Pacific are expected to fuel considerable growth in these markets over the forecast period. Key players like Arcat, Stone Source, and Emser Tile are actively shaping the market through product innovation and strategic expansion.
The market's segmentation allows for targeted marketing strategies. For instance, focusing on sustainable building practices within the “other products” segment could attract environmentally conscious consumers. Simultaneously, highlighting the luxurious appeal and durability of slate products can capture a premium segment of the market. Regional variations in preferences and building codes necessitate tailored approaches. North American and European markets may benefit from emphasizing established brand recognition and superior quality. Conversely, focusing on affordability and efficient installation techniques could enhance penetration in rapidly developing Asian markets. Continuous innovation in cutting-edge designs and the development of improved installation methods will be key for industry players to maintain competitiveness and maximize market share in the coming years. Overall, the natural stone flooring market demonstrates a robust and promising outlook driven by a confluence of positive market dynamics.

Natural Stone Flooring Industry Report: 2019-2033
This comprehensive report provides a detailed analysis of the Natural Stone Flooring industry, offering invaluable insights for industry professionals, investors, and strategic decision-makers. With a study period spanning 2019-2033, a base year of 2025, and a forecast period of 2025-2033, this report delivers a comprehensive overview of market dynamics, growth drivers, and future trends. The report covers a market valued at $XX Million in 2025, projecting significant growth throughout the forecast period.
Natural Stone Flooring Industry Market Structure & Innovation Trends
The natural stone flooring market presents a moderately concentrated structure, dominated by key players such as Arcat, Stone Source, OWSI Flooring & Design, Farmington, Emser Tile, Templeton Floor Company, Universal Marble & Granite Group Ltd, BC Stone, and Island Stone. While precise market share data remains proprietary, analysis indicates a diverse distribution among these major players. Innovation within the industry is fueled by several key factors: a surging demand for sustainable and ethically sourced materials, continuous advancements in cutting-edge stone processing and finishing techniques, and the creation of innovative and aesthetically appealing product designs. Furthermore, evolving regulatory frameworks addressing environmental impact and worker safety significantly influence manufacturing practices and operational strategies. The market faces considerable competition from alternative flooring materials, including engineered wood and vinyl, necessitating continuous innovation and adaptation. The end-user demographic is broad, encompassing residential, commercial, and industrial sectors, with a notable and growing preference for luxury and high-end flooring solutions. Mergers and acquisitions (M&A) activity has shown moderate but significant growth, exemplified by Paramount Global Surfaces' acquisition of Stone Source in April 2022 (transaction value undisclosed), signaling consolidation and expansion within the market.
Natural Stone Flooring Industry Market Dynamics & Trends
The natural stone flooring market is experiencing robust growth, propelled by several key factors: rising disposable incomes in developing economies, rapid urbanization leading to increased construction activity, and a consistent preference for aesthetically pleasing and highly durable flooring solutions. The Compound Annual Growth Rate (CAGR) is projected at XX% during the forecast period (2025-2033). Technological advancements in stone processing and installation methods are enhancing efficiency, reducing costs, and improving overall product quality. A significant shift in consumer preferences is evident, favoring sustainable and ethically sourced materials, driving manufacturers to adopt responsible sourcing practices. Intense competition among industry players fosters innovation and exerts downward pressure on prices, benefiting consumers. The significant market penetration opportunity in emerging economies presents a considerable avenue for future growth. However, the market faces challenges such as fluctuations in raw material costs and potential supply chain disruptions, compounded by increasing awareness and scrutiny of the environmental and social impacts associated with stone extraction.
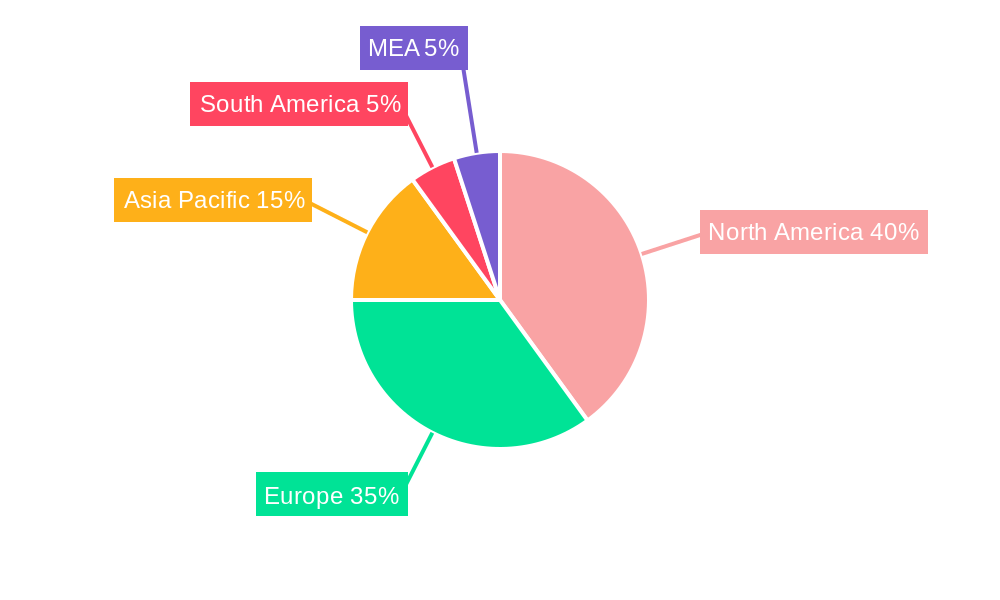
Dominant Regions & Segments in Natural Stone Flooring Industry
While precise regional dominance data isn't available, the market is likely dominated by regions with strong construction activity, high disposable income, and established infrastructure for the natural stone industry. Analysis suggests that North America and Europe are currently strong markets, followed by Asia-Pacific.
Key Drivers:
- Robust construction activity.
- Growing disposable income.
- Government incentives for sustainable materials.
- Favorable economic policies.
Segment Dominance: Among the segments, "Cut-to-size" applications, particularly in commercial end-user sectors, are expected to be the most dominant due to the need for precision and customized sizes in large-scale projects. Within the "By Product" segment, slate is a popular choice due to its durability and aesthetic appeal. The "Other Products: By Application" segment is also a significant portion of the market, including decorative stone elements and other applications beyond flooring. The precise market share of each segment requires further research.
Natural Stone Flooring Industry Product Innovations
Recent innovations include advancements in cutting and finishing techniques, resulting in improved precision, surface finishes, and reduced waste. The use of sustainable extraction practices and environmentally friendly sealants is gaining traction. Companies are focusing on developing unique designs and colors to cater to evolving consumer preferences. The industry is adapting to digital technologies, using advanced machinery, improving designs and reducing manufacturing costs.
Report Scope & Segmentation Analysis
This report comprehensively segments the natural stone flooring market across various parameters:
By Product: Slate, Marble, Granite, Limestone, Travertine, etc. (Market size for each segment will be detailed within the full report.) Cut-to-size: By End-User (Residential, Commercial, Industrial) (Market size and growth projections will be included in the full report.) Other Products: By Application: Wall cladding, countertops, decorative elements, etc. (Growth projections and competitive dynamics will be analyzed in the full report).
Each segment’s growth trajectory, market size, and competitive landscape will be thoroughly analyzed in the full report.
Key Drivers of Natural Stone Flooring Industry Growth
Several key factors are driving the growth of the natural stone flooring industry: rising disposable incomes and increased construction activity, especially in developing economies; a consistent and growing demand for aesthetically pleasing and exceptionally durable flooring options; a pronounced increase in preference for sustainable and eco-friendly building materials; significant technological advancements in stone processing and installation techniques, leading to improved efficiency and reduced costs; and supportive government initiatives promoting sustainable building practices and environmentally responsible construction materials. Furthermore, the sustained growth of the hospitality sector and the robust renovation/remodeling markets contribute significantly to industry expansion.
Challenges in the Natural Stone Flooring Industry Sector
The natural stone flooring industry faces a number of significant challenges including: price volatility of raw materials and the potential for supply chain disruptions; intense competition from alternative and increasingly innovative flooring materials; growing environmental concerns related to the extraction and processing of natural stone; and stringent regulatory compliance requirements, impacting both manufacturing processes and operational costs. These factors collectively influence profitability and can potentially limit market expansion. A detailed quantitative analysis of these impacts will be provided in the complete report.
Emerging Opportunities in Natural Stone Flooring Industry
Emerging opportunities include: expanding into new markets with growing construction activity, adoption of digital technologies to enhance efficiency and reduce costs, development of sustainable extraction and processing methods, and increased focus on product design and customization. The increased demand for bespoke and high-end stone flooring is creating high-growth potential.
Leading Players in the Natural Stone Flooring Industry Market
- Arcat
- Stone Source
- OWSI Flooring & Design
- Farmington
- Emser Tile
- Templeton Floor Company
- Universal Marble & Granite Group Ltd
- BC Stone
- Island Stone (List Not Exhaustive)
Key Developments in Natural Stone Flooring Industry
- December 2022: Emser Tile expanded its product portfolio and strengthened its market position with the launch of four new glazed porcelain and ceramic tile collections: Tubage, Boxwood, Fragmento, and Estasi. This strategic move demonstrates a commitment to product diversification and innovation within the broader tile market.
- April 2022: Paramount Global Surfaces' acquisition of Stone Source represents a significant strategic move, expanding their market reach and significantly broadening their product offerings within the natural stone and tile sectors. This consolidation underscores the ongoing trend of mergers and acquisitions in the industry.
Future Outlook for Natural Stone Flooring Industry Market
The natural stone flooring industry is poised for continued growth driven by factors mentioned previously. Strategic opportunities lie in expanding into emerging markets, investing in sustainable practices, and leveraging technology to enhance efficiency and product design. The focus on high-end, customized solutions and increasing interest in eco-friendly options will shape the future of the industry.
Natural Stone Flooring Industry Segmentation
- 1. Production Analysis
- 2. Consumption Analysis
- 3. Import Market Analysis (Value & Volume)
- 4. Export Market Analysis (Value & Volume)
- 5. Price Trend Analysis
Natural Stone Flooring Industry Segmentation By Geography
-
1. North America
- 1.1. United States
- 1.2. Canada
- 1.3. Mexico
-
2. South America
- 2.1. Brazil
- 2.2. Argentina
- 2.3. Rest of South America
-
3. Europe
- 3.1. United Kingdom
- 3.2. Germany
- 3.3. France
- 3.4. Italy
- 3.5. Spain
- 3.6. Russia
- 3.7. Benelux
- 3.8. Nordics
- 3.9. Rest of Europe
-
4. Middle East & Africa
- 4.1. Turkey
- 4.2. Israel
- 4.3. GCC
- 4.4. North Africa
- 4.5. South Africa
- 4.6. Rest of Middle East & Africa
-
5. Asia Pacific
- 5.1. China
- 5.2. India
- 5.3. Japan
- 5.4. South Korea
- 5.5. ASEAN
- 5.6. Oceania
- 5.7. Rest of Asia Pacific
Natural Stone Flooring Industry REPORT HIGHLIGHTS
| Aspects | Details |
|---|---|
| Study Period | 2019-2033 |
| Base Year | 2024 |
| Estimated Year | 2025 |
| Forecast Period | 2025-2033 |
| Historical Period | 2019-2024 |
| Growth Rate | CAGR of 4.16% from 2019-2033 |
| Segmentation |
|
Table of Contents
- 1. Introduction
- 1.1. Research Scope
- 1.2. Market Segmentation
- 1.3. Research Methodology
- 1.4. Definitions and Assumptions
- 2. Executive Summary
- 2.1. Introduction
- 3. Market Dynamics
- 3.1. Introduction
- 3.2. Market Drivers
- 3.2.1. Increased Demand for Aesthetically Appealing Products to Fuel the Growth of the Stone Flooring Market; Demand for Stone Floors as a Decorative Tool in the Construction Industry
- 3.3. Market Restrains
- 3.3.1. High Initial Cost; Lack of Skilled Labor
- 3.4. Market Trends
- 3.4.1. Rapid Urbanization and Increasing Disposable Income Leads to Growth of the Construction Activities
- 4. Market Factor Analysis
- 4.1. Porters Five Forces
- 4.2. Supply/Value Chain
- 4.3. PESTEL analysis
- 4.4. Market Entropy
- 4.5. Patent/Trademark Analysis
- 5. Global Natural Stone Flooring Industry Analysis, Insights and Forecast, 2019-2031
- 5.1. Market Analysis, Insights and Forecast - by Production Analysis
- 5.2. Market Analysis, Insights and Forecast - by Consumption Analysis
- 5.3. Market Analysis, Insights and Forecast - by Import Market Analysis (Value & Volume)
- 5.4. Market Analysis, Insights and Forecast - by Export Market Analysis (Value & Volume)
- 5.5. Market Analysis, Insights and Forecast - by Price Trend Analysis
- 5.6. Market Analysis, Insights and Forecast - by Region
- 5.6.1. North America
- 5.6.2. South America
- 5.6.3. Europe
- 5.6.4. Middle East & Africa
- 5.6.5. Asia Pacific
- 5.1. Market Analysis, Insights and Forecast - by Production Analysis
- 6. North America Natural Stone Flooring Industry Analysis, Insights and Forecast, 2019-2031
- 6.1. Market Analysis, Insights and Forecast - by Production Analysis
- 6.2. Market Analysis, Insights and Forecast - by Consumption Analysis
- 6.3. Market Analysis, Insights and Forecast - by Import Market Analysis (Value & Volume)
- 6.4. Market Analysis, Insights and Forecast - by Export Market Analysis (Value & Volume)
- 6.5. Market Analysis, Insights and Forecast - by Price Trend Analysis
- 6.1. Market Analysis, Insights and Forecast - by Production Analysis
- 7. South America Natural Stone Flooring Industry Analysis, Insights and Forecast, 2019-2031
- 7.1. Market Analysis, Insights and Forecast - by Production Analysis
- 7.2. Market Analysis, Insights and Forecast - by Consumption Analysis
- 7.3. Market Analysis, Insights and Forecast - by Import Market Analysis (Value & Volume)
- 7.4. Market Analysis, Insights and Forecast - by Export Market Analysis (Value & Volume)
- 7.5. Market Analysis, Insights and Forecast - by Price Trend Analysis
- 7.1. Market Analysis, Insights and Forecast - by Production Analysis
- 8. Europe Natural Stone Flooring Industry Analysis, Insights and Forecast, 2019-2031
- 8.1. Market Analysis, Insights and Forecast - by Production Analysis
- 8.2. Market Analysis, Insights and Forecast - by Consumption Analysis
- 8.3. Market Analysis, Insights and Forecast - by Import Market Analysis (Value & Volume)
- 8.4. Market Analysis, Insights and Forecast - by Export Market Analysis (Value & Volume)
- 8.5. Market Analysis, Insights and Forecast - by Price Trend Analysis
- 8.1. Market Analysis, Insights and Forecast - by Production Analysis
- 9. Middle East & Africa Natural Stone Flooring Industry Analysis, Insights and Forecast, 2019-2031
- 9.1. Market Analysis, Insights and Forecast - by Production Analysis
- 9.2. Market Analysis, Insights and Forecast - by Consumption Analysis
- 9.3. Market Analysis, Insights and Forecast - by Import Market Analysis (Value & Volume)
- 9.4. Market Analysis, Insights and Forecast - by Export Market Analysis (Value & Volume)
- 9.5. Market Analysis, Insights and Forecast - by Price Trend Analysis
- 9.1. Market Analysis, Insights and Forecast - by Production Analysis
- 10. Asia Pacific Natural Stone Flooring Industry Analysis, Insights and Forecast, 2019-2031
- 10.1. Market Analysis, Insights and Forecast - by Production Analysis
- 10.2. Market Analysis, Insights and Forecast - by Consumption Analysis
- 10.3. Market Analysis, Insights and Forecast - by Import Market Analysis (Value & Volume)
- 10.4. Market Analysis, Insights and Forecast - by Export Market Analysis (Value & Volume)
- 10.5. Market Analysis, Insights and Forecast - by Price Trend Analysis
- 10.1. Market Analysis, Insights and Forecast - by Production Analysis
- 11. North America Natural Stone Flooring Industry Analysis, Insights and Forecast, 2019-2031
- 11.1. Market Analysis, Insights and Forecast - By Country/Sub-region
- 11.1.1 United States
- 11.1.2 Canada
- 11.1.3 Mexico
- 12. Europe Natural Stone Flooring Industry Analysis, Insights and Forecast, 2019-2031
- 12.1. Market Analysis, Insights and Forecast - By Country/Sub-region
- 12.1.1 Germany
- 12.1.2 United Kingdom
- 12.1.3 France
- 12.1.4 Spain
- 12.1.5 Italy
- 12.1.6 Spain
- 12.1.7 Belgium
- 12.1.8 Netherland
- 12.1.9 Nordics
- 12.1.10 Rest of Europe
- 13. Asia Pacific Natural Stone Flooring Industry Analysis, Insights and Forecast, 2019-2031
- 13.1. Market Analysis, Insights and Forecast - By Country/Sub-region
- 13.1.1 China
- 13.1.2 Japan
- 13.1.3 India
- 13.1.4 South Korea
- 13.1.5 Southeast Asia
- 13.1.6 Australia
- 13.1.7 Indonesia
- 13.1.8 Phillipes
- 13.1.9 Singapore
- 13.1.10 Thailandc
- 13.1.11 Rest of Asia Pacific
- 14. South America Natural Stone Flooring Industry Analysis, Insights and Forecast, 2019-2031
- 14.1. Market Analysis, Insights and Forecast - By Country/Sub-region
- 14.1.1 Brazil
- 14.1.2 Argentina
- 14.1.3 Peru
- 14.1.4 Chile
- 14.1.5 Colombia
- 14.1.6 Ecuador
- 14.1.7 Venezuela
- 14.1.8 Rest of South America
- 15. North America Natural Stone Flooring Industry Analysis, Insights and Forecast, 2019-2031
- 15.1. Market Analysis, Insights and Forecast - By Country/Sub-region
- 15.1.1 United States
- 15.1.2 Canada
- 15.1.3 Mexico
- 16. MEA Natural Stone Flooring Industry Analysis, Insights and Forecast, 2019-2031
- 16.1. Market Analysis, Insights and Forecast - By Country/Sub-region
- 16.1.1 United Arab Emirates
- 16.1.2 Saudi Arabia
- 16.1.3 South Africa
- 16.1.4 Rest of Middle East and Africa
- 17. Competitive Analysis
- 17.1. Global Market Share Analysis 2024
- 17.2. Company Profiles
- 17.2.1 Arcat
- 17.2.1.1. Overview
- 17.2.1.2. Products
- 17.2.1.3. SWOT Analysis
- 17.2.1.4. Recent Developments
- 17.2.1.5. Financials (Based on Availability)
- 17.2.2 Stone Source
- 17.2.2.1. Overview
- 17.2.2.2. Products
- 17.2.2.3. SWOT Analysis
- 17.2.2.4. Recent Developments
- 17.2.2.5. Financials (Based on Availability)
- 17.2.3 OWSI Flooring & Design
- 17.2.3.1. Overview
- 17.2.3.2. Products
- 17.2.3.3. SWOT Analysis
- 17.2.3.4. Recent Developments
- 17.2.3.5. Financials (Based on Availability)
- 17.2.4 Farmington
- 17.2.4.1. Overview
- 17.2.4.2. Products
- 17.2.4.3. SWOT Analysis
- 17.2.4.4. Recent Developments
- 17.2.4.5. Financials (Based on Availability)
- 17.2.5 Emser Tile
- 17.2.5.1. Overview
- 17.2.5.2. Products
- 17.2.5.3. SWOT Analysis
- 17.2.5.4. Recent Developments
- 17.2.5.5. Financials (Based on Availability)
- 17.2.6 Templeton Floor Company
- 17.2.6.1. Overview
- 17.2.6.2. Products
- 17.2.6.3. SWOT Analysis
- 17.2.6.4. Recent Developments
- 17.2.6.5. Financials (Based on Availability)
- 17.2.7 Universal Marble & Granite Group Ltd
- 17.2.7.1. Overview
- 17.2.7.2. Products
- 17.2.7.3. SWOT Analysis
- 17.2.7.4. Recent Developments
- 17.2.7.5. Financials (Based on Availability)
- 17.2.8 BC Stone**List Not Exhaustive
- 17.2.8.1. Overview
- 17.2.8.2. Products
- 17.2.8.3. SWOT Analysis
- 17.2.8.4. Recent Developments
- 17.2.8.5. Financials (Based on Availability)
- 17.2.9 Island Stone
- 17.2.9.1. Overview
- 17.2.9.2. Products
- 17.2.9.3. SWOT Analysis
- 17.2.9.4. Recent Developments
- 17.2.9.5. Financials (Based on Availability)
- 17.2.1 Arcat
List of Figures
- Figure 1: Global Natural Stone Flooring Industry Revenue Breakdown (Million, %) by Region 2024 & 2032
- Figure 2: North America Natural Stone Flooring Industry Revenue (Million), by Country 2024 & 2032
- Figure 3: North America Natural Stone Flooring Industry Revenue Share (%), by Country 2024 & 2032
- Figure 4: Europe Natural Stone Flooring Industry Revenue (Million), by Country 2024 & 2032
- Figure 5: Europe Natural Stone Flooring Industry Revenue Share (%), by Country 2024 & 2032
- Figure 6: Asia Pacific Natural Stone Flooring Industry Revenue (Million), by Country 2024 & 2032
- Figure 7: Asia Pacific Natural Stone Flooring Industry Revenue Share (%), by Country 2024 & 2032
- Figure 8: South America Natural Stone Flooring Industry Revenue (Million), by Country 2024 & 2032
- Figure 9: South America Natural Stone Flooring Industry Revenue Share (%), by Country 2024 & 2032
- Figure 10: North America Natural Stone Flooring Industry Revenue (Million), by Country 2024 & 2032
- Figure 11: North America Natural Stone Flooring Industry Revenue Share (%), by Country 2024 & 2032
- Figure 12: MEA Natural Stone Flooring Industry Revenue (Million), by Country 2024 & 2032
- Figure 13: MEA Natural Stone Flooring Industry Revenue Share (%), by Country 2024 & 2032
- Figure 14: North America Natural Stone Flooring Industry Revenue (Million), by Production Analysis 2024 & 2032
- Figure 15: North America Natural Stone Flooring Industry Revenue Share (%), by Production Analysis 2024 & 2032
- Figure 16: North America Natural Stone Flooring Industry Revenue (Million), by Consumption Analysis 2024 & 2032
- Figure 17: North America Natural Stone Flooring Industry Revenue Share (%), by Consumption Analysis 2024 & 2032
- Figure 18: North America Natural Stone Flooring Industry Revenue (Million), by Import Market Analysis (Value & Volume) 2024 & 2032
- Figure 19: North America Natural Stone Flooring Industry Revenue Share (%), by Import Market Analysis (Value & Volume) 2024 & 2032
- Figure 20: North America Natural Stone Flooring Industry Revenue (Million), by Export Market Analysis (Value & Volume) 2024 & 2032
- Figure 21: North America Natural Stone Flooring Industry Revenue Share (%), by Export Market Analysis (Value & Volume) 2024 & 2032
- Figure 22: North America Natural Stone Flooring Industry Revenue (Million), by Price Trend Analysis 2024 & 2032
- Figure 23: North America Natural Stone Flooring Industry Revenue Share (%), by Price Trend Analysis 2024 & 2032
- Figure 24: North America Natural Stone Flooring Industry Revenue (Million), by Country 2024 & 2032
- Figure 25: North America Natural Stone Flooring Industry Revenue Share (%), by Country 2024 & 2032
- Figure 26: South America Natural Stone Flooring Industry Revenue (Million), by Production Analysis 2024 & 2032
- Figure 27: South America Natural Stone Flooring Industry Revenue Share (%), by Production Analysis 2024 & 2032
- Figure 28: South America Natural Stone Flooring Industry Revenue (Million), by Consumption Analysis 2024 & 2032
- Figure 29: South America Natural Stone Flooring Industry Revenue Share (%), by Consumption Analysis 2024 & 2032
- Figure 30: South America Natural Stone Flooring Industry Revenue (Million), by Import Market Analysis (Value & Volume) 2024 & 2032
- Figure 31: South America Natural Stone Flooring Industry Revenue Share (%), by Import Market Analysis (Value & Volume) 2024 & 2032
- Figure 32: South America Natural Stone Flooring Industry Revenue (Million), by Export Market Analysis (Value & Volume) 2024 & 2032
- Figure 33: South America Natural Stone Flooring Industry Revenue Share (%), by Export Market Analysis (Value & Volume) 2024 & 2032
- Figure 34: South America Natural Stone Flooring Industry Revenue (Million), by Price Trend Analysis 2024 & 2032
- Figure 35: South America Natural Stone Flooring Industry Revenue Share (%), by Price Trend Analysis 2024 & 2032
- Figure 36: South America Natural Stone Flooring Industry Revenue (Million), by Country 2024 & 2032
- Figure 37: South America Natural Stone Flooring Industry Revenue Share (%), by Country 2024 & 2032
- Figure 38: Europe Natural Stone Flooring Industry Revenue (Million), by Production Analysis 2024 & 2032
- Figure 39: Europe Natural Stone Flooring Industry Revenue Share (%), by Production Analysis 2024 & 2032
- Figure 40: Europe Natural Stone Flooring Industry Revenue (Million), by Consumption Analysis 2024 & 2032
- Figure 41: Europe Natural Stone Flooring Industry Revenue Share (%), by Consumption Analysis 2024 & 2032
- Figure 42: Europe Natural Stone Flooring Industry Revenue (Million), by Import Market Analysis (Value & Volume) 2024 & 2032
- Figure 43: Europe Natural Stone Flooring Industry Revenue Share (%), by Import Market Analysis (Value & Volume) 2024 & 2032
- Figure 44: Europe Natural Stone Flooring Industry Revenue (Million), by Export Market Analysis (Value & Volume) 2024 & 2032
- Figure 45: Europe Natural Stone Flooring Industry Revenue Share (%), by Export Market Analysis (Value & Volume) 2024 & 2032
- Figure 46: Europe Natural Stone Flooring Industry Revenue (Million), by Price Trend Analysis 2024 & 2032
- Figure 47: Europe Natural Stone Flooring Industry Revenue Share (%), by Price Trend Analysis 2024 & 2032
- Figure 48: Europe Natural Stone Flooring Industry Revenue (Million), by Country 2024 & 2032
- Figure 49: Europe Natural Stone Flooring Industry Revenue Share (%), by Country 2024 & 2032
- Figure 50: Middle East & Africa Natural Stone Flooring Industry Revenue (Million), by Production Analysis 2024 & 2032
- Figure 51: Middle East & Africa Natural Stone Flooring Industry Revenue Share (%), by Production Analysis 2024 & 2032
- Figure 52: Middle East & Africa Natural Stone Flooring Industry Revenue (Million), by Consumption Analysis 2024 & 2032
- Figure 53: Middle East & Africa Natural Stone Flooring Industry Revenue Share (%), by Consumption Analysis 2024 & 2032
- Figure 54: Middle East & Africa Natural Stone Flooring Industry Revenue (Million), by Import Market Analysis (Value & Volume) 2024 & 2032
- Figure 55: Middle East & Africa Natural Stone Flooring Industry Revenue Share (%), by Import Market Analysis (Value & Volume) 2024 & 2032
- Figure 56: Middle East & Africa Natural Stone Flooring Industry Revenue (Million), by Export Market Analysis (Value & Volume) 2024 & 2032
- Figure 57: Middle East & Africa Natural Stone Flooring Industry Revenue Share (%), by Export Market Analysis (Value & Volume) 2024 & 2032
- Figure 58: Middle East & Africa Natural Stone Flooring Industry Revenue (Million), by Price Trend Analysis 2024 & 2032
- Figure 59: Middle East & Africa Natural Stone Flooring Industry Revenue Share (%), by Price Trend Analysis 2024 & 2032
- Figure 60: Middle East & Africa Natural Stone Flooring Industry Revenue (Million), by Country 2024 & 2032
- Figure 61: Middle East & Africa Natural Stone Flooring Industry Revenue Share (%), by Country 2024 & 2032
- Figure 62: Asia Pacific Natural Stone Flooring Industry Revenue (Million), by Production Analysis 2024 & 2032
- Figure 63: Asia Pacific Natural Stone Flooring Industry Revenue Share (%), by Production Analysis 2024 & 2032
- Figure 64: Asia Pacific Natural Stone Flooring Industry Revenue (Million), by Consumption Analysis 2024 & 2032
- Figure 65: Asia Pacific Natural Stone Flooring Industry Revenue Share (%), by Consumption Analysis 2024 & 2032
- Figure 66: Asia Pacific Natural Stone Flooring Industry Revenue (Million), by Import Market Analysis (Value & Volume) 2024 & 2032
- Figure 67: Asia Pacific Natural Stone Flooring Industry Revenue Share (%), by Import Market Analysis (Value & Volume) 2024 & 2032
- Figure 68: Asia Pacific Natural Stone Flooring Industry Revenue (Million), by Export Market Analysis (Value & Volume) 2024 & 2032
- Figure 69: Asia Pacific Natural Stone Flooring Industry Revenue Share (%), by Export Market Analysis (Value & Volume) 2024 & 2032
- Figure 70: Asia Pacific Natural Stone Flooring Industry Revenue (Million), by Price Trend Analysis 2024 & 2032
- Figure 71: Asia Pacific Natural Stone Flooring Industry Revenue Share (%), by Price Trend Analysis 2024 & 2032
- Figure 72: Asia Pacific Natural Stone Flooring Industry Revenue (Million), by Country 2024 & 2032
- Figure 73: Asia Pacific Natural Stone Flooring Industry Revenue Share (%), by Country 2024 & 2032
List of Tables
- Table 1: Global Natural Stone Flooring Industry Revenue Million Forecast, by Region 2019 & 2032
- Table 2: Global Natural Stone Flooring Industry Revenue Million Forecast, by Production Analysis 2019 & 2032
- Table 3: Global Natural Stone Flooring Industry Revenue Million Forecast, by Consumption Analysis 2019 & 2032
- Table 4: Global Natural Stone Flooring Industry Revenue Million Forecast, by Import Market Analysis (Value & Volume) 2019 & 2032
- Table 5: Global Natural Stone Flooring Industry Revenue Million Forecast, by Export Market Analysis (Value & Volume) 2019 & 2032
- Table 6: Global Natural Stone Flooring Industry Revenue Million Forecast, by Price Trend Analysis 2019 & 2032
- Table 7: Global Natural Stone Flooring Industry Revenue Million Forecast, by Region 2019 & 2032
- Table 8: Global Natural Stone Flooring Industry Revenue Million Forecast, by Country 2019 & 2032
- Table 9: United States Natural Stone Flooring Industry Revenue (Million) Forecast, by Application 2019 & 2032
- Table 10: Canada Natural Stone Flooring Industry Revenue (Million) Forecast, by Application 2019 & 2032
- Table 11: Mexico Natural Stone Flooring Industry Revenue (Million) Forecast, by Application 2019 & 2032
- Table 12: Global Natural Stone Flooring Industry Revenue Million Forecast, by Country 2019 & 2032
- Table 13: Germany Natural Stone Flooring Industry Revenue (Million) Forecast, by Application 2019 & 2032
- Table 14: United Kingdom Natural Stone Flooring Industry Revenue (Million) Forecast, by Application 2019 & 2032
- Table 15: France Natural Stone Flooring Industry Revenue (Million) Forecast, by Application 2019 & 2032
- Table 16: Spain Natural Stone Flooring Industry Revenue (Million) Forecast, by Application 2019 & 2032
- Table 17: Italy Natural Stone Flooring Industry Revenue (Million) Forecast, by Application 2019 & 2032
- Table 18: Spain Natural Stone Flooring Industry Revenue (Million) Forecast, by Application 2019 & 2032
- Table 19: Belgium Natural Stone Flooring Industry Revenue (Million) Forecast, by Application 2019 & 2032
- Table 20: Netherland Natural Stone Flooring Industry Revenue (Million) Forecast, by Application 2019 & 2032
- Table 21: Nordics Natural Stone Flooring Industry Revenue (Million) Forecast, by Application 2019 & 2032
- Table 22: Rest of Europe Natural Stone Flooring Industry Revenue (Million) Forecast, by Application 2019 & 2032
- Table 23: Global Natural Stone Flooring Industry Revenue Million Forecast, by Country 2019 & 2032
- Table 24: China Natural Stone Flooring Industry Revenue (Million) Forecast, by Application 2019 & 2032
- Table 25: Japan Natural Stone Flooring Industry Revenue (Million) Forecast, by Application 2019 & 2032
- Table 26: India Natural Stone Flooring Industry Revenue (Million) Forecast, by Application 2019 & 2032
- Table 27: South Korea Natural Stone Flooring Industry Revenue (Million) Forecast, by Application 2019 & 2032
- Table 28: Southeast Asia Natural Stone Flooring Industry Revenue (Million) Forecast, by Application 2019 & 2032
- Table 29: Australia Natural Stone Flooring Industry Revenue (Million) Forecast, by Application 2019 & 2032
- Table 30: Indonesia Natural Stone Flooring Industry Revenue (Million) Forecast, by Application 2019 & 2032
- Table 31: Phillipes Natural Stone Flooring Industry Revenue (Million) Forecast, by Application 2019 & 2032
- Table 32: Singapore Natural Stone Flooring Industry Revenue (Million) Forecast, by Application 2019 & 2032
- Table 33: Thailandc Natural Stone Flooring Industry Revenue (Million) Forecast, by Application 2019 & 2032
- Table 34: Rest of Asia Pacific Natural Stone Flooring Industry Revenue (Million) Forecast, by Application 2019 & 2032
- Table 35: Global Natural Stone Flooring Industry Revenue Million Forecast, by Country 2019 & 2032
- Table 36: Brazil Natural Stone Flooring Industry Revenue (Million) Forecast, by Application 2019 & 2032
- Table 37: Argentina Natural Stone Flooring Industry Revenue (Million) Forecast, by Application 2019 & 2032
- Table 38: Peru Natural Stone Flooring Industry Revenue (Million) Forecast, by Application 2019 & 2032
- Table 39: Chile Natural Stone Flooring Industry Revenue (Million) Forecast, by Application 2019 & 2032
- Table 40: Colombia Natural Stone Flooring Industry Revenue (Million) Forecast, by Application 2019 & 2032
- Table 41: Ecuador Natural Stone Flooring Industry Revenue (Million) Forecast, by Application 2019 & 2032
- Table 42: Venezuela Natural Stone Flooring Industry Revenue (Million) Forecast, by Application 2019 & 2032
- Table 43: Rest of South America Natural Stone Flooring Industry Revenue (Million) Forecast, by Application 2019 & 2032
- Table 44: Global Natural Stone Flooring Industry Revenue Million Forecast, by Country 2019 & 2032
- Table 45: United States Natural Stone Flooring Industry Revenue (Million) Forecast, by Application 2019 & 2032
- Table 46: Canada Natural Stone Flooring Industry Revenue (Million) Forecast, by Application 2019 & 2032
- Table 47: Mexico Natural Stone Flooring Industry Revenue (Million) Forecast, by Application 2019 & 2032
- Table 48: Global Natural Stone Flooring Industry Revenue Million Forecast, by Country 2019 & 2032
- Table 49: United Arab Emirates Natural Stone Flooring Industry Revenue (Million) Forecast, by Application 2019 & 2032
- Table 50: Saudi Arabia Natural Stone Flooring Industry Revenue (Million) Forecast, by Application 2019 & 2032
- Table 51: South Africa Natural Stone Flooring Industry Revenue (Million) Forecast, by Application 2019 & 2032
- Table 52: Rest of Middle East and Africa Natural Stone Flooring Industry Revenue (Million) Forecast, by Application 2019 & 2032
- Table 53: Global Natural Stone Flooring Industry Revenue Million Forecast, by Production Analysis 2019 & 2032
- Table 54: Global Natural Stone Flooring Industry Revenue Million Forecast, by Consumption Analysis 2019 & 2032
- Table 55: Global Natural Stone Flooring Industry Revenue Million Forecast, by Import Market Analysis (Value & Volume) 2019 & 2032
- Table 56: Global Natural Stone Flooring Industry Revenue Million Forecast, by Export Market Analysis (Value & Volume) 2019 & 2032
- Table 57: Global Natural Stone Flooring Industry Revenue Million Forecast, by Price Trend Analysis 2019 & 2032
- Table 58: Global Natural Stone Flooring Industry Revenue Million Forecast, by Country 2019 & 2032
- Table 59: United States Natural Stone Flooring Industry Revenue (Million) Forecast, by Application 2019 & 2032
- Table 60: Canada Natural Stone Flooring Industry Revenue (Million) Forecast, by Application 2019 & 2032
- Table 61: Mexico Natural Stone Flooring Industry Revenue (Million) Forecast, by Application 2019 & 2032
- Table 62: Global Natural Stone Flooring Industry Revenue Million Forecast, by Production Analysis 2019 & 2032
- Table 63: Global Natural Stone Flooring Industry Revenue Million Forecast, by Consumption Analysis 2019 & 2032
- Table 64: Global Natural Stone Flooring Industry Revenue Million Forecast, by Import Market Analysis (Value & Volume) 2019 & 2032
- Table 65: Global Natural Stone Flooring Industry Revenue Million Forecast, by Export Market Analysis (Value & Volume) 2019 & 2032
- Table 66: Global Natural Stone Flooring Industry Revenue Million Forecast, by Price Trend Analysis 2019 & 2032
- Table 67: Global Natural Stone Flooring Industry Revenue Million Forecast, by Country 2019 & 2032
- Table 68: Brazil Natural Stone Flooring Industry Revenue (Million) Forecast, by Application 2019 & 2032
- Table 69: Argentina Natural Stone Flooring Industry Revenue (Million) Forecast, by Application 2019 & 2032
- Table 70: Rest of South America Natural Stone Flooring Industry Revenue (Million) Forecast, by Application 2019 & 2032
- Table 71: Global Natural Stone Flooring Industry Revenue Million Forecast, by Production Analysis 2019 & 2032
- Table 72: Global Natural Stone Flooring Industry Revenue Million Forecast, by Consumption Analysis 2019 & 2032
- Table 73: Global Natural Stone Flooring Industry Revenue Million Forecast, by Import Market Analysis (Value & Volume) 2019 & 2032
- Table 74: Global Natural Stone Flooring Industry Revenue Million Forecast, by Export Market Analysis (Value & Volume) 2019 & 2032
- Table 75: Global Natural Stone Flooring Industry Revenue Million Forecast, by Price Trend Analysis 2019 & 2032
- Table 76: Global Natural Stone Flooring Industry Revenue Million Forecast, by Country 2019 & 2032
- Table 77: United Kingdom Natural Stone Flooring Industry Revenue (Million) Forecast, by Application 2019 & 2032
- Table 78: Germany Natural Stone Flooring Industry Revenue (Million) Forecast, by Application 2019 & 2032
- Table 79: France Natural Stone Flooring Industry Revenue (Million) Forecast, by Application 2019 & 2032
- Table 80: Italy Natural Stone Flooring Industry Revenue (Million) Forecast, by Application 2019 & 2032
- Table 81: Spain Natural Stone Flooring Industry Revenue (Million) Forecast, by Application 2019 & 2032
- Table 82: Russia Natural Stone Flooring Industry Revenue (Million) Forecast, by Application 2019 & 2032
- Table 83: Benelux Natural Stone Flooring Industry Revenue (Million) Forecast, by Application 2019 & 2032
- Table 84: Nordics Natural Stone Flooring Industry Revenue (Million) Forecast, by Application 2019 & 2032
- Table 85: Rest of Europe Natural Stone Flooring Industry Revenue (Million) Forecast, by Application 2019 & 2032
- Table 86: Global Natural Stone Flooring Industry Revenue Million Forecast, by Production Analysis 2019 & 2032
- Table 87: Global Natural Stone Flooring Industry Revenue Million Forecast, by Consumption Analysis 2019 & 2032
- Table 88: Global Natural Stone Flooring Industry Revenue Million Forecast, by Import Market Analysis (Value & Volume) 2019 & 2032
- Table 89: Global Natural Stone Flooring Industry Revenue Million Forecast, by Export Market Analysis (Value & Volume) 2019 & 2032
- Table 90: Global Natural Stone Flooring Industry Revenue Million Forecast, by Price Trend Analysis 2019 & 2032
- Table 91: Global Natural Stone Flooring Industry Revenue Million Forecast, by Country 2019 & 2032
- Table 92: Turkey Natural Stone Flooring Industry Revenue (Million) Forecast, by Application 2019 & 2032
- Table 93: Israel Natural Stone Flooring Industry Revenue (Million) Forecast, by Application 2019 & 2032
- Table 94: GCC Natural Stone Flooring Industry Revenue (Million) Forecast, by Application 2019 & 2032
- Table 95: North Africa Natural Stone Flooring Industry Revenue (Million) Forecast, by Application 2019 & 2032
- Table 96: South Africa Natural Stone Flooring Industry Revenue (Million) Forecast, by Application 2019 & 2032
- Table 97: Rest of Middle East & Africa Natural Stone Flooring Industry Revenue (Million) Forecast, by Application 2019 & 2032
- Table 98: Global Natural Stone Flooring Industry Revenue Million Forecast, by Production Analysis 2019 & 2032
- Table 99: Global Natural Stone Flooring Industry Revenue Million Forecast, by Consumption Analysis 2019 & 2032
- Table 100: Global Natural Stone Flooring Industry Revenue Million Forecast, by Import Market Analysis (Value & Volume) 2019 & 2032
- Table 101: Global Natural Stone Flooring Industry Revenue Million Forecast, by Export Market Analysis (Value & Volume) 2019 & 2032
- Table 102: Global Natural Stone Flooring Industry Revenue Million Forecast, by Price Trend Analysis 2019 & 2032
- Table 103: Global Natural Stone Flooring Industry Revenue Million Forecast, by Country 2019 & 2032
- Table 104: China Natural Stone Flooring Industry Revenue (Million) Forecast, by Application 2019 & 2032
- Table 105: India Natural Stone Flooring Industry Revenue (Million) Forecast, by Application 2019 & 2032
- Table 106: Japan Natural Stone Flooring Industry Revenue (Million) Forecast, by Application 2019 & 2032
- Table 107: South Korea Natural Stone Flooring Industry Revenue (Million) Forecast, by Application 2019 & 2032
- Table 108: ASEAN Natural Stone Flooring Industry Revenue (Million) Forecast, by Application 2019 & 2032
- Table 109: Oceania Natural Stone Flooring Industry Revenue (Million) Forecast, by Application 2019 & 2032
- Table 110: Rest of Asia Pacific Natural Stone Flooring Industry Revenue (Million) Forecast, by Application 2019 & 2032
Frequently Asked Questions
1. What is the projected Compound Annual Growth Rate (CAGR) of the Natural Stone Flooring Industry?
The projected CAGR is approximately 4.16%.
2. Which companies are prominent players in the Natural Stone Flooring Industry?
Key companies in the market include Arcat, Stone Source, OWSI Flooring & Design, Farmington, Emser Tile, Templeton Floor Company, Universal Marble & Granite Group Ltd, BC Stone**List Not Exhaustive, Island Stone.
3. What are the main segments of the Natural Stone Flooring Industry?
The market segments include Production Analysis, Consumption Analysis, Import Market Analysis (Value & Volume), Export Market Analysis (Value & Volume), Price Trend Analysis.
4. Can you provide details about the market size?
The market size is estimated to be USD 11.58 Million as of 2022.
5. What are some drivers contributing to market growth?
Increased Demand for Aesthetically Appealing Products to Fuel the Growth of the Stone Flooring Market; Demand for Stone Floors as a Decorative Tool in the Construction Industry.
6. What are the notable trends driving market growth?
Rapid Urbanization and Increasing Disposable Income Leads to Growth of the Construction Activities.
7. Are there any restraints impacting market growth?
High Initial Cost; Lack of Skilled Labor.
8. Can you provide examples of recent developments in the market?
December 2022: Emser Tile, a prominent creator and manufacturer of high-quality tile and natural stone globally, introduced 4 fresh sets of glazed porcelain and ceramic tile: Tubage, Boxwood, Fragmento, and Estasi.
9. What pricing options are available for accessing the report?
Pricing options include single-user, multi-user, and enterprise licenses priced at USD 4750, USD 5250, and USD 8750 respectively.
10. Is the market size provided in terms of value or volume?
The market size is provided in terms of value, measured in Million.
11. Are there any specific market keywords associated with the report?
Yes, the market keyword associated with the report is "Natural Stone Flooring Industry," which aids in identifying and referencing the specific market segment covered.
12. How do I determine which pricing option suits my needs best?
The pricing options vary based on user requirements and access needs. Individual users may opt for single-user licenses, while businesses requiring broader access may choose multi-user or enterprise licenses for cost-effective access to the report.
13. Are there any additional resources or data provided in the Natural Stone Flooring Industry report?
While the report offers comprehensive insights, it's advisable to review the specific contents or supplementary materials provided to ascertain if additional resources or data are available.
14. How can I stay updated on further developments or reports in the Natural Stone Flooring Industry?
To stay informed about further developments, trends, and reports in the Natural Stone Flooring Industry, consider subscribing to industry newsletters, following relevant companies and organizations, or regularly checking reputable industry news sources and publications.
Methodology
Step 1 - Identification of Relevant Samples Size from Population Database


Step 2 - Approaches for Defining Global Market Size (Value, Volume* & Price*)

Note*: In applicable scenarios
Step 3 - Data Sources
Primary Research
- Web Analytics
- Survey Reports
- Research Institute
- Latest Research Reports
- Opinion Leaders
Secondary Research
- Annual Reports
- White Paper
- Latest Press Release
- Industry Association
- Paid Database
- Investor Presentations

Step 4 - Data Triangulation
Involves using different sources of information in order to increase the validity of a study
These sources are likely to be stakeholders in a program - participants, other researchers, program staff, other community members, and so on.
Then we put all data in single framework & apply various statistical tools to find out the dynamic on the market.
During the analysis stage, feedback from the stakeholder groups would be compared to determine areas of agreement as well as areas of divergence


