
Key Insights
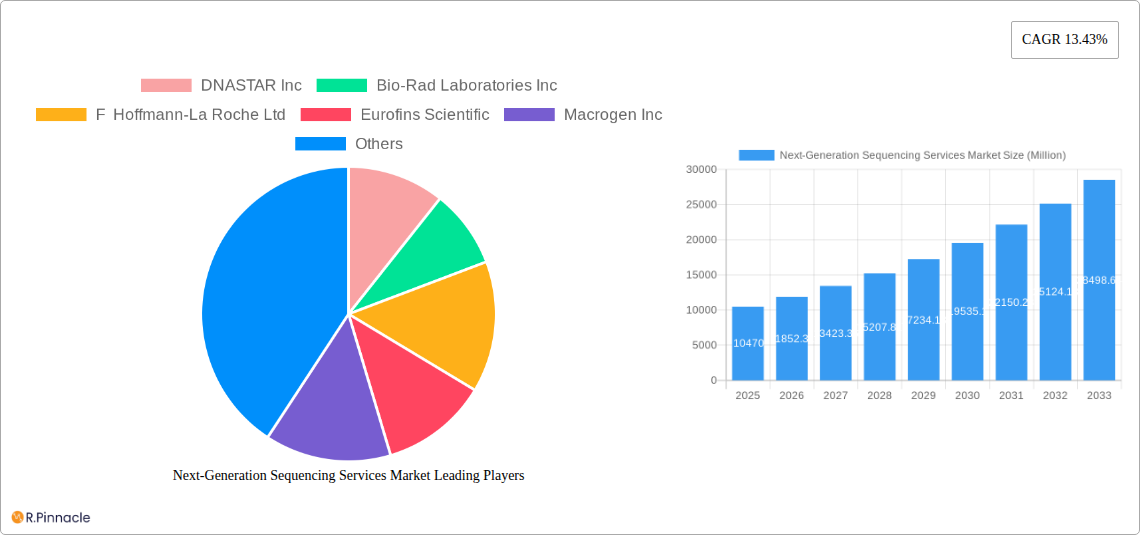
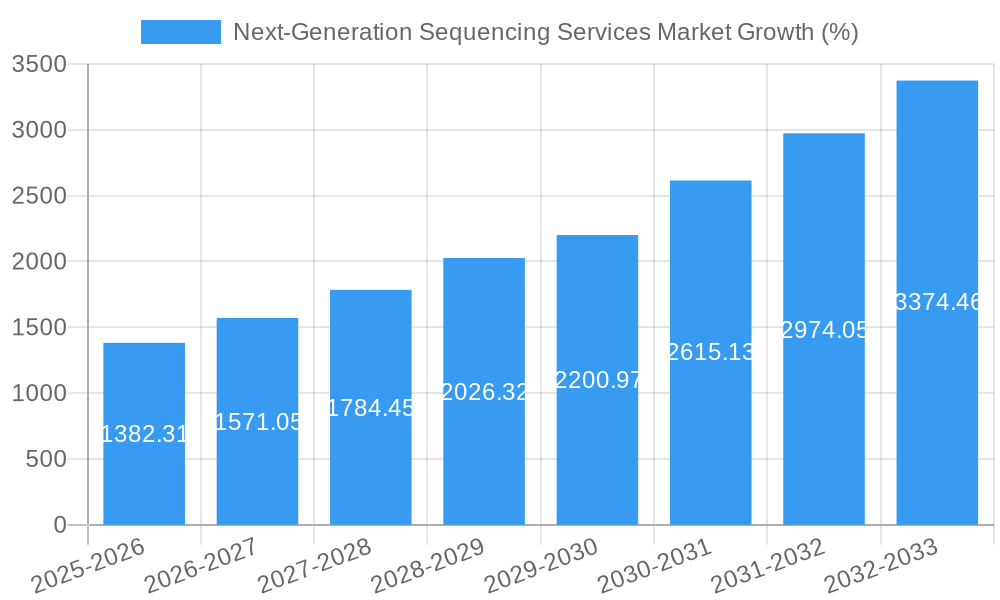
The Next-Generation Sequencing (NGS) services market is experiencing robust growth, projected to reach $10.47 billion in 2025 and maintain a Compound Annual Growth Rate (CAGR) of 13.43% from 2025 to 2033. This expansion is driven by several key factors. The increasing prevalence of chronic diseases necessitates advanced diagnostic tools, fueling demand for NGS in personalized medicine and drug discovery. Furthermore, the falling cost of sequencing and the expanding applications of NGS in genetic screening, agricultural research, and diagnostics are accelerating market growth. Advances in technology, leading to faster and more accurate sequencing, are also contributing significantly. While data privacy concerns and the need for skilled professionals pose some restraints, the overall market outlook remains positive, particularly in regions like North America and Asia Pacific which are characterized by advanced healthcare infrastructure and significant research investment. The market segmentation reveals a strong demand across various application areas, with drug discovery and personalized medicine holding a dominant share, followed by genetic screening and diagnostics. Similarly, whole genome sequencing and targeted resequencing represent significant portions of the types of sequencing market. The high capital investment in instrument development means that the reagent and consumable segment also sees significant growth while services represent a significant portion of the market due to the need for data analysis and interpretation. The market is further shaped by the leading players in the industry, including Illumina, Thermo Fisher Scientific, and Qiagen, who are continuously innovating and expanding their service offerings.
The substantial growth projected for the NGS services market suggests a promising future for this technology. The increasing accessibility and affordability of NGS are widening its adoption across various sectors, fostering further innovation and development. The consistent growth across diverse segments, including application areas and product types, implies the versatility and potential of NGS to address a wide range of needs in healthcare, research, and agriculture. This robust market expansion presents lucrative opportunities for both established players and emerging companies to enter the field. Geographic expansion, particularly in developing countries, holds significant potential for growth as healthcare infrastructures improve. Technological advancements, such as portable sequencing devices and cloud-based data analysis, will continue to shape the landscape, driving further market expansion.
Next-Generation Sequencing Services Market: A Comprehensive Report (2019-2033)
This in-depth report provides a comprehensive analysis of the Next-Generation Sequencing (NGS) Services Market, offering invaluable insights for industry professionals, investors, and researchers. Covering the period from 2019 to 2033, with a focus on 2025, this report meticulously examines market dynamics, segmentation, key players, and future growth prospects. The global NGS services market is projected to reach xx Million by 2033, exhibiting a robust CAGR of xx% during the forecast period (2025-2033).
Next-Generation Sequencing Services Market Market Structure & Innovation Trends
The NGS services market exhibits a moderately concentrated structure, with key players like Illumina, Thermo Fisher Scientific, and Qiagen holding significant market share. However, the market also features a number of smaller, specialized companies, fostering competition and innovation. Market share data for 2024 reveals Illumina holding approximately xx% market share, Thermo Fisher Scientific at xx%, and Qiagen at xx%, with the remaining share distributed among other players. Innovation is driven by advancements in sequencing technologies, such as increased throughput, reduced costs, and improved accuracy. Stringent regulatory frameworks, particularly in healthcare, influence market access and adoption. Product substitutes, such as traditional Sanger sequencing, remain limited due to NGS's superior capabilities. The end-user demographic is diverse, encompassing hospitals, research institutions, pharmaceutical companies, and agricultural entities. M&A activity has been notable, with several significant deals exceeding xx Million in value over the past five years. These acquisitions often aim to expand product portfolios, enhance technological capabilities, and consolidate market presence.
- Market Concentration: Moderately concentrated, with a few dominant players and numerous smaller companies.
- Innovation Drivers: Advancements in sequencing technologies, cost reduction, and increased accuracy.
- Regulatory Frameworks: Stringent regulations, particularly in healthcare and diagnostics, impact market access.
- Product Substitutes: Limited due to NGS's superior capabilities.
- End-User Demographics: Diverse, including hospitals, research institutions, and pharmaceutical/agricultural companies.
- M&A Activity: Significant deals observed, exceeding xx Million in value in recent years.
Next-Generation Sequencing Services Market Market Dynamics & Trends
The NGS services market is experiencing substantial growth, fueled by several key factors. The rising prevalence of chronic diseases and the increasing demand for personalized medicine are driving adoption of NGS for diagnostics and drug discovery. Technological advancements, including the development of more efficient and cost-effective sequencing platforms, are further accelerating market expansion. Consumer preferences are shifting towards faster, more accurate, and accessible diagnostic solutions, creating demand for NGS-based services. Competitive dynamics are intense, with companies focusing on innovation, strategic partnerships, and acquisitions to gain a competitive edge. The market penetration of NGS in various applications, like genetic screening and agricultural research, continues to increase, further boosting overall market growth. The CAGR for the period 2019-2024 is estimated at xx%, reflecting the rapid expansion of this market.
Dominant Regions & Segments in Next-Generation Sequencing Services Market
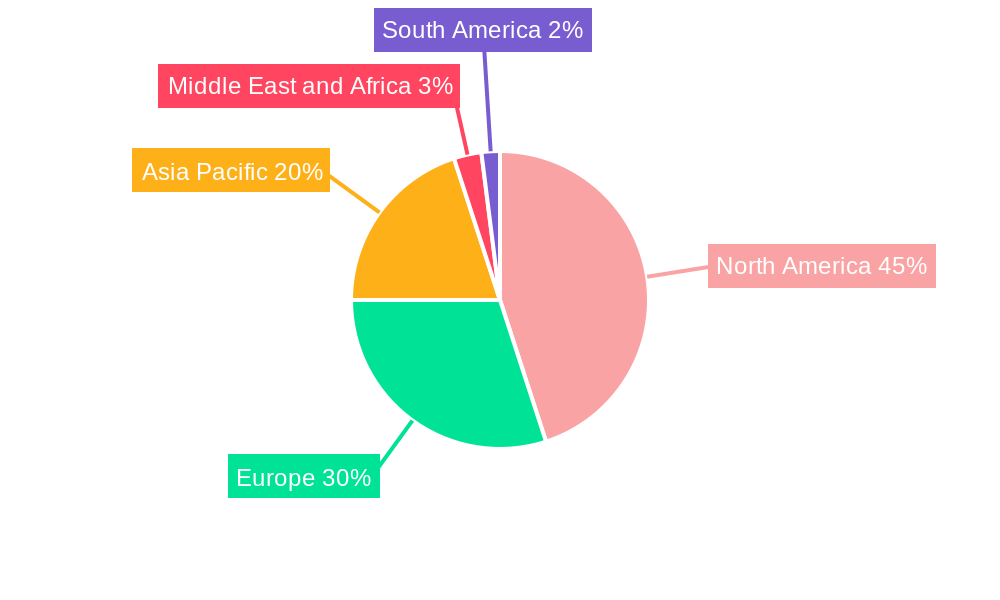
The North American region currently dominates the NGS services market, driven by robust healthcare infrastructure, substantial research funding, and a high prevalence of chronic diseases. Within the segment breakdown, Drug Discovery and Personalized Medicine represents the largest application area, followed by Diagnostics. Whole Genome Sequencing and Targeted Resequencing are the leading types of sequencing. Services, including bioinformatics and data analysis, constitute a significant portion of the market by Product Type. Pharmaceutical and Biotechnology companies, followed by hospitals and healthcare institutions, comprise the most significant end-user group.
Key Drivers for North American Dominance:
- Advanced healthcare infrastructure
- High research and development investment
- High prevalence of chronic diseases
- Strong regulatory support for NGS technologies
Other Region Performance: European and Asia-Pacific regions show substantial growth potential.
Segment Analysis:
- Application: Drug Discovery and Personalized Medicine leads due to rising demand for personalized treatments.
- Type of Sequencing: Whole Genome Sequencing and Targeted Resequencing are most widely adopted.
- Product Type: Services segment demonstrates significant growth due to the increasing complexity of data analysis.
- End-User: Pharmaceutical and Biotechnology companies lead due to their high R&D spending.
Next-Generation Sequencing Services Market Product Innovations
Recent product innovations focus on enhancing speed, accuracy, and affordability of NGS. The launch of high-throughput sequencers like Illumina's NovaSeq X series is a major step towards making NGS more accessible. Further advancements in data analysis software and cloud-based platforms are improving the efficiency of NGS workflows. These innovations cater to the growing demand for faster turnaround times and lower sequencing costs, thereby strengthening the market's competitive landscape.
Report Scope & Segmentation Analysis
This report segments the NGS services market by application (Drug Discovery and Personalized Medicine, Genetic Screening, Diagnostics, Agriculture and Animal Research, Other Applications), type of sequencing (Whole Genome Sequencing, Targeted Resequencing, Whole Exome Sequencing, RNA Sequencing, CHIP Sequencing, De Novo Sequencing, Methyl Sequencing), product type (Instruments, Reagents and Consumables, Services), and end-user (Hospitals and Healthcare Institutions, Academics, Pharmaceutical and Biotechnology Companies). Each segment's growth projections, market size, and competitive dynamics are analyzed. For example, the Drug Discovery and Personalized Medicine application segment is projected to exhibit the highest CAGR due to the increasing adoption of targeted therapies and personalized medicine approaches.
Key Drivers of Next-Generation Sequencing Services Market Growth
Several key factors contribute to the growth of the NGS services market. Technological advancements, leading to faster, more accurate, and cost-effective sequencing, are a major driver. Increasing government funding for genomics research and initiatives promoting personalized medicine further stimulate market expansion. The rising prevalence of chronic diseases and genetic disorders creates a growing demand for accurate and timely diagnostics, fueling the adoption of NGS. Favorable regulatory landscapes in many regions are also facilitating market growth.
Challenges in the Next-Generation Sequencing Services Market Sector
Despite its significant growth potential, the NGS services market faces challenges. High initial investment costs for equipment and infrastructure can limit entry for smaller players. The complexity of data analysis and interpretation requires specialized expertise, creating a skilled labor shortage. Stringent regulatory requirements and data privacy concerns can impede market expansion. Furthermore, competition among established players and the emergence of new technologies pose challenges for market participants.
Emerging Opportunities in Next-Generation Sequencing Services Market
The NGS services market presents substantial opportunities for growth. Expanding into emerging markets with increasing healthcare infrastructure development offers significant potential. The integration of artificial intelligence (AI) and machine learning (ML) into NGS data analysis promises to enhance accuracy and efficiency. The development of novel applications in areas such as infectious disease surveillance and environmental monitoring presents new market avenues.
Leading Players in the Next-Generation Sequencing Services Market Market
- DNASTAR Inc
- Bio-Rad Laboratories Inc
- F Hoffmann-La Roche Ltd
- Eurofins Scientific
- Macrogen Inc
- Thermo Fisher Scientific Inc
- Qiagen
- PerkinElmer Inc
- Illumina Inc
- Pacific Biosciences of California Inc
- CD Genomics
- Agilent Technologies
Key Developments in Next-Generation Sequencing Services Market Industry
- September 2022: Illumina Inc. launched the NovaSeq X Series, significantly enhancing sequencing speed and efficiency.
- March 2022: Thermo Fisher Scientific launched the Ion Torrent Genexus Dx Integrated Sequencer, an automated NGS platform.
- March 2023: SOPHiA GENETICS partnered with Qiagen, combining reagent technology with the DDM platform for enhanced tumor analysis.
- January 2023: QIAGEN partnered with Helix to advance next-generation sequencing companion diagnostics.
Future Outlook for Next-Generation Sequencing Services Market Market
The future of the NGS services market is exceptionally promising. Continued technological innovation, decreasing sequencing costs, and the rising adoption of personalized medicine will drive substantial growth. Strategic partnerships and collaborations are expected to further accelerate market expansion. The increasing accessibility of NGS technologies will unlock new applications in various fields, offering substantial opportunities for market participants.
Next-Generation Sequencing Services Market Segmentation
-
1. Type of Sequencing
- 1.1. Whole Genome Sequencing
- 1.2. Targeted Resequencing
- 1.3. Whole Exome Sequencing
- 1.4. RNA Sequencing
- 1.5. CHIP Sequencing
- 1.6. De Novo Sequencing
- 1.7. Methyl Sequencing
-
2. Product Type
- 2.1. Instruments
- 2.2. Reagents and Consumables
- 2.3. Services
-
3. End-User
- 3.1. Hospitals and Healthcare Institutions
- 3.2. Academics
- 3.3. Pharmaceutical and Biotechnology Companies
-
4. Application
- 4.1. Drug Discovery and Personalized Medicine
- 4.2. Genetic Screening
- 4.3. Diagnostics
- 4.4. Agriculture and Animal Research
- 4.5. Other Applications
Next-Generation Sequencing Services Market Segmentation By Geography
-
1. North America
- 1.1. United States
- 1.2. Canada
- 1.3. Mexico
-
2. Europe
- 2.1. Germany
- 2.2. United Kingdom
- 2.3. France
- 2.4. Italy
- 2.5. Spain
- 2.6. Rest of Europe
-
3. Asia Pacific
- 3.1. China
- 3.2. Japan
- 3.3. India
- 3.4. Australia
- 3.5. South Korea
- 3.6. Rest of Asia Pacific
-
4. Middle East and Africa
- 4.1. GCC
- 4.2. South Africa
- 4.3. Rest of Middle East and Africa
-
5. South America
- 5.1. Brazil
- 5.2. Argentina
- 5.3. Rest of South America
Next-Generation Sequencing Services Market REPORT HIGHLIGHTS
| Aspects | Details |
|---|---|
| Study Period | 2019-2033 |
| Base Year | 2024 |
| Estimated Year | 2025 |
| Forecast Period | 2025-2033 |
| Historical Period | 2019-2024 |
| Growth Rate | CAGR of 13.43% from 2019-2033 |
| Segmentation |
|
Table of Contents
- 1. Introduction
- 1.1. Research Scope
- 1.2. Market Segmentation
- 1.3. Research Methodology
- 1.4. Definitions and Assumptions
- 2. Executive Summary
- 2.1. Introduction
- 3. Market Dynamics
- 3.1. Introduction
- 3.2. Market Drivers
- 3.2.1 Increasing Applications in Clinical Diagnosis and Speed
- 3.2.2 Cost
- 3.2.3 and Accuracy; Increasing Efficiency when Compared To Traditional Technologies Such As Microarrays and Rising Drug Discovery Applications
- 3.3. Market Restrains
- 3.3.1. Legal and Ethical Issues; Interpretation of Complex Data and Lack of Skilled Professionals
- 3.4. Market Trends
- 3.4.1. The Whole Genome Sequencing Segment is Expected to Grow at a Significant Rate Over the Forecast Period
- 4. Market Factor Analysis
- 4.1. Porters Five Forces
- 4.2. Supply/Value Chain
- 4.3. PESTEL analysis
- 4.4. Market Entropy
- 4.5. Patent/Trademark Analysis
- 5. Global Next-Generation Sequencing Services Market Analysis, Insights and Forecast, 2019-2031
- 5.1. Market Analysis, Insights and Forecast - by Type of Sequencing
- 5.1.1. Whole Genome Sequencing
- 5.1.2. Targeted Resequencing
- 5.1.3. Whole Exome Sequencing
- 5.1.4. RNA Sequencing
- 5.1.5. CHIP Sequencing
- 5.1.6. De Novo Sequencing
- 5.1.7. Methyl Sequencing
- 5.2. Market Analysis, Insights and Forecast - by Product Type
- 5.2.1. Instruments
- 5.2.2. Reagents and Consumables
- 5.2.3. Services
- 5.3. Market Analysis, Insights and Forecast - by End-User
- 5.3.1. Hospitals and Healthcare Institutions
- 5.3.2. Academics
- 5.3.3. Pharmaceutical and Biotechnology Companies
- 5.4. Market Analysis, Insights and Forecast - by Application
- 5.4.1. Drug Discovery and Personalized Medicine
- 5.4.2. Genetic Screening
- 5.4.3. Diagnostics
- 5.4.4. Agriculture and Animal Research
- 5.4.5. Other Applications
- 5.5. Market Analysis, Insights and Forecast - by Region
- 5.5.1. North America
- 5.5.2. Europe
- 5.5.3. Asia Pacific
- 5.5.4. Middle East and Africa
- 5.5.5. South America
- 5.1. Market Analysis, Insights and Forecast - by Type of Sequencing
- 6. North America Next-Generation Sequencing Services Market Analysis, Insights and Forecast, 2019-2031
- 6.1. Market Analysis, Insights and Forecast - by Type of Sequencing
- 6.1.1. Whole Genome Sequencing
- 6.1.2. Targeted Resequencing
- 6.1.3. Whole Exome Sequencing
- 6.1.4. RNA Sequencing
- 6.1.5. CHIP Sequencing
- 6.1.6. De Novo Sequencing
- 6.1.7. Methyl Sequencing
- 6.2. Market Analysis, Insights and Forecast - by Product Type
- 6.2.1. Instruments
- 6.2.2. Reagents and Consumables
- 6.2.3. Services
- 6.3. Market Analysis, Insights and Forecast - by End-User
- 6.3.1. Hospitals and Healthcare Institutions
- 6.3.2. Academics
- 6.3.3. Pharmaceutical and Biotechnology Companies
- 6.4. Market Analysis, Insights and Forecast - by Application
- 6.4.1. Drug Discovery and Personalized Medicine
- 6.4.2. Genetic Screening
- 6.4.3. Diagnostics
- 6.4.4. Agriculture and Animal Research
- 6.4.5. Other Applications
- 6.1. Market Analysis, Insights and Forecast - by Type of Sequencing
- 7. Europe Next-Generation Sequencing Services Market Analysis, Insights and Forecast, 2019-2031
- 7.1. Market Analysis, Insights and Forecast - by Type of Sequencing
- 7.1.1. Whole Genome Sequencing
- 7.1.2. Targeted Resequencing
- 7.1.3. Whole Exome Sequencing
- 7.1.4. RNA Sequencing
- 7.1.5. CHIP Sequencing
- 7.1.6. De Novo Sequencing
- 7.1.7. Methyl Sequencing
- 7.2. Market Analysis, Insights and Forecast - by Product Type
- 7.2.1. Instruments
- 7.2.2. Reagents and Consumables
- 7.2.3. Services
- 7.3. Market Analysis, Insights and Forecast - by End-User
- 7.3.1. Hospitals and Healthcare Institutions
- 7.3.2. Academics
- 7.3.3. Pharmaceutical and Biotechnology Companies
- 7.4. Market Analysis, Insights and Forecast - by Application
- 7.4.1. Drug Discovery and Personalized Medicine
- 7.4.2. Genetic Screening
- 7.4.3. Diagnostics
- 7.4.4. Agriculture and Animal Research
- 7.4.5. Other Applications
- 7.1. Market Analysis, Insights and Forecast - by Type of Sequencing
- 8. Asia Pacific Next-Generation Sequencing Services Market Analysis, Insights and Forecast, 2019-2031
- 8.1. Market Analysis, Insights and Forecast - by Type of Sequencing
- 8.1.1. Whole Genome Sequencing
- 8.1.2. Targeted Resequencing
- 8.1.3. Whole Exome Sequencing
- 8.1.4. RNA Sequencing
- 8.1.5. CHIP Sequencing
- 8.1.6. De Novo Sequencing
- 8.1.7. Methyl Sequencing
- 8.2. Market Analysis, Insights and Forecast - by Product Type
- 8.2.1. Instruments
- 8.2.2. Reagents and Consumables
- 8.2.3. Services
- 8.3. Market Analysis, Insights and Forecast - by End-User
- 8.3.1. Hospitals and Healthcare Institutions
- 8.3.2. Academics
- 8.3.3. Pharmaceutical and Biotechnology Companies
- 8.4. Market Analysis, Insights and Forecast - by Application
- 8.4.1. Drug Discovery and Personalized Medicine
- 8.4.2. Genetic Screening
- 8.4.3. Diagnostics
- 8.4.4. Agriculture and Animal Research
- 8.4.5. Other Applications
- 8.1. Market Analysis, Insights and Forecast - by Type of Sequencing
- 9. Middle East and Africa Next-Generation Sequencing Services Market Analysis, Insights and Forecast, 2019-2031
- 9.1. Market Analysis, Insights and Forecast - by Type of Sequencing
- 9.1.1. Whole Genome Sequencing
- 9.1.2. Targeted Resequencing
- 9.1.3. Whole Exome Sequencing
- 9.1.4. RNA Sequencing
- 9.1.5. CHIP Sequencing
- 9.1.6. De Novo Sequencing
- 9.1.7. Methyl Sequencing
- 9.2. Market Analysis, Insights and Forecast - by Product Type
- 9.2.1. Instruments
- 9.2.2. Reagents and Consumables
- 9.2.3. Services
- 9.3. Market Analysis, Insights and Forecast - by End-User
- 9.3.1. Hospitals and Healthcare Institutions
- 9.3.2. Academics
- 9.3.3. Pharmaceutical and Biotechnology Companies
- 9.4. Market Analysis, Insights and Forecast - by Application
- 9.4.1. Drug Discovery and Personalized Medicine
- 9.4.2. Genetic Screening
- 9.4.3. Diagnostics
- 9.4.4. Agriculture and Animal Research
- 9.4.5. Other Applications
- 9.1. Market Analysis, Insights and Forecast - by Type of Sequencing
- 10. South America Next-Generation Sequencing Services Market Analysis, Insights and Forecast, 2019-2031
- 10.1. Market Analysis, Insights and Forecast - by Type of Sequencing
- 10.1.1. Whole Genome Sequencing
- 10.1.2. Targeted Resequencing
- 10.1.3. Whole Exome Sequencing
- 10.1.4. RNA Sequencing
- 10.1.5. CHIP Sequencing
- 10.1.6. De Novo Sequencing
- 10.1.7. Methyl Sequencing
- 10.2. Market Analysis, Insights and Forecast - by Product Type
- 10.2.1. Instruments
- 10.2.2. Reagents and Consumables
- 10.2.3. Services
- 10.3. Market Analysis, Insights and Forecast - by End-User
- 10.3.1. Hospitals and Healthcare Institutions
- 10.3.2. Academics
- 10.3.3. Pharmaceutical and Biotechnology Companies
- 10.4. Market Analysis, Insights and Forecast - by Application
- 10.4.1. Drug Discovery and Personalized Medicine
- 10.4.2. Genetic Screening
- 10.4.3. Diagnostics
- 10.4.4. Agriculture and Animal Research
- 10.4.5. Other Applications
- 10.1. Market Analysis, Insights and Forecast - by Type of Sequencing
- 11. North America Next-Generation Sequencing Services Market Analysis, Insights and Forecast, 2019-2031
- 11.1. Market Analysis, Insights and Forecast - By Country/Sub-region
- 11.1.1 United States
- 11.1.2 Canada
- 11.1.3 Mexico
- 12. Europe Next-Generation Sequencing Services Market Analysis, Insights and Forecast, 2019-2031
- 12.1. Market Analysis, Insights and Forecast - By Country/Sub-region
- 12.1.1 Germany
- 12.1.2 United Kingdom
- 12.1.3 France
- 12.1.4 Italy
- 12.1.5 Spain
- 12.1.6 Rest of Europe
- 13. Asia Pacific Next-Generation Sequencing Services Market Analysis, Insights and Forecast, 2019-2031
- 13.1. Market Analysis, Insights and Forecast - By Country/Sub-region
- 13.1.1 China
- 13.1.2 Japan
- 13.1.3 India
- 13.1.4 Australia
- 13.1.5 South Korea
- 13.1.6 Rest of Asia Pacific
- 14. Middle East and Africa Next-Generation Sequencing Services Market Analysis, Insights and Forecast, 2019-2031
- 14.1. Market Analysis, Insights and Forecast - By Country/Sub-region
- 14.1.1 GCC
- 14.1.2 South Africa
- 14.1.3 Rest of Middle East and Africa
- 15. South America Next-Generation Sequencing Services Market Analysis, Insights and Forecast, 2019-2031
- 15.1. Market Analysis, Insights and Forecast - By Country/Sub-region
- 15.1.1 Brazil
- 15.1.2 Argentina
- 15.1.3 Rest of South America
- 16. Competitive Analysis
- 16.1. Global Market Share Analysis 2024
- 16.2. Company Profiles
- 16.2.1 DNASTAR Inc
- 16.2.1.1. Overview
- 16.2.1.2. Products
- 16.2.1.3. SWOT Analysis
- 16.2.1.4. Recent Developments
- 16.2.1.5. Financials (Based on Availability)
- 16.2.2 Bio-Rad Laboratories Inc
- 16.2.2.1. Overview
- 16.2.2.2. Products
- 16.2.2.3. SWOT Analysis
- 16.2.2.4. Recent Developments
- 16.2.2.5. Financials (Based on Availability)
- 16.2.3 F Hoffmann-La Roche Ltd
- 16.2.3.1. Overview
- 16.2.3.2. Products
- 16.2.3.3. SWOT Analysis
- 16.2.3.4. Recent Developments
- 16.2.3.5. Financials (Based on Availability)
- 16.2.4 Eurofins Scientific
- 16.2.4.1. Overview
- 16.2.4.2. Products
- 16.2.4.3. SWOT Analysis
- 16.2.4.4. Recent Developments
- 16.2.4.5. Financials (Based on Availability)
- 16.2.5 Macrogen Inc
- 16.2.5.1. Overview
- 16.2.5.2. Products
- 16.2.5.3. SWOT Analysis
- 16.2.5.4. Recent Developments
- 16.2.5.5. Financials (Based on Availability)
- 16.2.6 Thermo Fisher Scientific Inc
- 16.2.6.1. Overview
- 16.2.6.2. Products
- 16.2.6.3. SWOT Analysis
- 16.2.6.4. Recent Developments
- 16.2.6.5. Financials (Based on Availability)
- 16.2.7 Qiagen
- 16.2.7.1. Overview
- 16.2.7.2. Products
- 16.2.7.3. SWOT Analysis
- 16.2.7.4. Recent Developments
- 16.2.7.5. Financials (Based on Availability)
- 16.2.8 PerkinElmer Inc
- 16.2.8.1. Overview
- 16.2.8.2. Products
- 16.2.8.3. SWOT Analysis
- 16.2.8.4. Recent Developments
- 16.2.8.5. Financials (Based on Availability)
- 16.2.9 Illumina Inc
- 16.2.9.1. Overview
- 16.2.9.2. Products
- 16.2.9.3. SWOT Analysis
- 16.2.9.4. Recent Developments
- 16.2.9.5. Financials (Based on Availability)
- 16.2.10 Pacific Biosciences of California Inc
- 16.2.10.1. Overview
- 16.2.10.2. Products
- 16.2.10.3. SWOT Analysis
- 16.2.10.4. Recent Developments
- 16.2.10.5. Financials (Based on Availability)
- 16.2.11 CD Genomics
- 16.2.11.1. Overview
- 16.2.11.2. Products
- 16.2.11.3. SWOT Analysis
- 16.2.11.4. Recent Developments
- 16.2.11.5. Financials (Based on Availability)
- 16.2.12 Agilent Technologies
- 16.2.12.1. Overview
- 16.2.12.2. Products
- 16.2.12.3. SWOT Analysis
- 16.2.12.4. Recent Developments
- 16.2.12.5. Financials (Based on Availability)
- 16.2.1 DNASTAR Inc
List of Figures
- Figure 1: Global Next-Generation Sequencing Services Market Revenue Breakdown (Million, %) by Region 2024 & 2032
- Figure 2: Global Next-Generation Sequencing Services Market Volume Breakdown (K Units, %) by Region 2024 & 2032
- Figure 3: North America Next-Generation Sequencing Services Market Revenue (Million), by Country 2024 & 2032
- Figure 4: North America Next-Generation Sequencing Services Market Volume (K Units), by Country 2024 & 2032
- Figure 5: North America Next-Generation Sequencing Services Market Revenue Share (%), by Country 2024 & 2032
- Figure 6: North America Next-Generation Sequencing Services Market Volume Share (%), by Country 2024 & 2032
- Figure 7: Europe Next-Generation Sequencing Services Market Revenue (Million), by Country 2024 & 2032
- Figure 8: Europe Next-Generation Sequencing Services Market Volume (K Units), by Country 2024 & 2032
- Figure 9: Europe Next-Generation Sequencing Services Market Revenue Share (%), by Country 2024 & 2032
- Figure 10: Europe Next-Generation Sequencing Services Market Volume Share (%), by Country 2024 & 2032
- Figure 11: Asia Pacific Next-Generation Sequencing Services Market Revenue (Million), by Country 2024 & 2032
- Figure 12: Asia Pacific Next-Generation Sequencing Services Market Volume (K Units), by Country 2024 & 2032
- Figure 13: Asia Pacific Next-Generation Sequencing Services Market Revenue Share (%), by Country 2024 & 2032
- Figure 14: Asia Pacific Next-Generation Sequencing Services Market Volume Share (%), by Country 2024 & 2032
- Figure 15: Middle East and Africa Next-Generation Sequencing Services Market Revenue (Million), by Country 2024 & 2032
- Figure 16: Middle East and Africa Next-Generation Sequencing Services Market Volume (K Units), by Country 2024 & 2032
- Figure 17: Middle East and Africa Next-Generation Sequencing Services Market Revenue Share (%), by Country 2024 & 2032
- Figure 18: Middle East and Africa Next-Generation Sequencing Services Market Volume Share (%), by Country 2024 & 2032
- Figure 19: South America Next-Generation Sequencing Services Market Revenue (Million), by Country 2024 & 2032
- Figure 20: South America Next-Generation Sequencing Services Market Volume (K Units), by Country 2024 & 2032
- Figure 21: South America Next-Generation Sequencing Services Market Revenue Share (%), by Country 2024 & 2032
- Figure 22: South America Next-Generation Sequencing Services Market Volume Share (%), by Country 2024 & 2032
- Figure 23: North America Next-Generation Sequencing Services Market Revenue (Million), by Type of Sequencing 2024 & 2032
- Figure 24: North America Next-Generation Sequencing Services Market Volume (K Units), by Type of Sequencing 2024 & 2032
- Figure 25: North America Next-Generation Sequencing Services Market Revenue Share (%), by Type of Sequencing 2024 & 2032
- Figure 26: North America Next-Generation Sequencing Services Market Volume Share (%), by Type of Sequencing 2024 & 2032
- Figure 27: North America Next-Generation Sequencing Services Market Revenue (Million), by Product Type 2024 & 2032
- Figure 28: North America Next-Generation Sequencing Services Market Volume (K Units), by Product Type 2024 & 2032
- Figure 29: North America Next-Generation Sequencing Services Market Revenue Share (%), by Product Type 2024 & 2032
- Figure 30: North America Next-Generation Sequencing Services Market Volume Share (%), by Product Type 2024 & 2032
- Figure 31: North America Next-Generation Sequencing Services Market Revenue (Million), by End-User 2024 & 2032
- Figure 32: North America Next-Generation Sequencing Services Market Volume (K Units), by End-User 2024 & 2032
- Figure 33: North America Next-Generation Sequencing Services Market Revenue Share (%), by End-User 2024 & 2032
- Figure 34: North America Next-Generation Sequencing Services Market Volume Share (%), by End-User 2024 & 2032
- Figure 35: North America Next-Generation Sequencing Services Market Revenue (Million), by Application 2024 & 2032
- Figure 36: North America Next-Generation Sequencing Services Market Volume (K Units), by Application 2024 & 2032
- Figure 37: North America Next-Generation Sequencing Services Market Revenue Share (%), by Application 2024 & 2032
- Figure 38: North America Next-Generation Sequencing Services Market Volume Share (%), by Application 2024 & 2032
- Figure 39: North America Next-Generation Sequencing Services Market Revenue (Million), by Country 2024 & 2032
- Figure 40: North America Next-Generation Sequencing Services Market Volume (K Units), by Country 2024 & 2032
- Figure 41: North America Next-Generation Sequencing Services Market Revenue Share (%), by Country 2024 & 2032
- Figure 42: North America Next-Generation Sequencing Services Market Volume Share (%), by Country 2024 & 2032
- Figure 43: Europe Next-Generation Sequencing Services Market Revenue (Million), by Type of Sequencing 2024 & 2032
- Figure 44: Europe Next-Generation Sequencing Services Market Volume (K Units), by Type of Sequencing 2024 & 2032
- Figure 45: Europe Next-Generation Sequencing Services Market Revenue Share (%), by Type of Sequencing 2024 & 2032
- Figure 46: Europe Next-Generation Sequencing Services Market Volume Share (%), by Type of Sequencing 2024 & 2032
- Figure 47: Europe Next-Generation Sequencing Services Market Revenue (Million), by Product Type 2024 & 2032
- Figure 48: Europe Next-Generation Sequencing Services Market Volume (K Units), by Product Type 2024 & 2032
- Figure 49: Europe Next-Generation Sequencing Services Market Revenue Share (%), by Product Type 2024 & 2032
- Figure 50: Europe Next-Generation Sequencing Services Market Volume Share (%), by Product Type 2024 & 2032
- Figure 51: Europe Next-Generation Sequencing Services Market Revenue (Million), by End-User 2024 & 2032
- Figure 52: Europe Next-Generation Sequencing Services Market Volume (K Units), by End-User 2024 & 2032
- Figure 53: Europe Next-Generation Sequencing Services Market Revenue Share (%), by End-User 2024 & 2032
- Figure 54: Europe Next-Generation Sequencing Services Market Volume Share (%), by End-User 2024 & 2032
- Figure 55: Europe Next-Generation Sequencing Services Market Revenue (Million), by Application 2024 & 2032
- Figure 56: Europe Next-Generation Sequencing Services Market Volume (K Units), by Application 2024 & 2032
- Figure 57: Europe Next-Generation Sequencing Services Market Revenue Share (%), by Application 2024 & 2032
- Figure 58: Europe Next-Generation Sequencing Services Market Volume Share (%), by Application 2024 & 2032
- Figure 59: Europe Next-Generation Sequencing Services Market Revenue (Million), by Country 2024 & 2032
- Figure 60: Europe Next-Generation Sequencing Services Market Volume (K Units), by Country 2024 & 2032
- Figure 61: Europe Next-Generation Sequencing Services Market Revenue Share (%), by Country 2024 & 2032
- Figure 62: Europe Next-Generation Sequencing Services Market Volume Share (%), by Country 2024 & 2032
- Figure 63: Asia Pacific Next-Generation Sequencing Services Market Revenue (Million), by Type of Sequencing 2024 & 2032
- Figure 64: Asia Pacific Next-Generation Sequencing Services Market Volume (K Units), by Type of Sequencing 2024 & 2032
- Figure 65: Asia Pacific Next-Generation Sequencing Services Market Revenue Share (%), by Type of Sequencing 2024 & 2032
- Figure 66: Asia Pacific Next-Generation Sequencing Services Market Volume Share (%), by Type of Sequencing 2024 & 2032
- Figure 67: Asia Pacific Next-Generation Sequencing Services Market Revenue (Million), by Product Type 2024 & 2032
- Figure 68: Asia Pacific Next-Generation Sequencing Services Market Volume (K Units), by Product Type 2024 & 2032
- Figure 69: Asia Pacific Next-Generation Sequencing Services Market Revenue Share (%), by Product Type 2024 & 2032
- Figure 70: Asia Pacific Next-Generation Sequencing Services Market Volume Share (%), by Product Type 2024 & 2032
- Figure 71: Asia Pacific Next-Generation Sequencing Services Market Revenue (Million), by End-User 2024 & 2032
- Figure 72: Asia Pacific Next-Generation Sequencing Services Market Volume (K Units), by End-User 2024 & 2032
- Figure 73: Asia Pacific Next-Generation Sequencing Services Market Revenue Share (%), by End-User 2024 & 2032
- Figure 74: Asia Pacific Next-Generation Sequencing Services Market Volume Share (%), by End-User 2024 & 2032
- Figure 75: Asia Pacific Next-Generation Sequencing Services Market Revenue (Million), by Application 2024 & 2032
- Figure 76: Asia Pacific Next-Generation Sequencing Services Market Volume (K Units), by Application 2024 & 2032
- Figure 77: Asia Pacific Next-Generation Sequencing Services Market Revenue Share (%), by Application 2024 & 2032
- Figure 78: Asia Pacific Next-Generation Sequencing Services Market Volume Share (%), by Application 2024 & 2032
- Figure 79: Asia Pacific Next-Generation Sequencing Services Market Revenue (Million), by Country 2024 & 2032
- Figure 80: Asia Pacific Next-Generation Sequencing Services Market Volume (K Units), by Country 2024 & 2032
- Figure 81: Asia Pacific Next-Generation Sequencing Services Market Revenue Share (%), by Country 2024 & 2032
- Figure 82: Asia Pacific Next-Generation Sequencing Services Market Volume Share (%), by Country 2024 & 2032
- Figure 83: Middle East and Africa Next-Generation Sequencing Services Market Revenue (Million), by Type of Sequencing 2024 & 2032
- Figure 84: Middle East and Africa Next-Generation Sequencing Services Market Volume (K Units), by Type of Sequencing 2024 & 2032
- Figure 85: Middle East and Africa Next-Generation Sequencing Services Market Revenue Share (%), by Type of Sequencing 2024 & 2032
- Figure 86: Middle East and Africa Next-Generation Sequencing Services Market Volume Share (%), by Type of Sequencing 2024 & 2032
- Figure 87: Middle East and Africa Next-Generation Sequencing Services Market Revenue (Million), by Product Type 2024 & 2032
- Figure 88: Middle East and Africa Next-Generation Sequencing Services Market Volume (K Units), by Product Type 2024 & 2032
- Figure 89: Middle East and Africa Next-Generation Sequencing Services Market Revenue Share (%), by Product Type 2024 & 2032
- Figure 90: Middle East and Africa Next-Generation Sequencing Services Market Volume Share (%), by Product Type 2024 & 2032
- Figure 91: Middle East and Africa Next-Generation Sequencing Services Market Revenue (Million), by End-User 2024 & 2032
- Figure 92: Middle East and Africa Next-Generation Sequencing Services Market Volume (K Units), by End-User 2024 & 2032
- Figure 93: Middle East and Africa Next-Generation Sequencing Services Market Revenue Share (%), by End-User 2024 & 2032
- Figure 94: Middle East and Africa Next-Generation Sequencing Services Market Volume Share (%), by End-User 2024 & 2032
- Figure 95: Middle East and Africa Next-Generation Sequencing Services Market Revenue (Million), by Application 2024 & 2032
- Figure 96: Middle East and Africa Next-Generation Sequencing Services Market Volume (K Units), by Application 2024 & 2032
- Figure 97: Middle East and Africa Next-Generation Sequencing Services Market Revenue Share (%), by Application 2024 & 2032
- Figure 98: Middle East and Africa Next-Generation Sequencing Services Market Volume Share (%), by Application 2024 & 2032
- Figure 99: Middle East and Africa Next-Generation Sequencing Services Market Revenue (Million), by Country 2024 & 2032
- Figure 100: Middle East and Africa Next-Generation Sequencing Services Market Volume (K Units), by Country 2024 & 2032
- Figure 101: Middle East and Africa Next-Generation Sequencing Services Market Revenue Share (%), by Country 2024 & 2032
- Figure 102: Middle East and Africa Next-Generation Sequencing Services Market Volume Share (%), by Country 2024 & 2032
- Figure 103: South America Next-Generation Sequencing Services Market Revenue (Million), by Type of Sequencing 2024 & 2032
- Figure 104: South America Next-Generation Sequencing Services Market Volume (K Units), by Type of Sequencing 2024 & 2032
- Figure 105: South America Next-Generation Sequencing Services Market Revenue Share (%), by Type of Sequencing 2024 & 2032
- Figure 106: South America Next-Generation Sequencing Services Market Volume Share (%), by Type of Sequencing 2024 & 2032
- Figure 107: South America Next-Generation Sequencing Services Market Revenue (Million), by Product Type 2024 & 2032
- Figure 108: South America Next-Generation Sequencing Services Market Volume (K Units), by Product Type 2024 & 2032
- Figure 109: South America Next-Generation Sequencing Services Market Revenue Share (%), by Product Type 2024 & 2032
- Figure 110: South America Next-Generation Sequencing Services Market Volume Share (%), by Product Type 2024 & 2032
- Figure 111: South America Next-Generation Sequencing Services Market Revenue (Million), by End-User 2024 & 2032
- Figure 112: South America Next-Generation Sequencing Services Market Volume (K Units), by End-User 2024 & 2032
- Figure 113: South America Next-Generation Sequencing Services Market Revenue Share (%), by End-User 2024 & 2032
- Figure 114: South America Next-Generation Sequencing Services Market Volume Share (%), by End-User 2024 & 2032
- Figure 115: South America Next-Generation Sequencing Services Market Revenue (Million), by Application 2024 & 2032
- Figure 116: South America Next-Generation Sequencing Services Market Volume (K Units), by Application 2024 & 2032
- Figure 117: South America Next-Generation Sequencing Services Market Revenue Share (%), by Application 2024 & 2032
- Figure 118: South America Next-Generation Sequencing Services Market Volume Share (%), by Application 2024 & 2032
- Figure 119: South America Next-Generation Sequencing Services Market Revenue (Million), by Country 2024 & 2032
- Figure 120: South America Next-Generation Sequencing Services Market Volume (K Units), by Country 2024 & 2032
- Figure 121: South America Next-Generation Sequencing Services Market Revenue Share (%), by Country 2024 & 2032
- Figure 122: South America Next-Generation Sequencing Services Market Volume Share (%), by Country 2024 & 2032
List of Tables
- Table 1: Global Next-Generation Sequencing Services Market Revenue Million Forecast, by Region 2019 & 2032
- Table 2: Global Next-Generation Sequencing Services Market Volume K Units Forecast, by Region 2019 & 2032
- Table 3: Global Next-Generation Sequencing Services Market Revenue Million Forecast, by Type of Sequencing 2019 & 2032
- Table 4: Global Next-Generation Sequencing Services Market Volume K Units Forecast, by Type of Sequencing 2019 & 2032
- Table 5: Global Next-Generation Sequencing Services Market Revenue Million Forecast, by Product Type 2019 & 2032
- Table 6: Global Next-Generation Sequencing Services Market Volume K Units Forecast, by Product Type 2019 & 2032
- Table 7: Global Next-Generation Sequencing Services Market Revenue Million Forecast, by End-User 2019 & 2032
- Table 8: Global Next-Generation Sequencing Services Market Volume K Units Forecast, by End-User 2019 & 2032
- Table 9: Global Next-Generation Sequencing Services Market Revenue Million Forecast, by Application 2019 & 2032
- Table 10: Global Next-Generation Sequencing Services Market Volume K Units Forecast, by Application 2019 & 2032
- Table 11: Global Next-Generation Sequencing Services Market Revenue Million Forecast, by Region 2019 & 2032
- Table 12: Global Next-Generation Sequencing Services Market Volume K Units Forecast, by Region 2019 & 2032
- Table 13: Global Next-Generation Sequencing Services Market Revenue Million Forecast, by Country 2019 & 2032
- Table 14: Global Next-Generation Sequencing Services Market Volume K Units Forecast, by Country 2019 & 2032
- Table 15: United States Next-Generation Sequencing Services Market Revenue (Million) Forecast, by Application 2019 & 2032
- Table 16: United States Next-Generation Sequencing Services Market Volume (K Units) Forecast, by Application 2019 & 2032
- Table 17: Canada Next-Generation Sequencing Services Market Revenue (Million) Forecast, by Application 2019 & 2032
- Table 18: Canada Next-Generation Sequencing Services Market Volume (K Units) Forecast, by Application 2019 & 2032
- Table 19: Mexico Next-Generation Sequencing Services Market Revenue (Million) Forecast, by Application 2019 & 2032
- Table 20: Mexico Next-Generation Sequencing Services Market Volume (K Units) Forecast, by Application 2019 & 2032
- Table 21: Global Next-Generation Sequencing Services Market Revenue Million Forecast, by Country 2019 & 2032
- Table 22: Global Next-Generation Sequencing Services Market Volume K Units Forecast, by Country 2019 & 2032
- Table 23: Germany Next-Generation Sequencing Services Market Revenue (Million) Forecast, by Application 2019 & 2032
- Table 24: Germany Next-Generation Sequencing Services Market Volume (K Units) Forecast, by Application 2019 & 2032
- Table 25: United Kingdom Next-Generation Sequencing Services Market Revenue (Million) Forecast, by Application 2019 & 2032
- Table 26: United Kingdom Next-Generation Sequencing Services Market Volume (K Units) Forecast, by Application 2019 & 2032
- Table 27: France Next-Generation Sequencing Services Market Revenue (Million) Forecast, by Application 2019 & 2032
- Table 28: France Next-Generation Sequencing Services Market Volume (K Units) Forecast, by Application 2019 & 2032
- Table 29: Italy Next-Generation Sequencing Services Market Revenue (Million) Forecast, by Application 2019 & 2032
- Table 30: Italy Next-Generation Sequencing Services Market Volume (K Units) Forecast, by Application 2019 & 2032
- Table 31: Spain Next-Generation Sequencing Services Market Revenue (Million) Forecast, by Application 2019 & 2032
- Table 32: Spain Next-Generation Sequencing Services Market Volume (K Units) Forecast, by Application 2019 & 2032
- Table 33: Rest of Europe Next-Generation Sequencing Services Market Revenue (Million) Forecast, by Application 2019 & 2032
- Table 34: Rest of Europe Next-Generation Sequencing Services Market Volume (K Units) Forecast, by Application 2019 & 2032
- Table 35: Global Next-Generation Sequencing Services Market Revenue Million Forecast, by Country 2019 & 2032
- Table 36: Global Next-Generation Sequencing Services Market Volume K Units Forecast, by Country 2019 & 2032
- Table 37: China Next-Generation Sequencing Services Market Revenue (Million) Forecast, by Application 2019 & 2032
- Table 38: China Next-Generation Sequencing Services Market Volume (K Units) Forecast, by Application 2019 & 2032
- Table 39: Japan Next-Generation Sequencing Services Market Revenue (Million) Forecast, by Application 2019 & 2032
- Table 40: Japan Next-Generation Sequencing Services Market Volume (K Units) Forecast, by Application 2019 & 2032
- Table 41: India Next-Generation Sequencing Services Market Revenue (Million) Forecast, by Application 2019 & 2032
- Table 42: India Next-Generation Sequencing Services Market Volume (K Units) Forecast, by Application 2019 & 2032
- Table 43: Australia Next-Generation Sequencing Services Market Revenue (Million) Forecast, by Application 2019 & 2032
- Table 44: Australia Next-Generation Sequencing Services Market Volume (K Units) Forecast, by Application 2019 & 2032
- Table 45: South Korea Next-Generation Sequencing Services Market Revenue (Million) Forecast, by Application 2019 & 2032
- Table 46: South Korea Next-Generation Sequencing Services Market Volume (K Units) Forecast, by Application 2019 & 2032
- Table 47: Rest of Asia Pacific Next-Generation Sequencing Services Market Revenue (Million) Forecast, by Application 2019 & 2032
- Table 48: Rest of Asia Pacific Next-Generation Sequencing Services Market Volume (K Units) Forecast, by Application 2019 & 2032
- Table 49: Global Next-Generation Sequencing Services Market Revenue Million Forecast, by Country 2019 & 2032
- Table 50: Global Next-Generation Sequencing Services Market Volume K Units Forecast, by Country 2019 & 2032
- Table 51: GCC Next-Generation Sequencing Services Market Revenue (Million) Forecast, by Application 2019 & 2032
- Table 52: GCC Next-Generation Sequencing Services Market Volume (K Units) Forecast, by Application 2019 & 2032
- Table 53: South Africa Next-Generation Sequencing Services Market Revenue (Million) Forecast, by Application 2019 & 2032
- Table 54: South Africa Next-Generation Sequencing Services Market Volume (K Units) Forecast, by Application 2019 & 2032
- Table 55: Rest of Middle East and Africa Next-Generation Sequencing Services Market Revenue (Million) Forecast, by Application 2019 & 2032
- Table 56: Rest of Middle East and Africa Next-Generation Sequencing Services Market Volume (K Units) Forecast, by Application 2019 & 2032
- Table 57: Global Next-Generation Sequencing Services Market Revenue Million Forecast, by Country 2019 & 2032
- Table 58: Global Next-Generation Sequencing Services Market Volume K Units Forecast, by Country 2019 & 2032
- Table 59: Brazil Next-Generation Sequencing Services Market Revenue (Million) Forecast, by Application 2019 & 2032
- Table 60: Brazil Next-Generation Sequencing Services Market Volume (K Units) Forecast, by Application 2019 & 2032
- Table 61: Argentina Next-Generation Sequencing Services Market Revenue (Million) Forecast, by Application 2019 & 2032
- Table 62: Argentina Next-Generation Sequencing Services Market Volume (K Units) Forecast, by Application 2019 & 2032
- Table 63: Rest of South America Next-Generation Sequencing Services Market Revenue (Million) Forecast, by Application 2019 & 2032
- Table 64: Rest of South America Next-Generation Sequencing Services Market Volume (K Units) Forecast, by Application 2019 & 2032
- Table 65: Global Next-Generation Sequencing Services Market Revenue Million Forecast, by Type of Sequencing 2019 & 2032
- Table 66: Global Next-Generation Sequencing Services Market Volume K Units Forecast, by Type of Sequencing 2019 & 2032
- Table 67: Global Next-Generation Sequencing Services Market Revenue Million Forecast, by Product Type 2019 & 2032
- Table 68: Global Next-Generation Sequencing Services Market Volume K Units Forecast, by Product Type 2019 & 2032
- Table 69: Global Next-Generation Sequencing Services Market Revenue Million Forecast, by End-User 2019 & 2032
- Table 70: Global Next-Generation Sequencing Services Market Volume K Units Forecast, by End-User 2019 & 2032
- Table 71: Global Next-Generation Sequencing Services Market Revenue Million Forecast, by Application 2019 & 2032
- Table 72: Global Next-Generation Sequencing Services Market Volume K Units Forecast, by Application 2019 & 2032
- Table 73: Global Next-Generation Sequencing Services Market Revenue Million Forecast, by Country 2019 & 2032
- Table 74: Global Next-Generation Sequencing Services Market Volume K Units Forecast, by Country 2019 & 2032
- Table 75: United States Next-Generation Sequencing Services Market Revenue (Million) Forecast, by Application 2019 & 2032
- Table 76: United States Next-Generation Sequencing Services Market Volume (K Units) Forecast, by Application 2019 & 2032
- Table 77: Canada Next-Generation Sequencing Services Market Revenue (Million) Forecast, by Application 2019 & 2032
- Table 78: Canada Next-Generation Sequencing Services Market Volume (K Units) Forecast, by Application 2019 & 2032
- Table 79: Mexico Next-Generation Sequencing Services Market Revenue (Million) Forecast, by Application 2019 & 2032
- Table 80: Mexico Next-Generation Sequencing Services Market Volume (K Units) Forecast, by Application 2019 & 2032
- Table 81: Global Next-Generation Sequencing Services Market Revenue Million Forecast, by Type of Sequencing 2019 & 2032
- Table 82: Global Next-Generation Sequencing Services Market Volume K Units Forecast, by Type of Sequencing 2019 & 2032
- Table 83: Global Next-Generation Sequencing Services Market Revenue Million Forecast, by Product Type 2019 & 2032
- Table 84: Global Next-Generation Sequencing Services Market Volume K Units Forecast, by Product Type 2019 & 2032
- Table 85: Global Next-Generation Sequencing Services Market Revenue Million Forecast, by End-User 2019 & 2032
- Table 86: Global Next-Generation Sequencing Services Market Volume K Units Forecast, by End-User 2019 & 2032
- Table 87: Global Next-Generation Sequencing Services Market Revenue Million Forecast, by Application 2019 & 2032
- Table 88: Global Next-Generation Sequencing Services Market Volume K Units Forecast, by Application 2019 & 2032
- Table 89: Global Next-Generation Sequencing Services Market Revenue Million Forecast, by Country 2019 & 2032
- Table 90: Global Next-Generation Sequencing Services Market Volume K Units Forecast, by Country 2019 & 2032
- Table 91: Germany Next-Generation Sequencing Services Market Revenue (Million) Forecast, by Application 2019 & 2032
- Table 92: Germany Next-Generation Sequencing Services Market Volume (K Units) Forecast, by Application 2019 & 2032
- Table 93: United Kingdom Next-Generation Sequencing Services Market Revenue (Million) Forecast, by Application 2019 & 2032
- Table 94: United Kingdom Next-Generation Sequencing Services Market Volume (K Units) Forecast, by Application 2019 & 2032
- Table 95: France Next-Generation Sequencing Services Market Revenue (Million) Forecast, by Application 2019 & 2032
- Table 96: France Next-Generation Sequencing Services Market Volume (K Units) Forecast, by Application 2019 & 2032
- Table 97: Italy Next-Generation Sequencing Services Market Revenue (Million) Forecast, by Application 2019 & 2032
- Table 98: Italy Next-Generation Sequencing Services Market Volume (K Units) Forecast, by Application 2019 & 2032
- Table 99: Spain Next-Generation Sequencing Services Market Revenue (Million) Forecast, by Application 2019 & 2032
- Table 100: Spain Next-Generation Sequencing Services Market Volume (K Units) Forecast, by Application 2019 & 2032
- Table 101: Rest of Europe Next-Generation Sequencing Services Market Revenue (Million) Forecast, by Application 2019 & 2032
- Table 102: Rest of Europe Next-Generation Sequencing Services Market Volume (K Units) Forecast, by Application 2019 & 2032
- Table 103: Global Next-Generation Sequencing Services Market Revenue Million Forecast, by Type of Sequencing 2019 & 2032
- Table 104: Global Next-Generation Sequencing Services Market Volume K Units Forecast, by Type of Sequencing 2019 & 2032
- Table 105: Global Next-Generation Sequencing Services Market Revenue Million Forecast, by Product Type 2019 & 2032
- Table 106: Global Next-Generation Sequencing Services Market Volume K Units Forecast, by Product Type 2019 & 2032
- Table 107: Global Next-Generation Sequencing Services Market Revenue Million Forecast, by End-User 2019 & 2032
- Table 108: Global Next-Generation Sequencing Services Market Volume K Units Forecast, by End-User 2019 & 2032
- Table 109: Global Next-Generation Sequencing Services Market Revenue Million Forecast, by Application 2019 & 2032
- Table 110: Global Next-Generation Sequencing Services Market Volume K Units Forecast, by Application 2019 & 2032
- Table 111: Global Next-Generation Sequencing Services Market Revenue Million Forecast, by Country 2019 & 2032
- Table 112: Global Next-Generation Sequencing Services Market Volume K Units Forecast, by Country 2019 & 2032
- Table 113: China Next-Generation Sequencing Services Market Revenue (Million) Forecast, by Application 2019 & 2032
- Table 114: China Next-Generation Sequencing Services Market Volume (K Units) Forecast, by Application 2019 & 2032
- Table 115: Japan Next-Generation Sequencing Services Market Revenue (Million) Forecast, by Application 2019 & 2032
- Table 116: Japan Next-Generation Sequencing Services Market Volume (K Units) Forecast, by Application 2019 & 2032
- Table 117: India Next-Generation Sequencing Services Market Revenue (Million) Forecast, by Application 2019 & 2032
- Table 118: India Next-Generation Sequencing Services Market Volume (K Units) Forecast, by Application 2019 & 2032
- Table 119: Australia Next-Generation Sequencing Services Market Revenue (Million) Forecast, by Application 2019 & 2032
- Table 120: Australia Next-Generation Sequencing Services Market Volume (K Units) Forecast, by Application 2019 & 2032
- Table 121: South Korea Next-Generation Sequencing Services Market Revenue (Million) Forecast, by Application 2019 & 2032
- Table 122: South Korea Next-Generation Sequencing Services Market Volume (K Units) Forecast, by Application 2019 & 2032
- Table 123: Rest of Asia Pacific Next-Generation Sequencing Services Market Revenue (Million) Forecast, by Application 2019 & 2032
- Table 124: Rest of Asia Pacific Next-Generation Sequencing Services Market Volume (K Units) Forecast, by Application 2019 & 2032
- Table 125: Global Next-Generation Sequencing Services Market Revenue Million Forecast, by Type of Sequencing 2019 & 2032
- Table 126: Global Next-Generation Sequencing Services Market Volume K Units Forecast, by Type of Sequencing 2019 & 2032
- Table 127: Global Next-Generation Sequencing Services Market Revenue Million Forecast, by Product Type 2019 & 2032
- Table 128: Global Next-Generation Sequencing Services Market Volume K Units Forecast, by Product Type 2019 & 2032
- Table 129: Global Next-Generation Sequencing Services Market Revenue Million Forecast, by End-User 2019 & 2032
- Table 130: Global Next-Generation Sequencing Services Market Volume K Units Forecast, by End-User 2019 & 2032
- Table 131: Global Next-Generation Sequencing Services Market Revenue Million Forecast, by Application 2019 & 2032
- Table 132: Global Next-Generation Sequencing Services Market Volume K Units Forecast, by Application 2019 & 2032
- Table 133: Global Next-Generation Sequencing Services Market Revenue Million Forecast, by Country 2019 & 2032
- Table 134: Global Next-Generation Sequencing Services Market Volume K Units Forecast, by Country 2019 & 2032
- Table 135: GCC Next-Generation Sequencing Services Market Revenue (Million) Forecast, by Application 2019 & 2032
- Table 136: GCC Next-Generation Sequencing Services Market Volume (K Units) Forecast, by Application 2019 & 2032
- Table 137: South Africa Next-Generation Sequencing Services Market Revenue (Million) Forecast, by Application 2019 & 2032
- Table 138: South Africa Next-Generation Sequencing Services Market Volume (K Units) Forecast, by Application 2019 & 2032
- Table 139: Rest of Middle East and Africa Next-Generation Sequencing Services Market Revenue (Million) Forecast, by Application 2019 & 2032
- Table 140: Rest of Middle East and Africa Next-Generation Sequencing Services Market Volume (K Units) Forecast, by Application 2019 & 2032
- Table 141: Global Next-Generation Sequencing Services Market Revenue Million Forecast, by Type of Sequencing 2019 & 2032
- Table 142: Global Next-Generation Sequencing Services Market Volume K Units Forecast, by Type of Sequencing 2019 & 2032
- Table 143: Global Next-Generation Sequencing Services Market Revenue Million Forecast, by Product Type 2019 & 2032
- Table 144: Global Next-Generation Sequencing Services Market Volume K Units Forecast, by Product Type 2019 & 2032
- Table 145: Global Next-Generation Sequencing Services Market Revenue Million Forecast, by End-User 2019 & 2032
- Table 146: Global Next-Generation Sequencing Services Market Volume K Units Forecast, by End-User 2019 & 2032
- Table 147: Global Next-Generation Sequencing Services Market Revenue Million Forecast, by Application 2019 & 2032
- Table 148: Global Next-Generation Sequencing Services Market Volume K Units Forecast, by Application 2019 & 2032
- Table 149: Global Next-Generation Sequencing Services Market Revenue Million Forecast, by Country 2019 & 2032
- Table 150: Global Next-Generation Sequencing Services Market Volume K Units Forecast, by Country 2019 & 2032
- Table 151: Brazil Next-Generation Sequencing Services Market Revenue (Million) Forecast, by Application 2019 & 2032
- Table 152: Brazil Next-Generation Sequencing Services Market Volume (K Units) Forecast, by Application 2019 & 2032
- Table 153: Argentina Next-Generation Sequencing Services Market Revenue (Million) Forecast, by Application 2019 & 2032
- Table 154: Argentina Next-Generation Sequencing Services Market Volume (K Units) Forecast, by Application 2019 & 2032
- Table 155: Rest of South America Next-Generation Sequencing Services Market Revenue (Million) Forecast, by Application 2019 & 2032
- Table 156: Rest of South America Next-Generation Sequencing Services Market Volume (K Units) Forecast, by Application 2019 & 2032
Frequently Asked Questions
1. What is the projected Compound Annual Growth Rate (CAGR) of the Next-Generation Sequencing Services Market?
The projected CAGR is approximately 13.43%.
2. Which companies are prominent players in the Next-Generation Sequencing Services Market?
Key companies in the market include DNASTAR Inc, Bio-Rad Laboratories Inc, F Hoffmann-La Roche Ltd, Eurofins Scientific, Macrogen Inc, Thermo Fisher Scientific Inc, Qiagen, PerkinElmer Inc, Illumina Inc, Pacific Biosciences of California Inc, CD Genomics, Agilent Technologies.
3. What are the main segments of the Next-Generation Sequencing Services Market?
The market segments include Type of Sequencing, Product Type, End-User, Application.
4. Can you provide details about the market size?
The market size is estimated to be USD 10.47 Million as of 2022.
5. What are some drivers contributing to market growth?
Increasing Applications in Clinical Diagnosis and Speed. Cost. and Accuracy; Increasing Efficiency when Compared To Traditional Technologies Such As Microarrays and Rising Drug Discovery Applications.
6. What are the notable trends driving market growth?
The Whole Genome Sequencing Segment is Expected to Grow at a Significant Rate Over the Forecast Period.
7. Are there any restraints impacting market growth?
Legal and Ethical Issues; Interpretation of Complex Data and Lack of Skilled Professionals.
8. Can you provide examples of recent developments in the market?
January 2023: QIAGEN announced a strategic partnership with California-based population genomics leader Helix to advance next-generation sequencing companion diagnostics in hereditary diseases.
9. What pricing options are available for accessing the report?
Pricing options include single-user, multi-user, and enterprise licenses priced at USD 4750, USD 5250, and USD 8750 respectively.
10. Is the market size provided in terms of value or volume?
The market size is provided in terms of value, measured in Million and volume, measured in K Units.
11. Are there any specific market keywords associated with the report?
Yes, the market keyword associated with the report is "Next-Generation Sequencing Services Market," which aids in identifying and referencing the specific market segment covered.
12. How do I determine which pricing option suits my needs best?
The pricing options vary based on user requirements and access needs. Individual users may opt for single-user licenses, while businesses requiring broader access may choose multi-user or enterprise licenses for cost-effective access to the report.
13. Are there any additional resources or data provided in the Next-Generation Sequencing Services Market report?
While the report offers comprehensive insights, it's advisable to review the specific contents or supplementary materials provided to ascertain if additional resources or data are available.
14. How can I stay updated on further developments or reports in the Next-Generation Sequencing Services Market?
To stay informed about further developments, trends, and reports in the Next-Generation Sequencing Services Market, consider subscribing to industry newsletters, following relevant companies and organizations, or regularly checking reputable industry news sources and publications.
Methodology
Step 1 - Identification of Relevant Samples Size from Population Database


Step 2 - Approaches for Defining Global Market Size (Value, Volume* & Price*)

Note*: In applicable scenarios
Step 3 - Data Sources
Primary Research
- Web Analytics
- Survey Reports
- Research Institute
- Latest Research Reports
- Opinion Leaders
Secondary Research
- Annual Reports
- White Paper
- Latest Press Release
- Industry Association
- Paid Database
- Investor Presentations

Step 4 - Data Triangulation
Involves using different sources of information in order to increase the validity of a study
These sources are likely to be stakeholders in a program - participants, other researchers, program staff, other community members, and so on.
Then we put all data in single framework & apply various statistical tools to find out the dynamic on the market.
During the analysis stage, feedback from the stakeholder groups would be compared to determine areas of agreement as well as areas of divergence


