
Key Insights
The North American AUV (Autonomous Underwater Vehicle) and ROV (Remotely Operated Vehicle) market is experiencing robust growth, driven by increasing offshore energy exploration and production activities, particularly in the oil and gas sector. The region's well-established infrastructure, coupled with significant investments in technological advancements within the subsea robotics industry, fuels market expansion. The demand for efficient and cost-effective subsea inspection, repair, and maintenance (IRM) services, alongside the growing need for data acquisition in challenging underwater environments, further contributes to market growth. Work-class ROVs dominate the market due to their versatility and capacity for handling complex subsea operations. However, the AUV segment is witnessing significant traction due to its ability to conduct autonomous surveys and inspections over larger areas, reducing operational costs and improving safety. Furthermore, the increasing focus on decommissioning aging offshore infrastructure presents a significant opportunity for both AUV and ROV technologies. While the initial capital investment for AUV and ROV systems can be substantial, the long-term benefits in terms of efficiency and reduced human intervention make them attractive investments for operators. The market is expected to witness increased adoption of advanced technologies, including AI and machine learning, for improved data analysis and automation of subsea operations.
The competitive landscape is characterized by a mix of established players and emerging technology companies. Major players are focusing on expanding their service offerings and geographical reach to capture a larger market share. Strategic partnerships and collaborations are also becoming increasingly common to facilitate technological advancements and gain access to new markets. The market is segmented by vehicle type (AUV, ROV), vehicle class (work-class, observatory-class), application (oil and gas, defense, others), and activity (drilling, construction, IRM, decommissioning, others). While the oil and gas sector remains the dominant application, growing interest in underwater infrastructure surveys for renewable energy projects and defense applications presents significant growth opportunities. North America's strong regulatory framework and commitment to offshore safety also contribute to the market's positive outlook. Considering a 7.13% CAGR and a projected market size in the millions, we can project substantial market expansion throughout the forecast period.
North America AUV and ROV Market Report: 2019-2033
This comprehensive report provides an in-depth analysis of the North America AUV and ROV market, offering invaluable insights for industry professionals, investors, and strategic decision-makers. Covering the period from 2019 to 2033, with a base year of 2025, this report meticulously examines market dynamics, key players, technological advancements, and future growth prospects.
North America AUV and ROV Market Structure & Innovation Trends
This section analyzes the competitive landscape of the North American AUV and ROV market, focusing on market concentration, innovation drivers, regulatory frameworks, and M&A activities. The market is moderately concentrated, with several key players holding significant market share. However, the presence of numerous smaller companies and ongoing innovation indicates a dynamic and competitive environment.
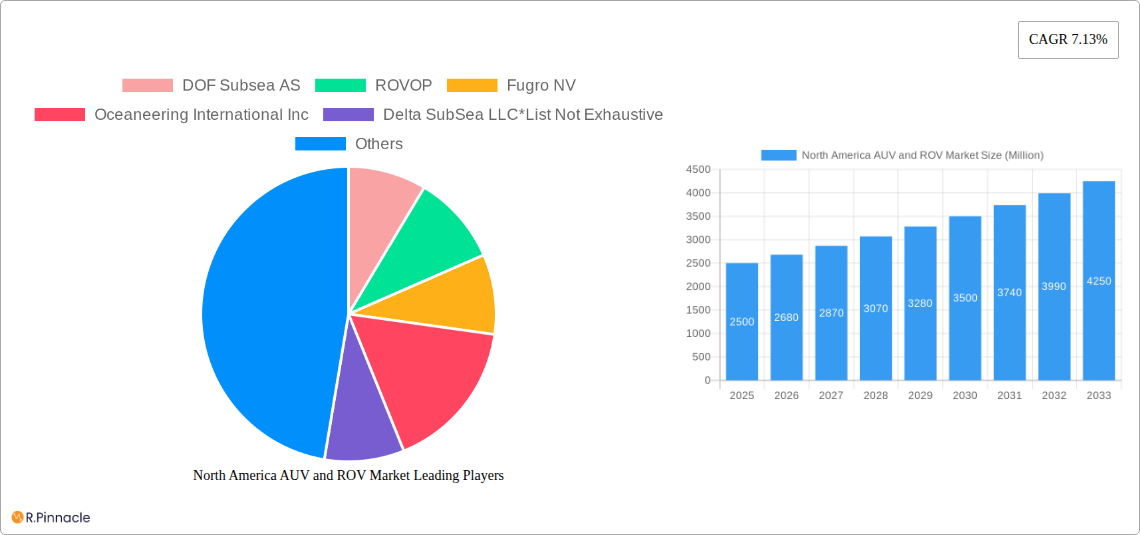
Market Concentration: The top 5 companies (DOF Subsea AS, ROVOP, Fugro NV, Oceaneering International Inc, and Saipem SpA) collectively hold an estimated xx% market share in 2025. This share is projected to fluctuate slightly by 2033 due to ongoing M&A activity and the emergence of new players.
Innovation Drivers: Technological advancements such as improved sensor technology, AI-powered autonomy, and enhanced underwater communication systems are major drivers of innovation. Regulatory frameworks, while generally supportive of technological advancements, present certain compliance requirements. The development of environmentally friendly and sustainable solutions is another critical innovation driver.
M&A Activity: The North American AUV and ROV market has witnessed significant M&A activity in recent years. While precise deal values are confidential, these transactions reflect the consolidation and expansion strategies of industry leaders. For example, the merger of [insert example if data available] resulted in a significant increase in market share. These mergers consolidate resources and expertise, accelerating the pace of innovation.
Product Substitutes: While direct substitutes are limited, alternative technologies such as remotely operated underwater vehicles (ROVs) partially fill the market niche, especially in specific applications. The competition between AUVs and ROVs is another key aspect of this market.
End-User Demographics: The primary end-users include oil and gas companies, defense agencies, and research institutions. The increasing demand for subsea infrastructure development and maintenance is fueling market growth.
North America AUV and ROV Market Market Dynamics & Trends
This section delves into the market dynamics of the North American AUV and ROV sector, focusing on market growth drivers, technological disruptions, and competitive dynamics. The market is experiencing robust growth, driven by several factors.
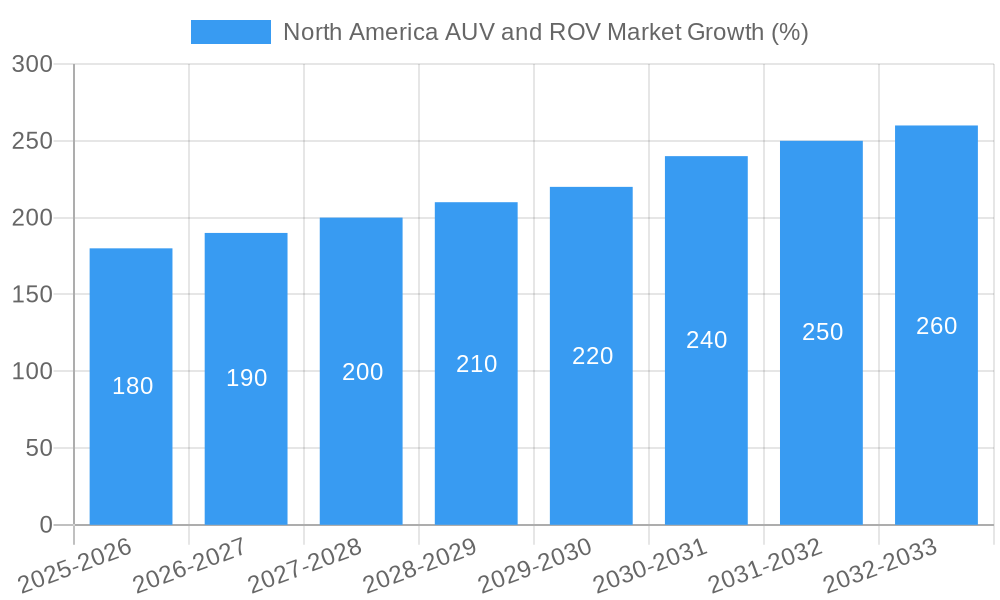
The market is witnessing a Compound Annual Growth Rate (CAGR) of xx% during the forecast period (2025-2033). This growth is fueled by increasing demand from the oil and gas sector, expansion of underwater infrastructure projects, and heightened focus on subsea surveys. Market penetration for both AUVs and ROVs is steadily increasing, especially in applications requiring enhanced operational efficiency, safety, and data acquisition. Technological disruptions, such as the adoption of artificial intelligence and machine learning, are significantly altering operational processes and improving data analysis capabilities. Furthermore, consumer preferences are shifting towards more efficient, versatile, and environmentally friendly systems. The competitive dynamics are characterized by intense rivalry among established players and the emergence of new entrants offering innovative technologies.
Dominant Regions & Segments in North America AUV and ROV Market
This section identifies the dominant regions, countries, and segments within the North America AUV and ROV market. The Gulf of Mexico stands out as a key region, driven by significant oil and gas exploration and production activities.
- Leading Region: The Gulf of Mexico
- Leading Country: United States
Dominant Segments:
- Vehicle Type: ROVs currently hold a larger market share compared to AUVs due to their versatility and established track record. However, AUV adoption is expected to increase significantly driven by technological advancements.
- Vehicle Class: Work-class vehicles dominate the market due to their capabilities in handling complex tasks. Observatory-class vehicles occupy a smaller share of the market but show promise for niche applications such as scientific research.
- Application: The oil and gas sector constitutes the largest application segment, although defense applications are also witnessing strong growth due to increased investment in underwater surveillance and defense systems.
- Activity: Inspection, Repair, and Maintenance (IRM) activities currently drive the market, accounting for a significant portion of the total revenue. Drilling and development activities also contribute significantly, followed by construction and decommissioning.
Key Drivers for Dominant Regions/Segments:
- Economic Policies: Government support for offshore energy exploration and investment in defense and research initiatives play a crucial role in boosting regional and segmental growth.
- Infrastructure: Well-established oil and gas infrastructure in the Gulf of Mexico provides a strong foundation for AUV and ROV deployment.
North America AUV and ROV Market Product Innovations
Recent advancements focus on enhancing autonomy, improving sensor capabilities, and integrating AI for real-time data analysis. Miniaturization, improved maneuverability, and the development of more robust and reliable systems are additional key trends. This aligns with increasing market demand for efficient, cost-effective, and environmentally friendly solutions.
Report Scope & Segmentation Analysis
This report provides a comprehensive analysis of the North America AUV and ROV market, segmented by vehicle type (ROV, AUV), vehicle class (work-class, observatory-class), application (oil and gas, defense, other applications), and activity (drilling and development, construction, IRM, decommissioning, other activities). Growth projections, market sizes, and competitive dynamics are analyzed for each segment, offering detailed insights into market trends and opportunities.
Key Drivers of North America AUV and ROV Market Growth
The market’s growth is propelled by factors including the rising demand for subsea exploration and production in the oil and gas sector, increasing defense spending on underwater surveillance systems, advancements in underwater robotics technology, and the growing adoption of AUVs for various applications.
Challenges in the North America AUV and ROV Market Sector
Challenges include high initial investment costs for advanced systems, stringent safety and regulatory requirements, and dependence on skilled personnel for operation and maintenance. Supply chain disruptions and competition from alternative technologies also pose significant challenges. These factors influence market growth and adoption rates.
Emerging Opportunities in North America AUV and ROV Market
Emerging opportunities lie in the expanding applications of AUVs for various tasks, including environmental monitoring and scientific research. The integration of AI and machine learning into AUV and ROV systems offers significant potential for enhancing operational efficiency and data analysis. Furthermore, the development of environmentally friendly and sustainable systems is poised to open up new avenues for growth.
Leading Players in the North America AUV and ROV Market Market
- DOF Subsea AS
- ROVOP
- Fugro NV
- Oceaneering International Inc
- Delta SubSea LLC
- Saipem SpA
- DeepOcean AS
- Helix Energy Solutions Group
- Forum Energy Technologies Inc
- TechnipFMC PLC
Key Developments in North America AUV and ROV Market Industry
- August 2022: VideoRay, LLC received a large order for its Defender ROVs from the U.S. Navy, highlighting the growing demand for advanced ROV systems in the defense sector.
- March 2021: Oceaneering International, Inc. secured a contract for providing ROV services in the Gulf of Mexico, demonstrating the continued demand for ROVs in oil and gas operations.
Future Outlook for North America AUV and ROV Market Market
The North America AUV and ROV market is poised for sustained growth, driven by technological advancements, increased demand from various sectors, and government initiatives promoting subsea exploration and development. Strategic partnerships and collaborations among industry players are expected to shape the market's future, leading to innovative solutions and enhanced market penetration. The market's future growth will depend heavily on continued innovation and efficient management of emerging technological trends.
North America AUV and ROV Market Segmentation
-
1. Vehicle Type
- 1.1. ROV
- 1.2. AUV
-
2. Vehicle Class
- 2.1. Work-class Vehicle
- 2.2. Observatory-class Vehicle
-
3. Application
- 3.1. Oil and Gas
- 3.2. Defense
- 3.3. Other Applications
-
4. Activity
- 4.1. Drilling and Development
- 4.2. Construction
- 4.3. Inspection, Repair, and Maintenance
- 4.4. Decommissioning
- 4.5. Other Activities
-
5. Geography
- 5.1. United States
- 5.2. Canada
- 5.3. Rest of North America
North America AUV and ROV Market Segmentation By Geography
- 1. United States
- 2. Canada
- 3. Rest of North America
North America AUV and ROV Market REPORT HIGHLIGHTS
| Aspects | Details |
|---|---|
| Study Period | 2019-2033 |
| Base Year | 2024 |
| Estimated Year | 2025 |
| Forecast Period | 2025-2033 |
| Historical Period | 2019-2024 |
| Growth Rate | CAGR of 7.13% from 2019-2033 |
| Segmentation |
|
Table of Contents
- 1. Introduction
- 1.1. Research Scope
- 1.2. Market Segmentation
- 1.3. Research Methodology
- 1.4. Definitions and Assumptions
- 2. Executive Summary
- 2.1. Introduction
- 3. Market Dynamics
- 3.1. Introduction
- 3.2. Market Drivers
- 3.2.1 Increasing Offshore Oil and Gas Exploration Activities in the American
- 3.2.2 Asia-Pacific
- 3.2.3 and Middle East and African Regions4.; Growing Offshore Renewable Technologies
- 3.3. Market Restrains
- 3.3.1. Ban on Offshore Exploration and Production Activities in Multiple Regions
- 3.4. Market Trends
- 3.4.1 Inspection
- 3.4.2 Repair
- 3.4.3 and Maintenance Activity to Witness Significant Growth
- 4. Market Factor Analysis
- 4.1. Porters Five Forces
- 4.2. Supply/Value Chain
- 4.3. PESTEL analysis
- 4.4. Market Entropy
- 4.5. Patent/Trademark Analysis
- 5. North America AUV and ROV Market Analysis, Insights and Forecast, 2019-2031
- 5.1. Market Analysis, Insights and Forecast - by Vehicle Type
- 5.1.1. ROV
- 5.1.2. AUV
- 5.2. Market Analysis, Insights and Forecast - by Vehicle Class
- 5.2.1. Work-class Vehicle
- 5.2.2. Observatory-class Vehicle
- 5.3. Market Analysis, Insights and Forecast - by Application
- 5.3.1. Oil and Gas
- 5.3.2. Defense
- 5.3.3. Other Applications
- 5.4. Market Analysis, Insights and Forecast - by Activity
- 5.4.1. Drilling and Development
- 5.4.2. Construction
- 5.4.3. Inspection, Repair, and Maintenance
- 5.4.4. Decommissioning
- 5.4.5. Other Activities
- 5.5. Market Analysis, Insights and Forecast - by Geography
- 5.5.1. United States
- 5.5.2. Canada
- 5.5.3. Rest of North America
- 5.6. Market Analysis, Insights and Forecast - by Region
- 5.6.1. United States
- 5.6.2. Canada
- 5.6.3. Rest of North America
- 5.1. Market Analysis, Insights and Forecast - by Vehicle Type
- 6. United States North America AUV and ROV Market Analysis, Insights and Forecast, 2019-2031
- 6.1. Market Analysis, Insights and Forecast - by Vehicle Type
- 6.1.1. ROV
- 6.1.2. AUV
- 6.2. Market Analysis, Insights and Forecast - by Vehicle Class
- 6.2.1. Work-class Vehicle
- 6.2.2. Observatory-class Vehicle
- 6.3. Market Analysis, Insights and Forecast - by Application
- 6.3.1. Oil and Gas
- 6.3.2. Defense
- 6.3.3. Other Applications
- 6.4. Market Analysis, Insights and Forecast - by Activity
- 6.4.1. Drilling and Development
- 6.4.2. Construction
- 6.4.3. Inspection, Repair, and Maintenance
- 6.4.4. Decommissioning
- 6.4.5. Other Activities
- 6.5. Market Analysis, Insights and Forecast - by Geography
- 6.5.1. United States
- 6.5.2. Canada
- 6.5.3. Rest of North America
- 6.1. Market Analysis, Insights and Forecast - by Vehicle Type
- 7. Canada North America AUV and ROV Market Analysis, Insights and Forecast, 2019-2031
- 7.1. Market Analysis, Insights and Forecast - by Vehicle Type
- 7.1.1. ROV
- 7.1.2. AUV
- 7.2. Market Analysis, Insights and Forecast - by Vehicle Class
- 7.2.1. Work-class Vehicle
- 7.2.2. Observatory-class Vehicle
- 7.3. Market Analysis, Insights and Forecast - by Application
- 7.3.1. Oil and Gas
- 7.3.2. Defense
- 7.3.3. Other Applications
- 7.4. Market Analysis, Insights and Forecast - by Activity
- 7.4.1. Drilling and Development
- 7.4.2. Construction
- 7.4.3. Inspection, Repair, and Maintenance
- 7.4.4. Decommissioning
- 7.4.5. Other Activities
- 7.5. Market Analysis, Insights and Forecast - by Geography
- 7.5.1. United States
- 7.5.2. Canada
- 7.5.3. Rest of North America
- 7.1. Market Analysis, Insights and Forecast - by Vehicle Type
- 8. Rest of North America North America AUV and ROV Market Analysis, Insights and Forecast, 2019-2031
- 8.1. Market Analysis, Insights and Forecast - by Vehicle Type
- 8.1.1. ROV
- 8.1.2. AUV
- 8.2. Market Analysis, Insights and Forecast - by Vehicle Class
- 8.2.1. Work-class Vehicle
- 8.2.2. Observatory-class Vehicle
- 8.3. Market Analysis, Insights and Forecast - by Application
- 8.3.1. Oil and Gas
- 8.3.2. Defense
- 8.3.3. Other Applications
- 8.4. Market Analysis, Insights and Forecast - by Activity
- 8.4.1. Drilling and Development
- 8.4.2. Construction
- 8.4.3. Inspection, Repair, and Maintenance
- 8.4.4. Decommissioning
- 8.4.5. Other Activities
- 8.5. Market Analysis, Insights and Forecast - by Geography
- 8.5.1. United States
- 8.5.2. Canada
- 8.5.3. Rest of North America
- 8.1. Market Analysis, Insights and Forecast - by Vehicle Type
- 9. United States North America AUV and ROV Market Analysis, Insights and Forecast, 2019-2031
- 10. Canada North America AUV and ROV Market Analysis, Insights and Forecast, 2019-2031
- 11. Mexico North America AUV and ROV Market Analysis, Insights and Forecast, 2019-2031
- 12. Rest of North America North America AUV and ROV Market Analysis, Insights and Forecast, 2019-2031
- 13. Competitive Analysis
- 13.1. Market Share Analysis 2024
- 13.2. Company Profiles
- 13.2.1 DOF Subsea AS
- 13.2.1.1. Overview
- 13.2.1.2. Products
- 13.2.1.3. SWOT Analysis
- 13.2.1.4. Recent Developments
- 13.2.1.5. Financials (Based on Availability)
- 13.2.2 ROVOP
- 13.2.2.1. Overview
- 13.2.2.2. Products
- 13.2.2.3. SWOT Analysis
- 13.2.2.4. Recent Developments
- 13.2.2.5. Financials (Based on Availability)
- 13.2.3 Fugro NV
- 13.2.3.1. Overview
- 13.2.3.2. Products
- 13.2.3.3. SWOT Analysis
- 13.2.3.4. Recent Developments
- 13.2.3.5. Financials (Based on Availability)
- 13.2.4 Oceaneering International Inc
- 13.2.4.1. Overview
- 13.2.4.2. Products
- 13.2.4.3. SWOT Analysis
- 13.2.4.4. Recent Developments
- 13.2.4.5. Financials (Based on Availability)
- 13.2.5 Delta SubSea LLC*List Not Exhaustive
- 13.2.5.1. Overview
- 13.2.5.2. Products
- 13.2.5.3. SWOT Analysis
- 13.2.5.4. Recent Developments
- 13.2.5.5. Financials (Based on Availability)
- 13.2.6 Saipem SpA
- 13.2.6.1. Overview
- 13.2.6.2. Products
- 13.2.6.3. SWOT Analysis
- 13.2.6.4. Recent Developments
- 13.2.6.5. Financials (Based on Availability)
- 13.2.7 DeepOcean AS
- 13.2.7.1. Overview
- 13.2.7.2. Products
- 13.2.7.3. SWOT Analysis
- 13.2.7.4. Recent Developments
- 13.2.7.5. Financials (Based on Availability)
- 13.2.8 Helix Energy Solutions Group
- 13.2.8.1. Overview
- 13.2.8.2. Products
- 13.2.8.3. SWOT Analysis
- 13.2.8.4. Recent Developments
- 13.2.8.5. Financials (Based on Availability)
- 13.2.9 Forum Energy Technologies Inc
- 13.2.9.1. Overview
- 13.2.9.2. Products
- 13.2.9.3. SWOT Analysis
- 13.2.9.4. Recent Developments
- 13.2.9.5. Financials (Based on Availability)
- 13.2.10 TechnipFMC PLC
- 13.2.10.1. Overview
- 13.2.10.2. Products
- 13.2.10.3. SWOT Analysis
- 13.2.10.4. Recent Developments
- 13.2.10.5. Financials (Based on Availability)
- 13.2.1 DOF Subsea AS
List of Figures
- Figure 1: North America AUV and ROV Market Revenue Breakdown (Million, %) by Product 2024 & 2032
- Figure 2: North America AUV and ROV Market Share (%) by Company 2024
List of Tables
- Table 1: North America AUV and ROV Market Revenue Million Forecast, by Region 2019 & 2032
- Table 2: North America AUV and ROV Market Volume K Unit Forecast, by Region 2019 & 2032
- Table 3: North America AUV and ROV Market Revenue Million Forecast, by Vehicle Type 2019 & 2032
- Table 4: North America AUV and ROV Market Volume K Unit Forecast, by Vehicle Type 2019 & 2032
- Table 5: North America AUV and ROV Market Revenue Million Forecast, by Vehicle Class 2019 & 2032
- Table 6: North America AUV and ROV Market Volume K Unit Forecast, by Vehicle Class 2019 & 2032
- Table 7: North America AUV and ROV Market Revenue Million Forecast, by Application 2019 & 2032
- Table 8: North America AUV and ROV Market Volume K Unit Forecast, by Application 2019 & 2032
- Table 9: North America AUV and ROV Market Revenue Million Forecast, by Activity 2019 & 2032
- Table 10: North America AUV and ROV Market Volume K Unit Forecast, by Activity 2019 & 2032
- Table 11: North America AUV and ROV Market Revenue Million Forecast, by Geography 2019 & 2032
- Table 12: North America AUV and ROV Market Volume K Unit Forecast, by Geography 2019 & 2032
- Table 13: North America AUV and ROV Market Revenue Million Forecast, by Region 2019 & 2032
- Table 14: North America AUV and ROV Market Volume K Unit Forecast, by Region 2019 & 2032
- Table 15: North America AUV and ROV Market Revenue Million Forecast, by Country 2019 & 2032
- Table 16: North America AUV and ROV Market Volume K Unit Forecast, by Country 2019 & 2032
- Table 17: United States North America AUV and ROV Market Revenue (Million) Forecast, by Application 2019 & 2032
- Table 18: United States North America AUV and ROV Market Volume (K Unit) Forecast, by Application 2019 & 2032
- Table 19: Canada North America AUV and ROV Market Revenue (Million) Forecast, by Application 2019 & 2032
- Table 20: Canada North America AUV and ROV Market Volume (K Unit) Forecast, by Application 2019 & 2032
- Table 21: Mexico North America AUV and ROV Market Revenue (Million) Forecast, by Application 2019 & 2032
- Table 22: Mexico North America AUV and ROV Market Volume (K Unit) Forecast, by Application 2019 & 2032
- Table 23: Rest of North America North America AUV and ROV Market Revenue (Million) Forecast, by Application 2019 & 2032
- Table 24: Rest of North America North America AUV and ROV Market Volume (K Unit) Forecast, by Application 2019 & 2032
- Table 25: North America AUV and ROV Market Revenue Million Forecast, by Vehicle Type 2019 & 2032
- Table 26: North America AUV and ROV Market Volume K Unit Forecast, by Vehicle Type 2019 & 2032
- Table 27: North America AUV and ROV Market Revenue Million Forecast, by Vehicle Class 2019 & 2032
- Table 28: North America AUV and ROV Market Volume K Unit Forecast, by Vehicle Class 2019 & 2032
- Table 29: North America AUV and ROV Market Revenue Million Forecast, by Application 2019 & 2032
- Table 30: North America AUV and ROV Market Volume K Unit Forecast, by Application 2019 & 2032
- Table 31: North America AUV and ROV Market Revenue Million Forecast, by Activity 2019 & 2032
- Table 32: North America AUV and ROV Market Volume K Unit Forecast, by Activity 2019 & 2032
- Table 33: North America AUV and ROV Market Revenue Million Forecast, by Geography 2019 & 2032
- Table 34: North America AUV and ROV Market Volume K Unit Forecast, by Geography 2019 & 2032
- Table 35: North America AUV and ROV Market Revenue Million Forecast, by Country 2019 & 2032
- Table 36: North America AUV and ROV Market Volume K Unit Forecast, by Country 2019 & 2032
- Table 37: North America AUV and ROV Market Revenue Million Forecast, by Vehicle Type 2019 & 2032
- Table 38: North America AUV and ROV Market Volume K Unit Forecast, by Vehicle Type 2019 & 2032
- Table 39: North America AUV and ROV Market Revenue Million Forecast, by Vehicle Class 2019 & 2032
- Table 40: North America AUV and ROV Market Volume K Unit Forecast, by Vehicle Class 2019 & 2032
- Table 41: North America AUV and ROV Market Revenue Million Forecast, by Application 2019 & 2032
- Table 42: North America AUV and ROV Market Volume K Unit Forecast, by Application 2019 & 2032
- Table 43: North America AUV and ROV Market Revenue Million Forecast, by Activity 2019 & 2032
- Table 44: North America AUV and ROV Market Volume K Unit Forecast, by Activity 2019 & 2032
- Table 45: North America AUV and ROV Market Revenue Million Forecast, by Geography 2019 & 2032
- Table 46: North America AUV and ROV Market Volume K Unit Forecast, by Geography 2019 & 2032
- Table 47: North America AUV and ROV Market Revenue Million Forecast, by Country 2019 & 2032
- Table 48: North America AUV and ROV Market Volume K Unit Forecast, by Country 2019 & 2032
- Table 49: North America AUV and ROV Market Revenue Million Forecast, by Vehicle Type 2019 & 2032
- Table 50: North America AUV and ROV Market Volume K Unit Forecast, by Vehicle Type 2019 & 2032
- Table 51: North America AUV and ROV Market Revenue Million Forecast, by Vehicle Class 2019 & 2032
- Table 52: North America AUV and ROV Market Volume K Unit Forecast, by Vehicle Class 2019 & 2032
- Table 53: North America AUV and ROV Market Revenue Million Forecast, by Application 2019 & 2032
- Table 54: North America AUV and ROV Market Volume K Unit Forecast, by Application 2019 & 2032
- Table 55: North America AUV and ROV Market Revenue Million Forecast, by Activity 2019 & 2032
- Table 56: North America AUV and ROV Market Volume K Unit Forecast, by Activity 2019 & 2032
- Table 57: North America AUV and ROV Market Revenue Million Forecast, by Geography 2019 & 2032
- Table 58: North America AUV and ROV Market Volume K Unit Forecast, by Geography 2019 & 2032
- Table 59: North America AUV and ROV Market Revenue Million Forecast, by Country 2019 & 2032
- Table 60: North America AUV and ROV Market Volume K Unit Forecast, by Country 2019 & 2032
Frequently Asked Questions
1. What is the projected Compound Annual Growth Rate (CAGR) of the North America AUV and ROV Market?
The projected CAGR is approximately 7.13%.
2. Which companies are prominent players in the North America AUV and ROV Market?
Key companies in the market include DOF Subsea AS, ROVOP, Fugro NV, Oceaneering International Inc, Delta SubSea LLC*List Not Exhaustive, Saipem SpA, DeepOcean AS, Helix Energy Solutions Group, Forum Energy Technologies Inc, TechnipFMC PLC.
3. What are the main segments of the North America AUV and ROV Market?
The market segments include Vehicle Type, Vehicle Class, Application, Activity, Geography.
4. Can you provide details about the market size?
The market size is estimated to be USD XX Million as of 2022.
5. What are some drivers contributing to market growth?
Increasing Offshore Oil and Gas Exploration Activities in the American. Asia-Pacific. and Middle East and African Regions4.; Growing Offshore Renewable Technologies.
6. What are the notable trends driving market growth?
Inspection. Repair. and Maintenance Activity to Witness Significant Growth.
7. Are there any restraints impacting market growth?
Ban on Offshore Exploration and Production Activities in Multiple Regions.
8. Can you provide examples of recent developments in the market?
In August 2022, VideoRay, LLC, reported a large and diverse order for its Defender remotely operated vehicles (ROVs) by the United States Navy. The Navy is standardizing on VideoRay Defender Mission Specialist systems due to the superior capabilities, flexibility and upgradeability of many systems deployed since 2019. VideoRay's customer support of the Navy includes training facilities and staffing on the East Coast in Pottstown, Pennsylvania, and the West Coast in San Diego.
9. What pricing options are available for accessing the report?
Pricing options include single-user, multi-user, and enterprise licenses priced at USD 4750, USD 5250, and USD 8750 respectively.
10. Is the market size provided in terms of value or volume?
The market size is provided in terms of value, measured in Million and volume, measured in K Unit.
11. Are there any specific market keywords associated with the report?
Yes, the market keyword associated with the report is "North America AUV and ROV Market," which aids in identifying and referencing the specific market segment covered.
12. How do I determine which pricing option suits my needs best?
The pricing options vary based on user requirements and access needs. Individual users may opt for single-user licenses, while businesses requiring broader access may choose multi-user or enterprise licenses for cost-effective access to the report.
13. Are there any additional resources or data provided in the North America AUV and ROV Market report?
While the report offers comprehensive insights, it's advisable to review the specific contents or supplementary materials provided to ascertain if additional resources or data are available.
14. How can I stay updated on further developments or reports in the North America AUV and ROV Market?
To stay informed about further developments, trends, and reports in the North America AUV and ROV Market, consider subscribing to industry newsletters, following relevant companies and organizations, or regularly checking reputable industry news sources and publications.
Methodology
Step 1 - Identification of Relevant Samples Size from Population Database


Step 2 - Approaches for Defining Global Market Size (Value, Volume* & Price*)

Note*: In applicable scenarios
Step 3 - Data Sources
Primary Research
- Web Analytics
- Survey Reports
- Research Institute
- Latest Research Reports
- Opinion Leaders
Secondary Research
- Annual Reports
- White Paper
- Latest Press Release
- Industry Association
- Paid Database
- Investor Presentations

Step 4 - Data Triangulation
Involves using different sources of information in order to increase the validity of a study
These sources are likely to be stakeholders in a program - participants, other researchers, program staff, other community members, and so on.
Then we put all data in single framework & apply various statistical tools to find out the dynamic on the market.
During the analysis stage, feedback from the stakeholder groups would be compared to determine areas of agreement as well as areas of divergence


