
Key Insights
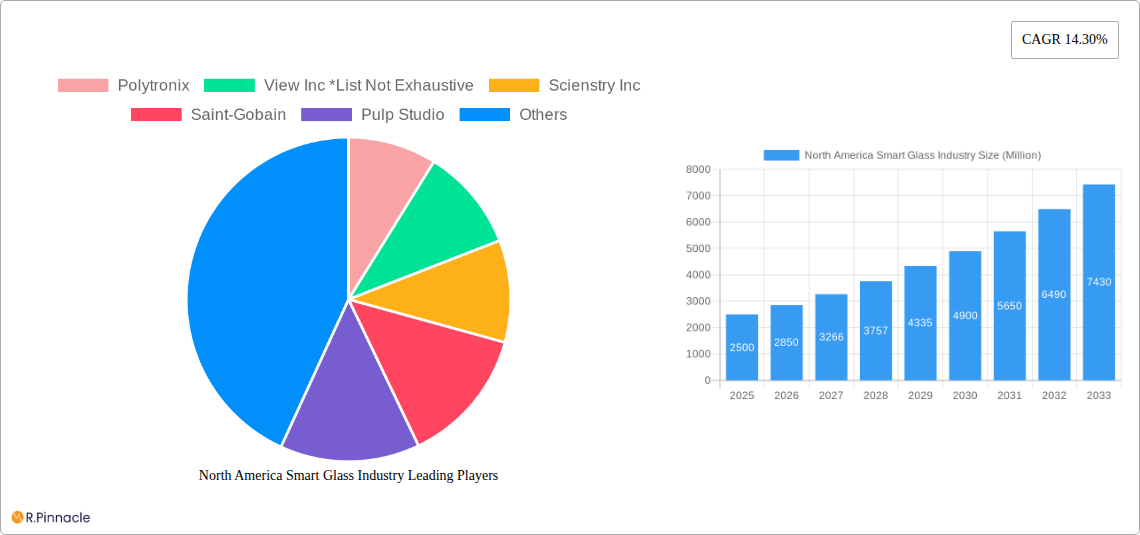
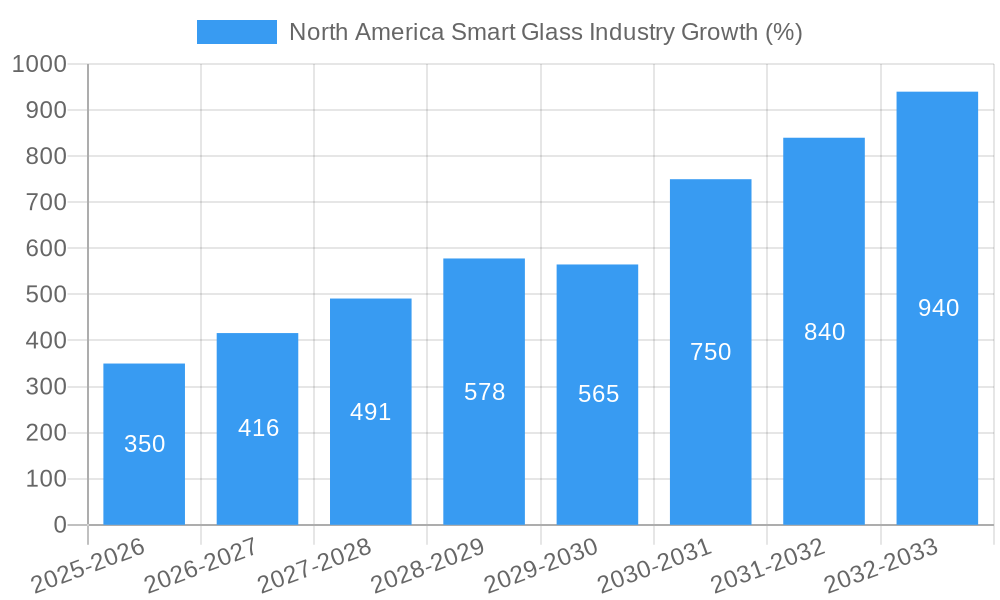
The North American smart glass market is experiencing robust growth, driven by increasing demand for energy-efficient buildings and advanced technological integration in various sectors. With a Compound Annual Growth Rate (CAGR) of 14.30% from 2019 to 2033, the market is projected to reach substantial size. Key drivers include the rising adoption of smart glass in commercial constructions to reduce energy consumption and improve aesthetics, coupled with growing applications in transportation (e.g., automotive sunroofs and windows) and consumer electronics. Technological advancements in Suspended Particle Devices, Liquid Crystals, Electro-chromic Glass, and Active Smart Glass are further fueling market expansion. The United States and Canada represent the largest market segments within North America, benefiting from a mature construction industry and a strong focus on sustainable infrastructure development. While challenges like high initial investment costs for smart glass technologies exist, ongoing innovation and government incentives promoting energy efficiency are mitigating these restraints. The segmentation by technology type showcases a diverse market, with liquid crystals and electrochromic glass holding significant shares, while active smart glass is expected to experience considerable growth due to its superior functionality and control capabilities. The market's growth is also spurred by the increasing adoption of smart homes and buildings, driving the need for integrated, energy-efficient solutions.
The competitive landscape is characterized by both established players like Saint-Gobain, PPG Industries, and Gentex Corporation, alongside innovative startups and niche players. These companies are constantly striving to enhance product features, reduce manufacturing costs, and explore new applications to maintain their market position. Further growth will be influenced by factors like evolving building codes favoring energy-efficient materials, technological breakthroughs leading to more affordable and versatile smart glass options, and increasing awareness among consumers and businesses about the long-term benefits of energy conservation. The forecast period (2025-2033) presents significant opportunities for market expansion, particularly in sectors such as renewable energy integration and advanced transportation systems. Successful players will be those that can adapt to shifting technological advancements and effectively cater to the growing demand for customized smart glass solutions across diverse applications.
North America Smart Glass Industry Market Report: 2019-2033
This comprehensive report provides an in-depth analysis of the North America smart glass industry, covering market size, growth drivers, technological advancements, and competitive landscape from 2019 to 2033. The report offers actionable insights for industry professionals, investors, and strategic decision-makers. With a focus on key players like Polytronix, View Inc, Scienstry Inc, Saint-Gobain, and others, this report is an essential resource for understanding the current state and future trajectory of this dynamic market. The base year for this report is 2025, with estimations for 2025 and forecasts extending to 2033.
North America Smart Glass Industry Market Structure & Innovation Trends
This section analyzes the North American smart glass market's structure, highlighting key trends shaping its evolution. The market is characterized by a moderately concentrated landscape, with several major players holding significant market share. However, the presence of numerous smaller, specialized companies indicates a dynamic and competitive environment. Innovation is driven by advancements in material science, electronics integration, and software development. Regulatory frameworks, including building codes and energy efficiency standards, significantly influence adoption rates. Product substitutes, such as traditional window coverings, pose a competitive challenge. The end-user demographics span diverse sectors, including construction, transportation, and consumer electronics.
- Market Concentration: The top 5 players account for approximately xx% of the market share in 2025.
- M&A Activity: The historical period (2019-2024) witnessed xx M&A deals with a total value of approximately $xx Million. We predict xx M&A deals with a value of $xx Million during the forecast period (2025-2033).
- Innovation Drivers: Advancements in electrochromic technology, liquid crystal displays, and suspended particle devices are key innovation drivers.
- Regulatory Landscape: Government incentives for energy-efficient buildings are boosting smart glass adoption.
North America Smart Glass Industry Market Dynamics & Trends
The North American smart glass market is experiencing robust growth, driven by increasing demand for energy-efficient buildings, advancements in smart home technology, and rising consumer awareness of sustainable building practices. The market's Compound Annual Growth Rate (CAGR) is projected at xx% from 2025 to 2033. Technological disruptions, particularly in the areas of flexible displays and self-powered smart glass, are reshaping the competitive landscape. Consumer preferences are shifting towards aesthetically pleasing, energy-efficient, and privacy-enhancing solutions. Competitive dynamics are characterized by intense rivalry among established players and emerging startups vying for market share. Market penetration is increasing steadily, particularly in commercial buildings and the automotive sector.
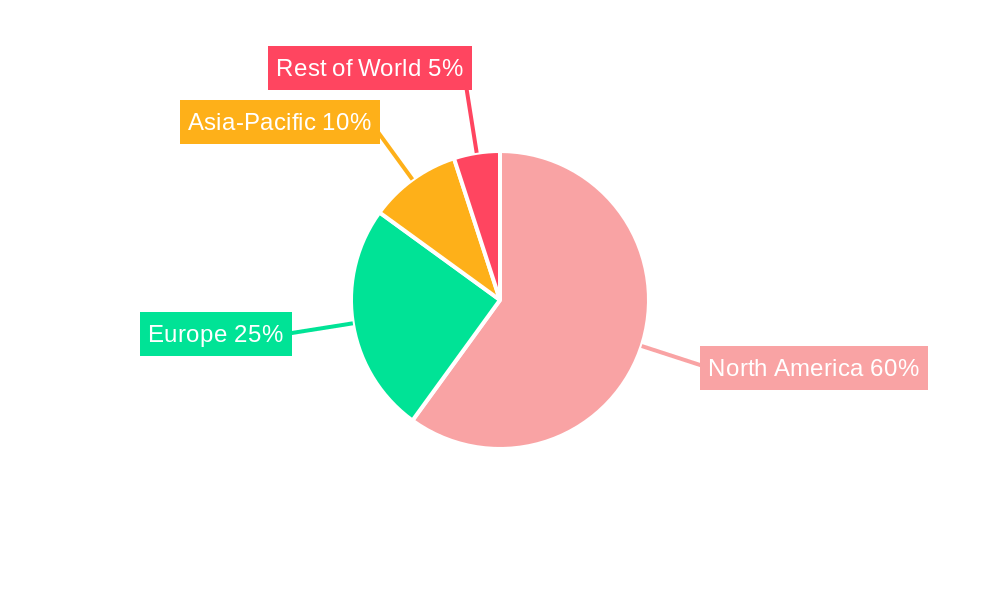
Dominant Regions & Segments in North America Smart Glass Industry
The United States currently dominates the North American smart glass market, fueled by robust construction activity, a strong focus on energy efficiency, and technological advancements. The commercial building segment is the largest application area, driven by the need for optimized energy consumption and enhanced building aesthetics. Electrochromic glass and liquid crystal technology are the dominant segments within the technology category.
- Key Drivers in the United States:
- Strong construction sector.
- Government incentives for energy-efficient buildings.
- High adoption rate in commercial buildings.
- Key Drivers in Canada: Growing investments in infrastructure projects and a focus on sustainable development are driving market growth.
Detailed analysis reveals that Electrochromic Glass holds the largest market share due to its superior performance and energy efficiency. The United States holds a majority share of the market due to high infrastructure development and favorable government regulations.
North America Smart Glass Industry Product Innovations
Recent innovations include advancements in electrochromic glass, offering improved dimming speeds, wider color ranges, and enhanced durability. Suspended Particle Devices (SPD) are gaining traction for their superior light control capabilities. Integration of smart sensors and controls further enhances functionalities, creating highly adaptable and responsive smart glass solutions. These innovations are improving market fit by addressing key consumer demands for energy efficiency, privacy, and aesthetic appeal.
Report Scope & Segmentation Analysis
This report segments the North American smart glass market by technology (Suspended Particle Devices, Liquid Crystals, Electrochromic Glass, Passive Smart glass, Active Smart glass, Others), application (Construction, Commercial Buildings, Transportation, Energy, Consumer Electronics, Others), and country (United States, Canada). Each segment is analyzed based on historical data, current market size, and future growth projections. Competitive dynamics vary across segments, reflecting the differing technological and application requirements. For instance, the electrochromic glass segment showcases high growth due to its superior performance, while the construction segment dominates due to large-scale adoption in commercial buildings. Market sizes are presented in Millions of USD.
Key Drivers of North America Smart Glass Industry Growth
Several factors fuel the growth of the North American smart glass industry. Technological advancements lead to improved energy efficiency, enhanced functionalities, and increased aesthetic appeal. Government regulations promoting energy-efficient buildings create a favorable policy environment. Increased construction activity and infrastructure development, especially in urban areas, significantly increase demand. Growing consumer awareness of sustainability and smart home technology further drives market adoption.
Challenges in the North America Smart Glass Industry Sector
High initial investment costs and complexities associated with smart glass installation can hinder adoption. Supply chain disruptions and material availability challenges can affect production and pricing. Intense competition among industry players creates pricing pressures. Regulatory hurdles and varying building codes across different regions can increase market entry barriers. The overall impact of these challenges on market growth is estimated to be approximately xx% reduction in the projected market size by 2033.
Emerging Opportunities in North America Smart Glass Industry
The integration of smart glass with IoT technologies presents new opportunities. Advancements in flexible and transparent displays are driving applications in various sectors, including the automotive industry and consumer electronics. Increasing demand for energy-efficient solutions in residential and commercial constructions opens new markets. The development of self-powered smart glass eliminates the need for external power sources. This opens up wider possibilities for deployment, particularly in applications where power supply is limited.
Leading Players in the North America Smart Glass Industry Market
- Polytronix
- View Inc
- Scienstry Inc
- Saint-Gobain
- Pulp Studio
- Smartglass International
- Citala
- Pro Display
- Asahi Glass Corporation
- Gentex Corporation
- Nippon
- Ravenbrick
- Hitachi Chemical
- LTI Smart Glass
- PPG Industries
Key Developments in North America Smart Glass Industry Industry
- September 2021: Xiaomi launched smart glasses with photo, messaging, calling, navigation, and real-time translation capabilities.
- September 2021: Facebook and Ray-Ban launched "Ray-Ban Stories" smart glasses for music, calls, photos, and video sharing. These launches significantly impacted market dynamics by raising consumer awareness and showcasing the diverse applications of smart glasses technology.
Future Outlook for North America Smart Glass Industry Market
The North American smart glass market is poised for continued growth, driven by technological innovations, increasing demand for energy efficiency, and expanding applications across various sectors. Strategic partnerships and collaborations among industry players are expected to further accelerate market expansion. The focus on developing cost-effective and easily integrable smart glass solutions will unlock new market opportunities. The market is expected to experience a significant expansion, with potential for large-scale adoption across residential and commercial building segments, the automotive industry, and consumer electronics.
North America Smart Glass Industry Segmentation
-
1. Technology
- 1.1. Suspended Particle Devices
- 1.2. Liquid Crystals
- 1.3. Electro-chromic Glass
- 1.4. Passive Smart glass
- 1.5. Active Smart glass
- 1.6. Others
-
2. Applications
-
2.1. Construction
- 2.1.1. Residential Buildings
- 2.1.2. Commercial Buildings
-
2.2. Transportation
- 2.2.1. Aerospace
- 2.2.2. Rail
- 2.2.3. Automotive
- 2.2.4. Others
- 2.3. Energy
- 2.4. Consumer Electronics
-
2.1. Construction
North America Smart Glass Industry Segmentation By Geography
-
1. North America
- 1.1. United States
- 1.2. Canada
- 1.3. Mexico
North America Smart Glass Industry REPORT HIGHLIGHTS
| Aspects | Details |
|---|---|
| Study Period | 2019-2033 |
| Base Year | 2024 |
| Estimated Year | 2025 |
| Forecast Period | 2025-2033 |
| Historical Period | 2019-2024 |
| Growth Rate | CAGR of 14.30% from 2019-2033 |
| Segmentation |
|
Table of Contents
- 1. Introduction
- 1.1. Research Scope
- 1.2. Market Segmentation
- 1.3. Research Methodology
- 1.4. Definitions and Assumptions
- 2. Executive Summary
- 2.1. Introduction
- 3. Market Dynamics
- 3.1. Introduction
- 3.2. Market Drivers
- 3.2.1. Increasing focus on Energy Conservation and Environment Friendly Technologies; Governmental Regulations; Increasing demand for energy savings techniques
- 3.3. Market Restrains
- 3.3.1. Lack of Awareness of Smart Glass Benefits; Technical Issues with the Usage of Large Size Smart Glass
- 3.4. Market Trends
- 3.4.1. Construction industry is expected to have further growth opportunities in the market
- 4. Market Factor Analysis
- 4.1. Porters Five Forces
- 4.2. Supply/Value Chain
- 4.3. PESTEL analysis
- 4.4. Market Entropy
- 4.5. Patent/Trademark Analysis
- 5. North America Smart Glass Industry Analysis, Insights and Forecast, 2019-2031
- 5.1. Market Analysis, Insights and Forecast - by Technology
- 5.1.1. Suspended Particle Devices
- 5.1.2. Liquid Crystals
- 5.1.3. Electro-chromic Glass
- 5.1.4. Passive Smart glass
- 5.1.5. Active Smart glass
- 5.1.6. Others
- 5.2. Market Analysis, Insights and Forecast - by Applications
- 5.2.1. Construction
- 5.2.1.1. Residential Buildings
- 5.2.1.2. Commercial Buildings
- 5.2.2. Transportation
- 5.2.2.1. Aerospace
- 5.2.2.2. Rail
- 5.2.2.3. Automotive
- 5.2.2.4. Others
- 5.2.3. Energy
- 5.2.4. Consumer Electronics
- 5.2.1. Construction
- 5.3. Market Analysis, Insights and Forecast - by Region
- 5.3.1. North America
- 5.1. Market Analysis, Insights and Forecast - by Technology
- 6. United States North America Smart Glass Industry Analysis, Insights and Forecast, 2019-2031
- 7. Canada North America Smart Glass Industry Analysis, Insights and Forecast, 2019-2031
- 8. Mexico North America Smart Glass Industry Analysis, Insights and Forecast, 2019-2031
- 9. Rest of North America North America Smart Glass Industry Analysis, Insights and Forecast, 2019-2031
- 10. Competitive Analysis
- 10.1. Market Share Analysis 2024
- 10.2. Company Profiles
- 10.2.1 Polytronix
- 10.2.1.1. Overview
- 10.2.1.2. Products
- 10.2.1.3. SWOT Analysis
- 10.2.1.4. Recent Developments
- 10.2.1.5. Financials (Based on Availability)
- 10.2.2 View Inc *List Not Exhaustive
- 10.2.2.1. Overview
- 10.2.2.2. Products
- 10.2.2.3. SWOT Analysis
- 10.2.2.4. Recent Developments
- 10.2.2.5. Financials (Based on Availability)
- 10.2.3 Scienstry Inc
- 10.2.3.1. Overview
- 10.2.3.2. Products
- 10.2.3.3. SWOT Analysis
- 10.2.3.4. Recent Developments
- 10.2.3.5. Financials (Based on Availability)
- 10.2.4 Saint-Gobain
- 10.2.4.1. Overview
- 10.2.4.2. Products
- 10.2.4.3. SWOT Analysis
- 10.2.4.4. Recent Developments
- 10.2.4.5. Financials (Based on Availability)
- 10.2.5 Pulp Studio
- 10.2.5.1. Overview
- 10.2.5.2. Products
- 10.2.5.3. SWOT Analysis
- 10.2.5.4. Recent Developments
- 10.2.5.5. Financials (Based on Availability)
- 10.2.6 Smartglass International
- 10.2.6.1. Overview
- 10.2.6.2. Products
- 10.2.6.3. SWOT Analysis
- 10.2.6.4. Recent Developments
- 10.2.6.5. Financials (Based on Availability)
- 10.2.7 Citala
- 10.2.7.1. Overview
- 10.2.7.2. Products
- 10.2.7.3. SWOT Analysis
- 10.2.7.4. Recent Developments
- 10.2.7.5. Financials (Based on Availability)
- 10.2.8 Pro Display
- 10.2.8.1. Overview
- 10.2.8.2. Products
- 10.2.8.3. SWOT Analysis
- 10.2.8.4. Recent Developments
- 10.2.8.5. Financials (Based on Availability)
- 10.2.9 Asahi Glass Corporation
- 10.2.9.1. Overview
- 10.2.9.2. Products
- 10.2.9.3. SWOT Analysis
- 10.2.9.4. Recent Developments
- 10.2.9.5. Financials (Based on Availability)
- 10.2.10 Gentex Corporation
- 10.2.10.1. Overview
- 10.2.10.2. Products
- 10.2.10.3. SWOT Analysis
- 10.2.10.4. Recent Developments
- 10.2.10.5. Financials (Based on Availability)
- 10.2.11 Nippon
- 10.2.11.1. Overview
- 10.2.11.2. Products
- 10.2.11.3. SWOT Analysis
- 10.2.11.4. Recent Developments
- 10.2.11.5. Financials (Based on Availability)
- 10.2.12 Ravenbrick
- 10.2.12.1. Overview
- 10.2.12.2. Products
- 10.2.12.3. SWOT Analysis
- 10.2.12.4. Recent Developments
- 10.2.12.5. Financials (Based on Availability)
- 10.2.13 Hitachi Chemical
- 10.2.13.1. Overview
- 10.2.13.2. Products
- 10.2.13.3. SWOT Analysis
- 10.2.13.4. Recent Developments
- 10.2.13.5. Financials (Based on Availability)
- 10.2.14 LTI Smart Glass
- 10.2.14.1. Overview
- 10.2.14.2. Products
- 10.2.14.3. SWOT Analysis
- 10.2.14.4. Recent Developments
- 10.2.14.5. Financials (Based on Availability)
- 10.2.15 PPG Industries
- 10.2.15.1. Overview
- 10.2.15.2. Products
- 10.2.15.3. SWOT Analysis
- 10.2.15.4. Recent Developments
- 10.2.15.5. Financials (Based on Availability)
- 10.2.1 Polytronix
List of Figures
- Figure 1: North America Smart Glass Industry Revenue Breakdown (Million, %) by Product 2024 & 2032
- Figure 2: North America Smart Glass Industry Share (%) by Company 2024
List of Tables
- Table 1: North America Smart Glass Industry Revenue Million Forecast, by Region 2019 & 2032
- Table 2: North America Smart Glass Industry Revenue Million Forecast, by Technology 2019 & 2032
- Table 3: North America Smart Glass Industry Revenue Million Forecast, by Applications 2019 & 2032
- Table 4: North America Smart Glass Industry Revenue Million Forecast, by Region 2019 & 2032
- Table 5: North America Smart Glass Industry Revenue Million Forecast, by Country 2019 & 2032
- Table 6: United States North America Smart Glass Industry Revenue (Million) Forecast, by Application 2019 & 2032
- Table 7: Canada North America Smart Glass Industry Revenue (Million) Forecast, by Application 2019 & 2032
- Table 8: Mexico North America Smart Glass Industry Revenue (Million) Forecast, by Application 2019 & 2032
- Table 9: Rest of North America North America Smart Glass Industry Revenue (Million) Forecast, by Application 2019 & 2032
- Table 10: North America Smart Glass Industry Revenue Million Forecast, by Technology 2019 & 2032
- Table 11: North America Smart Glass Industry Revenue Million Forecast, by Applications 2019 & 2032
- Table 12: North America Smart Glass Industry Revenue Million Forecast, by Country 2019 & 2032
- Table 13: United States North America Smart Glass Industry Revenue (Million) Forecast, by Application 2019 & 2032
- Table 14: Canada North America Smart Glass Industry Revenue (Million) Forecast, by Application 2019 & 2032
- Table 15: Mexico North America Smart Glass Industry Revenue (Million) Forecast, by Application 2019 & 2032
Frequently Asked Questions
1. What is the projected Compound Annual Growth Rate (CAGR) of the North America Smart Glass Industry?
The projected CAGR is approximately 14.30%.
2. Which companies are prominent players in the North America Smart Glass Industry?
Key companies in the market include Polytronix, View Inc *List Not Exhaustive, Scienstry Inc, Saint-Gobain, Pulp Studio, Smartglass International, Citala, Pro Display, Asahi Glass Corporation, Gentex Corporation, Nippon, Ravenbrick, Hitachi Chemical, LTI Smart Glass, PPG Industries.
3. What are the main segments of the North America Smart Glass Industry?
The market segments include Technology, Applications.
4. Can you provide details about the market size?
The market size is estimated to be USD XX Million as of 2022.
5. What are some drivers contributing to market growth?
Increasing focus on Energy Conservation and Environment Friendly Technologies; Governmental Regulations; Increasing demand for energy savings techniques.
6. What are the notable trends driving market growth?
Construction industry is expected to have further growth opportunities in the market.
7. Are there any restraints impacting market growth?
Lack of Awareness of Smart Glass Benefits; Technical Issues with the Usage of Large Size Smart Glass.
8. Can you provide examples of recent developments in the market?
September 2021: Xiaomi launched its own smart glasses, which are capable of taking photos, displaying messages and notifications, making calls, providing navigation, and translating text right in real-time in front of eyes. The glasses also have an indicator light that shows when the 5-megapixel camera is in use.
9. What pricing options are available for accessing the report?
Pricing options include single-user, multi-user, and enterprise licenses priced at USD 4750, USD 4950, and USD 6800 respectively.
10. Is the market size provided in terms of value or volume?
The market size is provided in terms of value, measured in Million.
11. Are there any specific market keywords associated with the report?
Yes, the market keyword associated with the report is "North America Smart Glass Industry," which aids in identifying and referencing the specific market segment covered.
12. How do I determine which pricing option suits my needs best?
The pricing options vary based on user requirements and access needs. Individual users may opt for single-user licenses, while businesses requiring broader access may choose multi-user or enterprise licenses for cost-effective access to the report.
13. Are there any additional resources or data provided in the North America Smart Glass Industry report?
While the report offers comprehensive insights, it's advisable to review the specific contents or supplementary materials provided to ascertain if additional resources or data are available.
14. How can I stay updated on further developments or reports in the North America Smart Glass Industry?
To stay informed about further developments, trends, and reports in the North America Smart Glass Industry, consider subscribing to industry newsletters, following relevant companies and organizations, or regularly checking reputable industry news sources and publications.
Methodology
Step 1 - Identification of Relevant Samples Size from Population Database


Step 2 - Approaches for Defining Global Market Size (Value, Volume* & Price*)

Note*: In applicable scenarios
Step 3 - Data Sources
Primary Research
- Web Analytics
- Survey Reports
- Research Institute
- Latest Research Reports
- Opinion Leaders
Secondary Research
- Annual Reports
- White Paper
- Latest Press Release
- Industry Association
- Paid Database
- Investor Presentations

Step 4 - Data Triangulation
Involves using different sources of information in order to increase the validity of a study
These sources are likely to be stakeholders in a program - participants, other researchers, program staff, other community members, and so on.
Then we put all data in single framework & apply various statistical tools to find out the dynamic on the market.
During the analysis stage, feedback from the stakeholder groups would be compared to determine areas of agreement as well as areas of divergence


